TradeCityPro | Bitcoin Daily Analysis #248👋 Welcome to TradeCity Pro!
Let’s move on to Bitcoin analysis. After a few days without posting an analysis, let’s take a look at Bitcoin and see what the market has been doing during this time.
⏳ 4-hour timeframe
On the 4-hour timeframe, Bitcoin hasn’t shown any major difference compared to our previous analysis and is still inside the same large range box between 84,500 and 93,789.
✔️ Since Bitcoin has been inside this box for a long time, additional support and resistance levels have also formed within the range.
💡 Currently, the price has formed a smaller range between 86,555 and 90,018, and it is fluctuating between these two zones with very low volume.
⭐ Since Bitcoin’s previous low was recorded at 84,500, if the price gets supported at 86,555 and forms a higher low compared to 84,500, the probability of breaking 90,018 will increase significantly.
🎯 If 90,018 breaks, bullish momentum can enter the market, and if this momentum comes along with increased volume, Bitcoin can also break the next resistance zones such as 93,789 and 96,476.
⚡️ With the break of 93,789, we can get confirmation of Bitcoin turning bullish. But before that, any long position that gets opened, I personally take profits quickly, because there is no strong momentum in the market.
🔔 For short positions, the triggers we currently have are 86,855 and 84,500.Price stabilization below 84,500 will confirm Bitcoin turning bearish.
❌ Disclaimer ❌
Trading futures is highly risky and dangerous. If you're not an expert, these triggers may not be suitable for you. You should first learn risk and capital management. You can also use the educational content from this channel.
Finally, these triggers reflect my personal opinions on price action, and the market may move completely against this analysis. So, do your own research before opening any position.
Dailyanalysis

GBPUSD at wait-and-react area.Price just pushed higher aggressively. That move corrected a large portion of the prior bearish leg. And just tapped back into a major resistance zone. This is a key decision point.
At this level, I’m not interested in chasing longs. Price is extended into resistance. So, if buyers fail to hold above this zone and price starts to stall, I expect price to reach 1.3337.
For longs to remain valid, price must hold above the zone and build structure. Without that, upside continuation is weak.
Until one side clearly proves control, this remains a wait-and-react area.
Trade safely and enjoy the Cosmic Journey recap TradingView rolled out this year.
www.tradingview.com

TradeCityPro | Bitcoin Daily Analysis #247👋 Welcome to TradeCity Pro!
Let’s move on to Bitcoin analysis; the market hasn’t changed much since yesterday and is still ranging.
⏳ 1-Hour Timeframe
Bitcoin is still in the range box between 89,849 and 90,590, and just like yesterday, it is fluctuating between these two zones today.
✔️ Today, the probability of movement during the New York session is high because Bitcoin is in a very small compression, and breaking this compression from either side can give us a position.
📊 Volume has decreased even further since yesterday, and this is another sign that a move is close. So, if volume enters and triggers are activated, a sharp move in Bitcoin could begin.
⭐ Today, we can open a short position after breaking the 89,849 zone.
🎲 The main short trigger is still 88,890, and breaking 89,849 will be the precursor to that.
↗️ For a long position, breaking 90,590 is a good trigger.We will get the main confirmation of Bitcoin turning bullish after a stabilization above 92,942 and 94,167.
💧 Today, any movement Bitcoin makes in either direction, if accompanied by increased volume, could continue.
✨ But if we see volume divergence, the likelihood of a fakeout increases.
❌ Disclaimer ❌
Trading futures is highly risky and dangerous. If you're not an expert, these triggers may not be suitable for you. You should first learn risk and capital management. You can also use the educational content from this channel.
Finally, these triggers reflect my personal opinions on price action, and the market may move completely against this analysis. So, do your own research before opening any position.

TradeCityPro | Bitcoin Daily Analysis #246👋 Welcome to TradeCity Pro!
Let’s move on to Bitcoin analysis. The market has been ranging for a few days, but it still gives positions, and if we stay behind the chart, we can make profits from the market.
⏳ 1-hour timeframe
On the 1-hour timeframe, Bitcoin has formed a range box between the 88890 and 94167 zones, and for several days it has been moving between these two areas.
✔️ Currently, near the bottom of the box, the price has created a smaller range between 89849 and 90590, and since today is Saturday and volume is low, it is ranging between these two zones.
💥 If the price exits this box, the next move can continue toward either the top or the bottom of the main box.
🔔 That means with a break of 89849, the move can continue down toward 88890.
🎲 But if 90590 breaks, I will wait for a higher low and higher high to form above this zone, and then I will enter a long position.
⛏ The next resistance zones for Bitcoin are 92942 and 94167.
🧩 We get confirmation of Bitcoin turning bullish with a break of 94167. In that case, an upward move in higher cycles can begin.
⭐ On the other hand, if the price stabilizes below 88890, it can move again toward the 84000 support.
❌ Disclaimer ❌
Trading futures is highly risky and dangerous. If you're not an expert, these triggers may not be suitable for you. You should first learn risk and capital management. You can also use the educational content from this channel.
Finally, these triggers reflect my personal opinions on price action, and the market may move completely against this analysis. So, do your own research before opening any position.

TradeCityPro | Bitcoin Daily Analysis #245👋 Welcome to TradeCity Pro!
Let’s move on to the Bitcoin analysis. After the fake move we had yesterday, today Bitcoin has entered a ranging box.
⏳ 1-hour timeframe
Yesterday on Bitcoin we had a trigger at the 91447 zone that we could use as a long trigger.
🎯 Before that, we also had a trigger on Bitcoin at 89849 which had been activated, and with the break of 91447 the second trigger was also activated.
🎲 After this trigger was activated, given the trend weakness we had on Bitcoin, the price could not stabilize above 91447, and with that move being faked, it dropped again to 89849.
⛏ The 89849 zone is an important support area on Bitcoin, and the next support we have on Bitcoin is 88890.
✔️ Considering that Bitcoin has faked both the 89849 low and the 91447 high once, we can say currently there is no specific trend in the market, and we can open both short and long positions.
📊 For a long position, again we can enter with the break of 91447 and open our position.
✔️ In case the market drops, we have two short triggers:
the first is 89849 and the second is 88890, and by breaking either of them we can have a trigger for a short.
❌ Disclaimer ❌
Trading futures is highly risky and dangerous. If you're not an expert, these triggers may not be suitable for you. You should first learn risk and capital management. You can also use the educational content from this channel.
Finally, these triggers reflect my personal opinions on price action, and the market may move completely against this analysis. So, do your own research before opening any position.

AUDUSD FRGNT DAILY FORECAST -Q4 | W50 | D9 | Y25 |📅 Q4 | W50 | D9 | Y25 |
📊 AUDUSD FRGNT DAILY FORECAST
🔍 Analysis Approach:
I’m applying Smart Money Concepts, focusing on:
Identifying Points of Interest on the Higher Time Frames (HTFs) 🕰️
Using those POIs to define a clear trading range 📐
Refining those zones on Lower Time Frames (LTFs) 🔎
Waiting for a Break of Structure (BoS) for confirmation ✅
This method allows me to stay precise, disciplined, and aligned with the market narrative, rather than chasing price.
💡 My Motto:
"Capital management, discipline, and consistency in your trading edge."
A positive risk-to-reward ratio, paired with a high win rate, is the backbone of any solid trading plan 📈🔐
⚠️ Losses?
They’re part of the mathematical game of trading 🎲
They don’t define you — they’re necessary, they happen, and we move forward 📊➡️
🙏 I appreciate you taking the time to review my Daily Forecast.
Stay sharp, stay consistent, and protect your capital
— FRNGT 🚀
FX:AUDUSD

GBPUSD Falling wedge pattern..Wedge patterns are commonly used by traders to gets profits . A perfect wedge pattern is established in 1 hour time frame, if it breaks upwards go for bullish ..
⚠️ Disclaimer:
This setup is shared for educational purposes only. It is not financial advice. Always do your own analysis and apply proper risk management before trading any setup.$

TradeCityPro | Bitcoin Daily Analysis #244👋 Welcome to TradeCity Pro!
Let’s move on to Bitcoin analysis; with the start of the new week, the market has taken a fresh trend.
⏳ 1-hour timeframe
Yesterday on Bitcoin, we had two very important levels that the price was fluctuating between.
⭐ The resistance zone 90022 and the support 88890 were the areas where breaking either of them could give us a position.
💥 The first position we could open yesterday was a short, which after breaking 88890 made a sharp move that would reach our target as well, but afterward the price started a bullish move, and after the previous bearish move turned into a fakeout, a lot of bullish momentum entered it.
💧 After this move, the 90022 trigger also activated, and Bitcoin moved upward to the 91447 area.
🧩 Overall, yesterday was a very volatile day, because after reaching 91447, Bitcoin corrected to near 88890, and then again moved upward.
🎲 But today Bitcoin was struggling with the 91447 zone, which it has so far managed to break, and with a bit of momentum and a slight slope, it is moving upward.
⚡️ We can see this trend weakness inside the RSI; the shape of the candles also shows a lot of trend weakness, but volume still doesn’t have a strong divergence with the bullish trend.
✔️ If this weakness continues, the probability of a fake break of 91447 and the start of a new bearish move increases a lot.
🔔 But if Bitcoin keeps its momentum and the move continues, the next zone the price can react to will be 93609.
❌ Disclaimer ❌
Trading futures is highly risky and dangerous. If you're not an expert, these triggers may not be suitable for you. You should first learn risk and capital management. You can also use the educational content from this channel.
Finally, these triggers reflect my personal opinions on price action, and the market may move completely against this analysis. So, do your own research before opening any position.

TradeCityPro | Bitcoin Daily Analysis #243👋 Welcome to TradeCity Pro!
Let’s move on to today’s Bitcoin analysis. The market is still ranging because it’s the weekend, but today there is a strong chance of movement.
⏳ 1-Hour Timeframe
After the drop to the 88,890 zone, the market formed a range structure yesterday, and Bitcoin is now preparing for its next move.
✔️ Bitcoin’s volume was very low yesterday (Saturday), and this low volume has continued today as well.
💡 However, since we’ve recently seen New York session volatility on Sundays, today we may also see movement.
💥 With RSI pulling back to the 50 level and failing to stabilize above it, bearish momentum can enter the market.
🧩 If RSI enters the oversold zone, this bearish momentum will increase even more.
🎲 If 88,890 breaks, opening a short position is logical, and the price may move toward 85,818.
⚖️ But today, the market can also give us a long setup.If the 90,022 level breaks, we can look for a long position.
🎯 The next resistance levels for Bitcoin are 91,974 and 93,609.
✨ The most important note for both triggers is VOLUME.The breakout must be supported by increasing volume.
📊 If volume stays this low and doesn’t improve, the probability of fake breakouts increases significantly.
🔭 But if the breakout happens with rising volume, the trend can continue smoothly.
❌ Disclaimer ❌
Trading futures is highly risky and dangerous. If you're not an expert, these triggers may not be suitable for you. You should first learn risk and capital management. You can also use the educational content from this channel.
Finally, these triggers reflect my personal opinions on price action, and the market may move completely against this analysis. So, do your own research before opening any position.

TradeCityPro | Bitcoin Daily Analysis #242👋 Welcome to TradeCityPro!
Let’s move on to the Bitcoin analysis. Today is Saturday, and after yesterday’s drop, the market is ranging and resting.
⌛️ 1-Hour Timeframe
Yesterday, we saw clear signs of correction and bearish momentum in Bitcoin, and with a sell-off candle, the price dropped to the 89,082 level.
🔭 After reaching this zone, the correction has paused, and Bitcoin is now moving sideways near 89,082.
💥 On the RSI oscillator, we had a descending trendline that RSI respected very well.
✨ Now that this trendline has been broken, RSI is testing the 42.25 resistance level.
⚡️ If RSI breaks above this level, we will have the first signal of bullish momentum returning to Bitcoin.
🎲 If we get that confirmation from RSI, we can then look for a long trigger on the Bitcoin chart itself.
🧩 Once BTC breaks the short-term structure it forms by then, we can open a long position.
🎯 However, since today is Saturday, I personally prefer to wait and avoid opening any trades until the new week starts.
💡 Still, I’ll stay behind the chart, and if the bullish scenario plays out, I will open a long position.
📊 For a short position, we can enter on a break of 89,082, but honestly, many altcoins paired with BTC have much better short triggers right now.
❌ Disclaimer ❌
Trading futures is highly risky and dangerous. If you're not an expert, these triggers may not be suitable for you. You should first learn risk and capital management. You can also use the educational content from this channel.
Finally, these triggers reflect my personal opinions on price action, and the market may move completely against this analysis. So, do your own research before opening any position.

TradeCityPro | Bitcoin Daily Analysis #241👋 Welcome to TradeCity Pro!
Let’s move on to today’s Bitcoin analysis. The market is currently in a downward correction phase.
⏳ 1-Hour Timeframe
Yesterday, Bitcoin corrected down to 91,974, and as I mentioned, the bullish momentum the market had was gone.
🔔 Now the correction has become deeper, and the price has fallen to 90,421.
✔️ The last candle we saw shows strong seller dominance, and with the high selling volume, it could very well be the beginning of a new downward move.
💥 The RSI oscillator, after resetting yesterday, has now dropped all the way to the 30 level, with the possibility of breaking below it and entering the oversold zone.
💫 If that happens, given the strong selling pressure and powerful red candles, the probability of a drop toward lower levels will increase significantly.
🧩 One area the price hasn’t reacted to properly is 89,082.
🎲 This level used to be very important for Bitcoin, but recently the price hasn’t respected it much.
⭐ If the price again fails to react to this level on the next move down, we can conclude that this support has weakened.
⚖️ However, in my opinion, if buyers are going to step in, this level is not a bad candidate for a reaction.
🔭 If Bitcoin gets supported at 89,082 and moves upward, it will form a higher low compared to 85,220, which increases the probability of a bullish structure forming.
☘️ But if 89,082 breaks, the downward move toward 85,220 will begin, and that could even signal the start of the next major bearish wave on the daily timeframe.
❌ Disclaimer ❌
Trading futures is highly risky and dangerous. If you're not an expert, these triggers may not be suitable for you. You should first learn risk and capital management. You can also use the educational content from this channel.
Finally, these triggers reflect my personal opinions on price action, and the market may move completely against this analysis. So, do your own research before opening any position.

TradeCityPro | Bitcoin Daily Analysis #240👋 Welcome to TradeCity Pro!
Let’s move on to today’s Bitcoin analysis. The market has started its correction phase today.
⏳ 1-Hour Timeframe
Yesterday, Bitcoin had a very strong bullish momentum and reached the 93,609 level.
✨ Breaking this level could have continued Bitcoin’s upward movement, but the price failed to break through and faked it, starting a correction instead.
💥 The RSI oscillator, as I mentioned before, was showing strong bullish momentum while above the 50 level. However, with the break of this level, the bullish momentum faded, and Bitcoin entered a deeper correction.
📊 During this correction, volume has decreased significantly, and the price has corrected down to 91,974.
The reaction of the price to this level is very important.
⚡️ If the price is supported at 91,974, the likelihood of breaking the resistance increases, and the price could break through this level in future attempts.
💫 However, if the price breaks 91,974 and volume increases, Bitcoin could see deeper corrections, potentially moving to 90,421 or even 88,082.
✔️ For now, I’m only looking for long positions and will open a long position if 93,609 is broken.
⭐ However, I won’t open a short position if 91,974 breaks; I’ll wait for more bearish momentum to enter the market before considering a short.
❌ Disclaimer ❌
Trading futures is highly risky and dangerous. If you're not an expert, these triggers may not be suitable for you. You should first learn risk and capital management. You can also use the educational content from this channel.
Finally, these triggers reflect my personal opinions on price action, and the market may move completely against this analysis. So, do your own research before opening any position.

TradeCityPro | Bitcoin Daily Analysis #239👋 Welcome to TradeCity Pro!
Let’s move on to today’s Bitcoin analysis. The market has started a new bullish move, which seems to be the beginning of a sharp upward move.
⏳ 1-Hour Timeframe
Yesterday, after the previous drop, Bitcoin created a range structure, and the bullish move began with the break of the 87,088 resistance.
🔔 This move was very sharp, and the price continued its way up to 93,609, a level that is very important for Bitcoin’s future trend.
⚡️ Currently, after reaching 93,609, the price has entered a range and correction phase, with a pullback to the 91,974 level, preparing for the next upward move.
📊 If volume starts to increase, we can open a long position after the 93,609 level is broken.
🧩 Breaking this level has been a long-awaited trigger for a long position.
💥 The RSI oscillator, after entering the overbought zone, has now reset. If the price starts moving upwards again, and RSI enters the overbought zone once more, we can get momentum confirmation for the next leg up.
❌ Disclaimer ❌
Trading futures is highly risky and dangerous. If you're not an expert, these triggers may not be suitable for you. You should first learn risk and capital management. You can also use the educational content from this channel.
Finally, these triggers reflect my personal opinions on price action, and the market may move completely against this analysis. So, do your own research before opening any position.

TradeCityPro | Bitcoin Daily Analysis #238👋 Welcome to TradeCity Pro!
Let’s move on to today’s Bitcoin analysis. The market is currently in a correction phase after the bearish leg it experienced yesterday.
⏳ 1-Hour Timeframe
After the drop Bitcoin made, even fake-breaking the 85,220 level,
✔️ the price has started its correction, reaching up to 87,088.
🔔 During this correction, a Head & Shoulders pattern has formed, with the activation trigger being the 87,088 level.
💥 If this pattern gets activated, deeper corrections could follow.
The next resistance zone to watch is 89,082.
📊 Market volume has increased with the start of the new week, but during this correction, the volume is decreasing. This indicates that the downtrend still holds strength, and the likelihood of the trend continuing remains high.
💡 In this case, we can open a short position either after a fakeout at 89,082 or by confirming a Dow Theory breakdown.
The main short trigger right now is the 85,220 level.
📈 For a long position, breaking 89,082 is a risky trigger.
Personally, I prefer to wait for more confirmation before deciding to enter a long position on Bitcoin.
❌ Disclaimer ❌
Trading futures is highly risky and dangerous. If you're not an expert, these triggers may not be suitable for you. You should first learn risk and capital management. You can also use the educational content from this channel.
Finally, these triggers reflect my personal opinions on price action, and the market may move completely against this analysis. So, do your own research before opening any position.

Intraday Analysis: Nifty 2nd Dec 2025A double bottom is under formation for Nifty50 prices
Trading bias and strategy is shared in the video for entry, targets.
Exit point for buy will be below 26040 spot

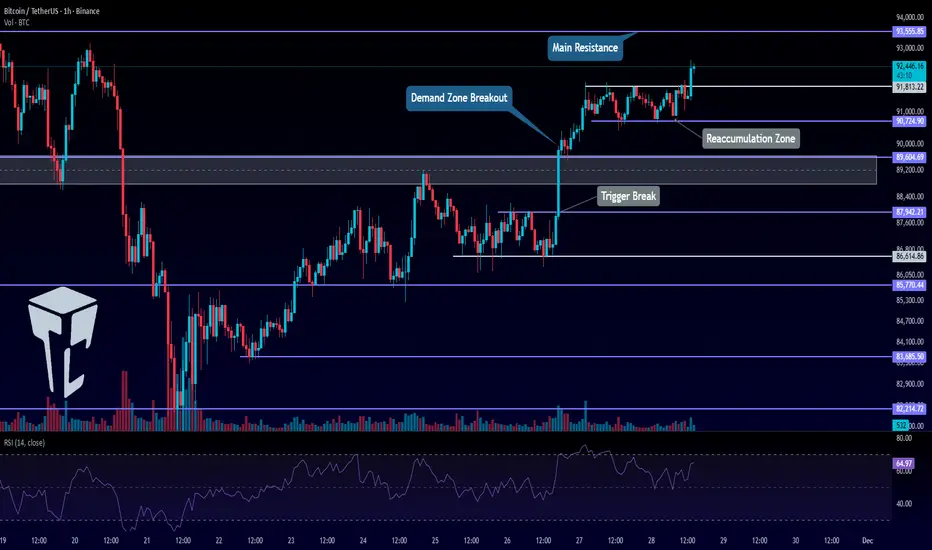
TradeCityPro | Bitcoin Daily Analysis #237👋 Welcome to TradeCityPro!
Let’s move on to the Bitcoin analysis. The market experienced a strong drop yesterday, and with the start of a new week and a new month, a fresh trend is beginning to form.
⏳ 1-Hour Timeframe
Yesterday, we had a long trigger on Bitcoin at 91,089. After activation, the price moved upward toward 91,813.
🔔 The 91,813 level was our next long trigger, and breaking it could have pushed the price toward the main resistance at 93,555.
✔️ But that didn’t happen.
The price was rejected from 91,813, and gradually, selling pressure increased across the market.
📊 Once the price stabilized below 90,421 — which was our short trigger — the main bearish move began. Bitcoin dropped sharply with a large bearish candle all the way down to 85,770.
🔍 The support zones at 89,082 and 87,942 did not hold either, because the move was extremely sharp and the price ignored them entirely.
💥 If you remember, we also had a momentum support on the RSI at 42.11.
💫 Once RSI stabilized below that level, the bullish momentum completely disappeared. Momentum shifted fully to bearish.
⚡️ Right now, RSI is still in the oversold zone and is pulling back toward the 30 level.
⚖️ If RSI starts moving downward again from here, Bitcoin has the potential to drop much further.
💡 Today, opening a position is much riskier than yesterday, but if you missed the move, breaking 85,770 isn’t a bad option for a continuation short.
✨ Just be careful: the market today is far more risky, so take positions with smaller risk and tighter management.
❌ Disclaimer ❌
Trading futures is highly risky and dangerous. If you're not an expert, these triggers may not be suitable for you. You should first learn risk and capital management. You can also use the educational content from this channel.
Finally, these triggers reflect my personal opinions on price action, and the market may move completely against this analysis. So, do your own research before opening any position.

USDCAD FRGNT RECAP + 4% / + 18 % - Q4 | W48 | Y25 |📅 Q4 | W48 | Y25 |
📊 USDCAD FRGNT RECAP + 4% / + 18 %
🔍 Analysis Approach:
I’m applying Smart Money Concepts, focusing on:
Identifying Points of Interest on the Higher Time Frames (HTFs) 🕰️
Using those POIs to define a clear trading range 📐
Refining those zones on Lower Time Frames (LTFs) 🔎
Waiting for a Break of Structure (BoS) for confirmation ✅
This method allows me to stay precise, disciplined, and aligned with the market narrative, rather than chasing price.
💡 My Motto:
"Capital management, discipline, and consistency in your trading edge."
A positive risk-to-reward ratio, paired with a high win rate, is the backbone of any solid trading plan 📈🔐
⚠️ Losses?
They’re part of the mathematical game of trading 🎲
They don’t define you — they’re necessary, they happen, and we move forward 📊➡️
🙏 I appreciate you taking the time to review my Daily Forecast.
Stay sharp, stay consistent, and protect your capital
— FRNGT 🚀

TradeCityPro | Bitcoin Daily Analysis #236👋 Welcome to TradeCity Pro!
Let’s move on to today’s Bitcoin analysis, the market has formed a new structure and is now ready for its next move.
⏳ 1-Hour Timeframe
Today, Bitcoin formed a support low at 90,421, and the long trigger at 91,089 has already been activated.
💥 The RSI oscillator has been supported again at the 42.11 level, gaining bullish momentum. With this renewed momentum, the price can now move toward higher levels such as 91,813 and 93,555.
✨ The break of 91,813 can be used as the next long trigger.
The next major resistance zone is 93,555.
🔽 For short positions, the break of 90,421 is a strong trigger, and it would also serve as the first confirmation for the continuation of the daily timeframe downtrend.
✔️ The next support zones on Bitcoin are 89,082 and 87,942.
❌ Disclaimer ❌
Trading futures is highly risky and dangerous. If you're not an expert, these triggers may not be suitable for you. You should first learn risk and capital management. You can also use the educational content from this channel.
Finally, these triggers reflect my personal opinions on price action, and the market may move completely against this analysis. So, do your own research before opening any position.

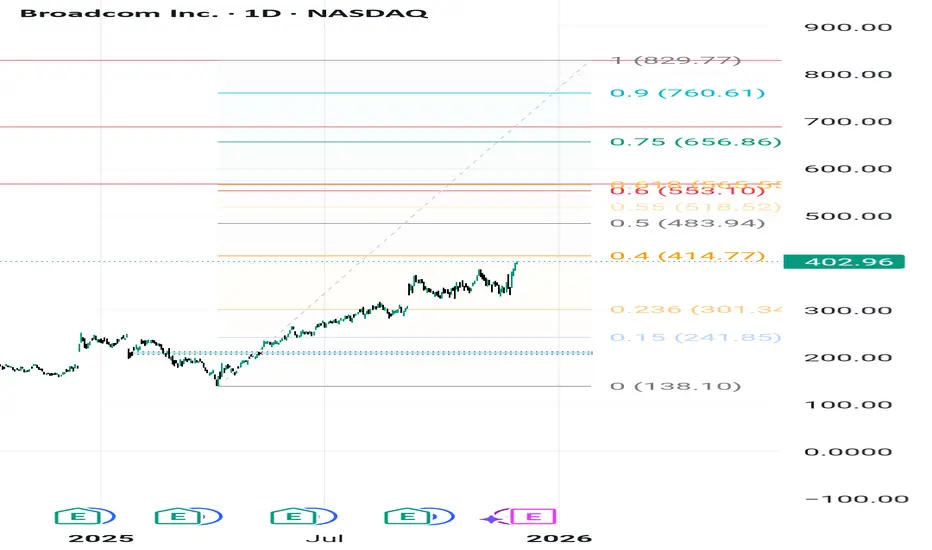
AVGO: Path to $829.77 – Navigating Critical Fibonacci Zones1. Overall Thesis and Price Structure
Broadcom Inc. (AVGO) exhibits a strong underlying bullish trend, fundamentally driven by demand for its AI chips and the successful integration of VMware. The technical objective targets a final high of $829.77. However, the path requires breaking through significant resistance levels defined by the Fibonacci structure. The current price is \mathbf{\$402.96}, maintaining the bullish momentum.
2. Crucial Resistance and Volatility Points
The analysis identifies two critical intermediate targets. The first and most significant hurdle is at $567.10, which aligns closely with the \mathbf{0.618} Fibonacci Golden Ratio. This zone is expected to trigger major volatility, profit-taking, and consolidation. The price action at $567.10 is the key test for trend continuity. Should the price break this level decisively, the next primary resistance target is $688.63, paving the way for the ultimate goal.
3. Key Support and Trend Invalidation
The long-term structural support, or the "Invalidation Point" for the bullish scenario, is the Key Zone at \mathbf{\$206.00}. As long as AVGO trades above this level, the multi-year uptrend remains valid. In the short term, the stock needs to overcome immediate resistance near $414.77 to gather momentum and continue its push towards the intermediate Fibonacci targets.
TradeCityPro | Bitcoin Daily Analysis #235👋 Welcome to TradeCity Pro!
Let’s move on to the Bitcoin analysis. Today is Saturday, it’s the weekend, and market volume and volatility have dropped significantly.
⏳ 1-Hour Timeframe
The long trigger we had yesterday on Bitcoin was broken, but the market didn’t continue upward, instead, it turned into a fake breakout.
⚖️ The main resistance on Bitcoin remains 93,555, and the price didn’t reach this level. Sellers entered the market earlier than expected and took control before price could reach the resistance.
💫 After this fakeout and with the weekend arriving, trading volume has decreased sharply, the difference in volume before and after the fakeout is very noticeable.
🔭 This low volume has caused the price to slowly drift downward with a very weak slope, and it’s currently fluctuating around the 90,724 zone.
📊 Additionally, because volume is so low, the price is not reacting cleanly to levels and is not respecting them, which is normal when market depth decreases.
✅ At the moment, I don’t think the market is in a good condition to open new positions.
💡 The main resistance zone on Bitcoin is still 93,555, and breaking this level will turn the trend bullish.
✨ As long as the price is above 89,000, I do not consider the trend bearish, but this does not mean the market is bullish either.
🎲 Right now, Bitcoin has no clear trend, and for a new trend to form, we must wait for a confirmed breakout either above 93,555 or below 89,000.
❌ Disclaimer ❌
Trading futures is highly risky and dangerous. If you're not an expert, these triggers may not be suitable for you. You should first learn risk and capital management. You can also use the educational content from this channel.
Finally, these triggers reflect my personal opinions on price action, and the market may move completely against this analysis. So, do your own research before opening any position.

TradeCityPro | Bitcoin Daily Analysis #234👋 Welcome to TradeCityPro!
Let’s move on to the Bitcoin analysis. The market is continuing the upward movement it started earlier.
⏳ 1-Hour Timeframe
Yesterday, after breaking the resistance zone, Bitcoin entered a small ranging box, and now the price has managed to stabilize above this box.
🔔 This range allowed the price to rest, and with new momentum entering the market, Bitcoin is now ready to move toward the 93,555 level.
💥 The RSI oscillator has formed a new momentum low around the 50 level.
✔️ This shows increased bullish momentum compared to the previous leg, because in the previous leg, RSI’s support was at 21.
✨ If this new RSI low holds, the market’s momentum will remain bullish, allowing the price to continue its upward movement.
📊 The triggers we previously had 87,942, 89,000, and 91,813 all activated and are currently in profit.
The next trigger for Bitcoin is at 93,555.
⭐ When the price reaches 93,555, there is a high probability that the market will begin ranging again or enter a correction.
⚡️ So if I see signs of exhaustion or reversal at that level, I will manage risk and take profits on my positions.
❌ Disclaimer ❌
Trading futures is highly risky and dangerous. If you're not an expert, these triggers may not be suitable for you. You should first learn risk and capital management. You can also use the educational content from this channel.
Finally, these triggers reflect my personal opinions on price action, and the market may move completely against this analysis. So, do your own research before opening any position.
TradeCityPro | Bitcoin Daily Analysis #233👋 Welcome to TradeCity Pro!
Let’s dive into today’s Bitcoin analysis. The market is moving upwards today, and yesterday, the long triggers we discussed were activated.
⏳ 1-Hour Timeframe
In yesterday’s analysis, I mentioned that Bitcoin was sitting at its momentum support zone in RSI. I also pointed out that if the RSI was supported at this level, the bullish momentum would be revived in the market.
⭐ This is exactly what happened. With the RSI support, buying volume entered the market, and after breaking the 87,942 level, we had our first long entry trigger.
✔️ The reason for this early entry, as mentioned in yesterday's analysis, was that we had confirmation of momentum from the RSI. This allowed us to enter the position earlier than waiting for the 89,000 level to break.
💥 The second main trigger for Bitcoin was the break of the 89,000 level, which happened with a strong bullish candle. If you didn’t have a stop buy order, you likely missed the chance to open the position.
💡 Currently, after breaking this level, the price has shown some weakness and reacted to the 91,581 zone, with the RSI moving out of the overbought zone.
📊 The volume during the last few green candles was low, and now, with the red candles, the volume is increasing.
⚖️ If the correction continues and becomes deeper, the price might pull back to the 89,000 zone. However, as long as the price remains above 89,000, I believe the short-term market trend will remain bullish, and a deeper downward leg is not expected on higher cycles.
💫 We can use the 89,000 level as a short trigger for the next bearish wave in the market.
🎲 In this case, the main support zones to watch are 86,614 and 82,214.
📈 For long positions, today, if Bitcoin breaks above 91,581, we can open a position. However, there is a very important resistance at the 93,555 level, which is the main trigger for confirming the bullish trend. It’s better to wait until this level is broken before actively pursuing a long position.
❌ Disclaimer ❌
Trading futures is highly risky and dangerous. If you're not an expert, these triggers may not be suitable for you. You should first learn risk and capital management. You can also use the educational content from this channel.
Finally, these triggers reflect my personal opinions on price action, and the market may move completely against this analysis. So, do your own research before opening any position.
