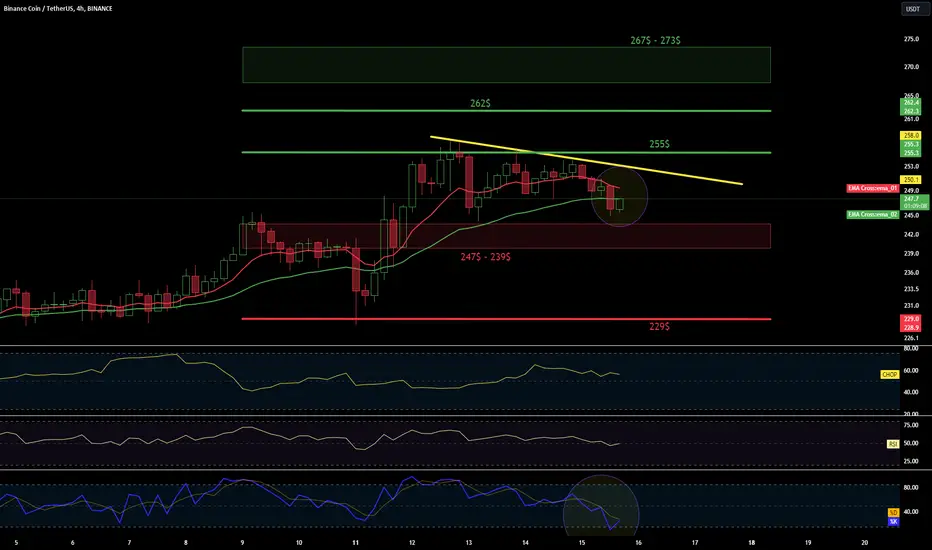
BNB/USDT 4HInterval ChartI invite you to review the chart of BNB in pair with USDT, also on a four-hour time frame. First, we will use the yellow line to determine the local downward trend under which the price is moving.
In order to determine the current supports for the BNB price, we will unfold the trend based fib extension grid, and we can see that the price is approaching a strong support zone from $247 to $239, however, if we break down from this zone, we can see the price return to the support area at $229.
Looking the other way, we can similarly mark places where the price should encounter resistance on the way up. And here, first, there is strong resistance at the price of $255, then there is resistance at the level of $262 at the golden Fib point, and then the price has to face a strong resistance zone from $267 to $273.
Please look at the STOCH indicator, where we have a strong rebound and there is room for us to go a little lower, but moving near the lower border we can observe an attempt at a rebound and small increases.
And when we look at Ema cross 10 and 30, we can see that they do not yet indicate confirmation of a return to the downward trend.
Dailyanalysis
Will BTC overcome the resistance?Hello everyone, I invite you to check the current situation on BTC in the USDT pair, taking into account the four-hour interval. First, we will use the yellow line to determine the local downward trend, to which the price quickly returned.
Now we can move on to marking support areas in the event of a correction. And here, first of all, it is worth marking the support at the price level of $41,795, then we have visible support at the price of $40,711, and then we will define a strong support zone from $39,957 to $38,938.
Looking the other way, we can determine resistance locations in a similar way using the trend based fib extension tool. First, we will mark a strong resistance zone from $43,199 to $44,472, when it is overcome and positively tested, the path towards the resistance at $46,500 will open.
At this point, it is worth looking at EMA Cross 10 and 30, which indicate that the price tried to return to the upward trend, but everything indicates that this attempt was unsuccessful. And again the red line is approaching the intersection of the green ema cross 30 line.
Please pay attention to the CHOP index, which indicates that the sideways price movement has regained energy, the RSI indicator shows room for further declines, while the STOCH indicator, in line with recent predictions, has recovered and there is still room to pull the price lower.

BTC 4H Chart Hello everyone, let's take a look at the BTC to USDT chart on a four-hour time frame. As you can see, the price has returned and remains on the local downtrend line.
When we unfold the Trend-Based Fib Extension grid, we can determine the support zone from $41,250 to $40,716, then support at $39,954, and further support at $38,988.
Looking the other way, there is a strong resistance zone from $43,182 to $43,737, followed by strong resistance around $44,441.
On the RSI indicator, we remain in the middle of the range, but on the STOCH indicator, we are moving at the upper limit, which may result in a price recovery.

BTC Check 1HInterval ChartHello everyone, I invite you to check the current situation on BTC in the USDT pair, taking into account the one-hour interval. First, we will use white lines to mark the local channel of the upward trend from which the BTC price broke down, while it is worth defining the local downward trend with the yellow line.
Now we can move on to marking support areas in case the correction deepens. For this purpose, we will unfold the Trend based fib extension grid, and we can see support at the level of $40,510, while it is worth defining the support zone from $38,697 to $37,732.
Looking the other way, we can determine resistance areas in a similar way. First, we will mark the resistance zone at which the price stopped from $42,018 to $42,423, when it is overcome, we again have active resistance at the level of $43,591, and then there is resistance above the upper border of the previously mentioned channel at the level of $45,488.
At this point, it is worth looking at the moving averages 50 and 200, which show the place where the yellow ema cross 50 line crossed the blue ema cross 200 line, confirming the return to the downward trend.
Please pay attention to the CHOP index, which indicates that most of the energy has been used in the upward movement, on the RSI indicator we have returned to the upper limit, with room for growth, while the STOCH indicator is moving at the upper limit, which may limit the growth and provide a rebound in the coming time .

BTC before a major correction?Hello everyone, I invite you to update the situation on BTC in the USDT pair, taking into account the one-day interval. We will start today's review by defining the trend line and here we can use the white line to determine the main upward trend, then we will mark the second upward trend line in the same way and locally the third one on which the price is currently based during the recovery.
Now we can unfold the Fib Retracement grid and identify a very important resistance zone from $41,283 to $48,336, where the price is struggling to stay in the local uptrend and before the start of the long-awaited larger correction.
However, if the current decline turns out to be the beginning of the long-awaited strong correction, in this situation we see that the local support that has held the price at the moment is the level of $39,982, while further we can go down to the level of $37,077 and then to the vicinity of the second line of the upward trend to the support zone from level $32,399 to $29,032.
Additionally, the currently expected correction should be close to the level of approximately thirty percent. WHAT coincides with our support zone.
When we look at the CHOP indicator, we can see that the energy has been used for the decline and we are currently experiencing a slight rebound, the RSI shows a rebound, but we are still high, just like the STOCH indicator, there is still room for the price to go lower.

BTC/USDT Short-Term 1H ChartHello everyone, let's take a look at the BTC to USDT chart on a one hour time frame. As you can see, the price is moving above the local uptrend line.
Let's start by marking the support line and as you can see, the price remains above the support zone from $43,938 to $43,683, and then we have a very strong zone from $43,068 to $42,605.
Looking the other way, you can see the resistance zone from $44,194 to $44,472, and then a path will open towards the second zone from $45,242 to $45,651.
Looking at the CHOP indicator, we see that it is gathering more and more energy, on the RSI indicator we have returned to the middle of the range, while the STOCH indicator has rebounded from the lower limit and resulted in an increase in price, but the energy is quickly used for recovery.

BTC ahead of a possible upward move?Hello everyone, I invite you to review the current situation of BTC in the USDT pair on a one-hour time frame, and here we will start by defining the downward trend channel in which we are moving using the blue lines. In this channel, we can mark two reflections from the upper border and three price reflections from the lower border, which may potentially indicate an attempt to leave the channel at the top and a potential upward movement oscillating by the height of the mentioned channel.
Going further, using the Trend Based Fib Extension tool, we will check current support locations for the price as the correction deepens. And here we can determine the first support at the level of $43,674, while a strong support zone is still visible at the lower border of the channel from $43,216 to $43,019.
Looking the other way, we will similarly determine the resistances that the BTC price must face, and here there is a strong resistance at the level of $44138, just above the upper border of the channel, however, if the price tries to exit the channel upwards, we can see a move to the strong resistance zone from 44653 $ to $44,921, and then the road towards $45,716 will open.
Please look at the CHOP indicator, which confirms that there is still energy for a move, on the RSI indicator we are moving around the middle of the range, while the STOCH indicator is at the upper limit, which may translate into a slightly greater recovery.

BTC before the resistance zoneHello everyone, as we can see, the BTC price remains below the local downtrend line.
When we unfold the Trend Based Fib Extension grid, we will be able to determine support areas for the price and here we can see support at the level of $42,815, while further we can see a decline to the zone from $43,502 to $43,237.
Looking the other way, there is a strong resistance zone ahead of the price from $44,086 to $44,280, but there is still plenty of room for a move to $44,836.

BTC/USDT Short-TermHello everyone, let's take a look at the BTC to USDT chart on a 15 minute time frame. As you can see, the price moved higher from the local downtrend line.
When we unfold the Trend Based Fib Extension tool, we see support at the level of $41,683, while there is also a support zone from $41,250 to $41,022.
Looking the other way, we have visible resistance at $42,153, but when the price overcomes it, we can see an increase to the resistance zone from $42,548 to $42,755.
The RSI indicator has returned to the upper part of the range, which limits room for growth, while the STOCH indicator shows a rebound with room for the price to maintain its decline.

BTC Long-Term 1DChartHello everyone, I invite you to review the situation of BTC in the USDT pair, taking into account the one-day interval. Let's start by defining the downtrend line that has been broken out with a white line, and then we can mark the uptrend line in the same way. Then, using the yellow line, we will determine the upward trend line, which is at a slightly higher level than the trend line itself.
Looking at the recent dynamic increases, it is worth checking where the price should resist further increases. And here, after deploying the Fib Retracement tool, we have a clearly visible strong resistance zone from $41,335 to $48,294, which is where the BTC price enters. Only when we manage to get out of this zone and positively test it, should the path towards the previous ATH be opened. at $68,488.
At this point, it is also worth checking where the most important support points are in a situation when the market starts to turn and we see a correction. Here you can see possible resistance around $36,000, but much more significant is the strong resistance zone from $37,737 to $28,638, if this zone is broken further we may see equally strong resistance around $25,540.
Let us also remember about the EMA Cross 50 and 200 indicator, which, when turned on, allows us to check the position of maintaining a strong upward trend. It is worth observing this indicator, because in a situation where we start a correction, it can help us determine where such a correction will end.
Please pay attention to the CHOP index, which indicates that the collected energy is used for growth and there is still some left for possible continuation, on the RSI indicator we are again approaching the upper limit, but when we look at the STOCH indicator, we will immediately see a clearly overheated indicator, which may lead to a price recovery.

BTC/USDT 4H - Will BTC start a bigger correction?Hello everyone, let's take a look at the BTC to USDT chart on a 4-hour time frame. As you can see, the price is moving above the local uptrend line.
When we unfold the Fib Retracement grid, we will see a support zone from $38,625 to $37,822, while we still have strong support at $35,614.
However, before we start the above-mentioned correction, we can see that the price is above the last resistance and the next strong resistance is at $41,041.
Looking at the CHOP indicator, we see that most of the energy has been used, on the RSI indicator, similarly to the STOCH indicator, we are moving at the upper limit, which should translate into a stronger recovery in the coming days.

BNB/USDT 4H Interval ChartHello everyone, let's take a look at the BNB to USDT chart on a 4-hour time frame. As you can see, the price is struggling to return above the local uptrend line.
When we unfold the trend based fib extension grid, we can see that the decline was maintained through the support zone from $227 to $225, and further we can see a decline to the support area at $220.
Looking the other way, you can see that the price has been rejected by the resistance at $229.81, and then there is a resistance zone from $232 to $234.
Looking at the CHOP indicator, we see that there is a lot of energy for the upcoming move, on the RSI we are moving in a sideways trend, while the STOCH indicator indicates that the price may go up a little more.

BTC 1DInterval ChartHello everyone, I invite you to check the current situation on BTC in the USDT pair, taking into account the one-day interval. First, we will use blue lines to mark the local upward trend channel in which the BTC price moves at the upper limit of the channel. Then, using the yellow lines, it is worth defining the local channel, the exit from which can result in an increase of around $41,000.
Let's start by checking where the price should have support and here the significant level is 0.382FIb at the price of $36,030, and then there is a strong resistance zone from the level of $33,084 to the level of $31,521, if the price dropped to around this zone it would be a healthy recovery in line with with cyclicity.
In this situation, we will move on to checking the current place of resistance and here, after unfolding the Trend based fib extension grid, we have a visible strong resistance at the level of $44,411, but here we will unfold the grid again, thanks to which we can see that the place of previously determined resistance is in the strong resistance zone from $41,668 to $45,427, which the price may reach before the desired correction begins. However, it must first exit the current channel and overcome the resistance at $40,312.
Please pay attention to the CHOP index, which indicates that we have a lot of energy to make the next move, the RSI indicator shows that we have returned to the middle of the range, which makes it difficult to indicate the price direction, while the STOCH indicator shows that we are moving at the upper limit of the range, which may potentially result in a price recovery.

Will ETH break the resistance zone?Hello everyone, let's take a look at the ETH to USDT chart on a one hour time frame. As you can see, the price has moved higher from the local downtrend line.
In order to determine the resistance, we will unfold the Fib Retracement grid and we can see that the price has reached a very strong resistance zone from $2101 to $2133, which has temporarily rejected the increase.
Looking the other way, we have visible support at the level of $2,063, and then we have a strong support zone from $2,012 to $1,986.
The RSI indicator, similarly to the STOCH indicator, shows that the upper limit has been exceeded, which has slowed down the growth and may result in a price recovery.

BTC/USDT Short-Term 1H Hello everyone, let's take a look at the BTC to USDT chart for one hour. As you can see, the price remains on the upward trend line, and locally moves in the downward trend channel.
When we unfold the Trend Based Fib Extension grid, we see that the price remained at support at $37,439, while we still have a strong support zone from $37,148 to $36,781.
Looking the other way, we have visible resistance at $38,125, and then we have a very strong resistance zone from $38,335 to $38,546.
The RSI indicator shows that we are in recovery with room for price declines, while the STOCH indicator shows that the energy for increases is quickly running out, which may drag the price lower.

DOT/USDT 1HInterval ChartPlease see the chart of DOT in pair with USDT. First, we will use the blue lines to mark the downward trend channel, where the price is moving in the upper range, but in this channel, the yellow lines can be used to define the local upward trend channel.
Going further, we can move on to marking support areas when we start a larger correction. And here the first support is at the current price level of $5.23, then we have a support zone from $5.12 to $5.03, and then we have a strong support zone from $4.81 to $4.65.
Looking the other way, we see that the price has reached the resistance zone from $5.33 to $5.40, which it does not have the strength to break yet. However, if it manages to come out on top and out of the downtrend channel, it must overcome the zone from $5.50 to $5.63.
Please look at the RSI indicator, which indicates a rebound with room for the price to drop to a lower level, while if we look at the STOCH indicator, we will see that it is moving at the lower limit, which resulted in a slowdown in the correction and may result in a temporary price rebound.

BTC/USDT 1HInterval ChartHello everyone, I invite you to check the current situation on BTC in the USDT pair, taking into account the one-hour interval. First, we will use the blue lines to mark the local upward trend channel in which the BTC price is moving, but at this point we will mark the local downward trend line with the yellow line.
Going further, it is worth checking the behavior of the EMA Cross 10 and 30 indicator, and as we can see, the red line emacorss 10 is starting to turn around and it is worth watching at this point whether it will cross the green ema cross 30 line from above, which would confirm the transition to a local downward trend.
Now we can move on to marking support areas in case the current correction deepens. And here, first of all, we have a visible support zone from $37,816 to $37,612, but when the price breaks below, we can see a drop to the area of the second zone from $37,117 to $36,747.
Looking the other way, we can determine resistance locations in a similar way using the trend based fib extension tool. First, we will mark a strong resistance zone from $38,080 to $38,872, when it is overcome, the price will move towards the resistance at $38,872.
Please pay attention to the CHOP index which indicates that there is still a lot of energy for movement, on the RSI indicator we are in the process of recovery, but there is still room for a larger decline, while the STOCH indicator approached the lower limit, which resulted in a slowdown in the decline, however, we can still see greater decline.

ETH/USDT Short-Term 1HHello everyone, let's take a look at the BTC to USDT chart on a one hour time frame. As you can see, the price remains above the local downtrend line.
When we unfold the Fib Retracement grid, we will see support at $2,030, and then we will see the support zone from $2,005 to $1,986.
Looking the other way, there is a resistance zone from $2,059 to $2,076, and then we have a second, very strong zone from $2,101 to $2,132.
Looking at the CHOP indicator, we see that there is still energy for a move, the RSI indicator shows a rebound with room for a larger decline, and the STOCH indicator shows that we are exceeding the lower limit, which may result in a slowdown in the declines.

BTC/USDT Short-Term 15MHello everyone, let's take a look at the BTC to USDT chart on a 15-minute time frame. As you can see, the price dynamically moved up from the local downward trend line.
When we unfold the trend based fib extension grid, we will see that we have approached the important resistance level of $38,258, and when the price positively tests it, we can see an attempt to increase towards the resistance level of $39,213.
Looking to the other side, there is a resistance zone from $37,795 to $37,548, and then we have a strong zone from $36,861 to $36,506.
Looking at the CHOP indicator, we see that energy is running out in the short term, on RSI we have exceeded the upper limit, which has slowed down the growth and may result in a rebound, also the STOCH indicator is beyond the upper limit, which may have a similar effect as on RSI.

BTC/USDT Short-Term 1HInterval ChartHello everyone, I would like to invite you to review the current situation of BTC in the USDT pair, taking into account the one-hour interval. First, we will use blue lines to mark the local channel of the upward trend in which the BTC price rebounded from the upper limit, giving rise to a local downward trend.
Now we can move on to marking support areas in case the current correction deepens. And here, first of all, it is worth marking the support zone from $36,763 to $36,305, but when we fall below this zone, we may see a drop to the support level of $34,977.
At this point, it is worth looking at EMA Cross 10 and 30, where we can see a place of confirmation, a return to the local downtrend, where the red line EMA Cross 10 crosses the green EMA Cross 30 from above.
Looking the other way, we can determine resistance locations in a similar way using the trend based fib extension tool. First, we will mark a significant resistance level at $37,797, and then we need to define a strong resistance zone from $38,131 to $38,464
Please pay attention to the CHOP index, which indicates that there is still energy to make the next move, the RSI indicator shows that we have returned to the level where the price bounced several times, changing the upward trend, but in this situation it is clear that a small price movement gave a strong rebound on the STOCH index, which may negatively affect the price.

ETH/USDT 15M Short-TermHello everyone, let's take a look at the ETH to USDT chart on a 15 minute time frame. As you can see, the price broke below the local upward trend line.
After unfolding the Fib Retracement grid, we can see the current support at $2007, and then we have a strong support zone from $1973 to $1930.
Looking the other way, there is resistance at $2,050, then at $2,082, and then a strong resistance zone from $2,105 to $2,134.
Looking at the CHOP indicator, we see that there is a lot of energy for the move, and there is still room for the price to fall a little lower on the RSI.

1000PEPE 4h daily analysis1. Volume is showing POC
(point of control) and the price
is balancing in the range with strong
consolidation and indecision.
2. Currently we are in a range zone.
Taking swing low and swing high -
we are below 0.5 fib level, which
means we are in discounted area.
3. If price breaks POC and fib 0.5 and confirms above we can see a move to fib 1 price level. By this move
buy side liquidity wicks will be liquidated and potentially
we can see relatively equal highs.
4. If no big move you can look for long
at local fib swing at level of 0.618 where
4h imb either at 0.786 for stronger confirmation. In case support is broken, look for wicks to 1h imb below.
If price action is making strong move down, first stop might be 9089 level either below imb area with order block breaker of the move up.

BTC/USDT 1HInterval CHart Short-TermHello everyone, let's take a look at the BTC to USDT chart on a one hour time frame. As you can see, the price has fallen below the local uptrend line.
Let's start by determining the support line and after unfolding the Trend Based Fib Extension grid, you can see the support zone from $37,685 to $37,474, where the price is located, but further there may be a decline to around $36,866.
Looking the other way, there is resistance at $37,985, then there is a resistance zone from $38,176 to $38,362, and then resistance at $38,628.
Looking at the CHOP indicator, we can see that there is still some energy left for the move, the RSI indicator shows a rebound but there is room for the price to go a little lower, while the STOCH indicator is moving in the lower part, but the sharp rebound did not result in a price increase, which may result in a larger correction. .
