Dashcoin


Position QHF 16.01.2019After the candlestick fixation of the model "wedge" abroad, buy with a target of 0.0265.

DASH: Breakout Coming For BUY !!Buy after Successfully Breakout, if Breakout Fail then don't trade in DASH Coin.
Falling Wedge are Making which is trend reversal pattern.
if Breakout Successfully then we can see Price Move upto 80% Target which wedge Height.
You Can Also set Own Risk reward.
Let see what Will be Next Move.
Warning- I m Not a Financial Advisor this idea Only For Educational Purpose Only.
Thank You !!

DASH/USD On a hard leash of BTCHello guys.sharing my observations
DASH, seems best time to buy around this level.
Buy 1 dash for your child or mother, and hold for next 3-4 years.
Its very long hold. if he doesn't die - you can pay for your child’s college or buy a new house for your mother)
ITS NOT financial advice!

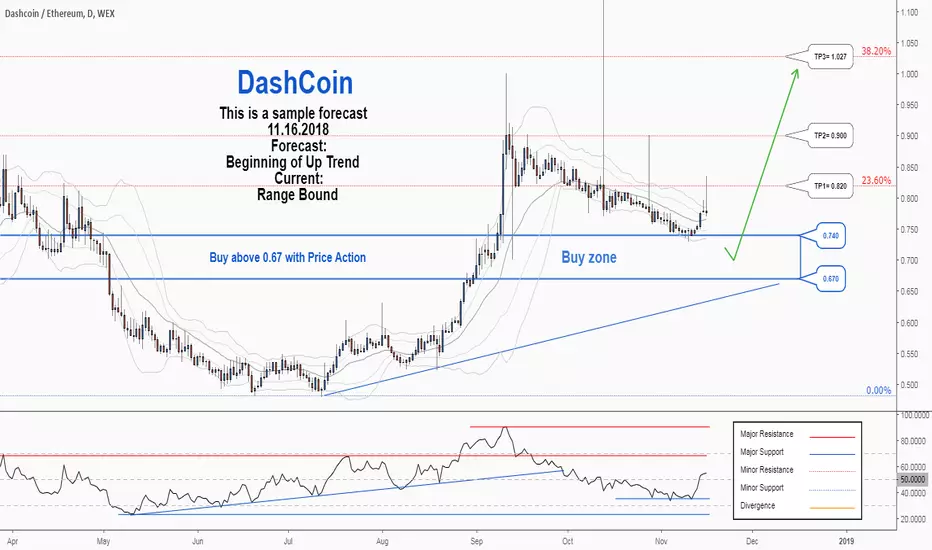
There is a possibility for the beginning of an uptrend in DSHETHTechnical analysis:
. DASHCOIN/ETHEREUM is in a range bound and the beginning of uptrend is expected.
. The price is above the 21-Day WEMA which acts as a dynamic support.
. The RSI is at 54.
Trading suggestion:
. There is a possibility of temporary retracement to suggested support zone (0.740 to 0.670). if so, traders can set orders based on Price Action and expect to reach short-term targets.
Beginning of entry zone (0.740)
Ending of entry zone (0.670)
Entry signal:
Signal to enter the market occurs when the price comes to " Buy zone " then forms one of the reversal patterns, whether " Bullish Engulfing ", " Hammer " or " Valley " in other words,
NO entry signal when the price comes to the zone BUT after any of the reversal patterns is formed in the zone.
To learn more about " Entry signal " and the special version of our " Price Action " strategy FOLLOW our lessons:
Take Profits:
TP1= @ 0.820
TP2= @ 0.900
TP3= @ 1.027
TP4= @ 1.195
TP5= @ 1.365
TP6= @ 1.605
TP7= @ 1.910
TP8= Free
Dash Moving inside of a Bearish ChannelDashcoin is moving very stable inside of a channel which has reached a support zone now. So either we break the support and make a big drop out of that channel, or the bulls ar ready to get in now and push the price towards that red resistance zone (previous high).
Trading it here is very risky, because i think it could be trapped inside of a range between 165 and 158. Upside break of the channel will probably mean a retest of the 165. Otherwise we can assume we just keep on dropping.
Bigger picture we can see higher lows but also lower highs. The low in August during the alt capitulation (crash of prices) shows a very good, high volume rally indicating the possibility of a long term low. A break of one of these 2 would trigger more movement into that direction. On the left we can see a small bullish wedge which triggered that small rally up a week ago. But that target has already been reached. So only thing to go on for now is this channel and the levels i have mentioned. A break of the channel would be a first step to either sides.
Please don't forget to like if you appreciate this :)

You would of sold ATH with this indicator on DASHBuy Green
Sell Red
//
it's mainly for swing trading, i use the 3 day / 15 day / monthly charts with it and it works perfectly,
//
it works good for stocks and cryptocurrency.
//
you will use heiken ashi chart style and turn on the EMA DOTS indicator.
once the indicator is on you will hide the heiken ashi so you only see the dots.
//
when a green dot -6.68% -7.44% -7.44% appears you buy, if a green dot -6.68% -7.44% -7.44% appears after that green dot -6.68% -7.44% -7.44% you hold your investment.
if a red dot appears you sell your position. easy as that.
//
the standard dots setting will be set to 10 - use this for any chart above 3 days
change the dots setting to 6 for 3day charts and below
//
shorter time frames will be choppy.
//
larger time frames will be smooth.
//
*Daytrading smaller timeframes is possible but not recommended.

DASH don't mind if i doTTM firing long. Increasing volume while threatening to break through a long term resistance trendline. Looks like he had slow, organic accumulation for a few weeks and perhaps this one is next.

DASH Coin Long Next Opportunity Upto 50% Move !!DASH on Support Level and Price doing restest we can see a spike upto 50% .
DASH Also making Bullish Channel Next Move will be aroung 3700.
Share Your Opinions in Comment Box
if You Satisfied With My Analysis My idea Then Dont Forgot To Like .
Warning- I m Not a Financial Advisor this idea Only For Educational Purpose Only.

DASH going directly to a support.We will probably see DASH back to 130.00$.
Downtrend is confirmed and it should find a support until the downtrend is broken.
Now everyone is waiting for December 12 and the confirmation of BAKKT.

DASH-ing to new all time high?DASH looks set to break out of a long term downtrend. Organic, slow growth is what I like. Will fire long out of this squeeze with a few more days of buy activity. With good volume she'll run...or "dash" (get it?).
Potential adam & eve, but the second formation is a bit too high.

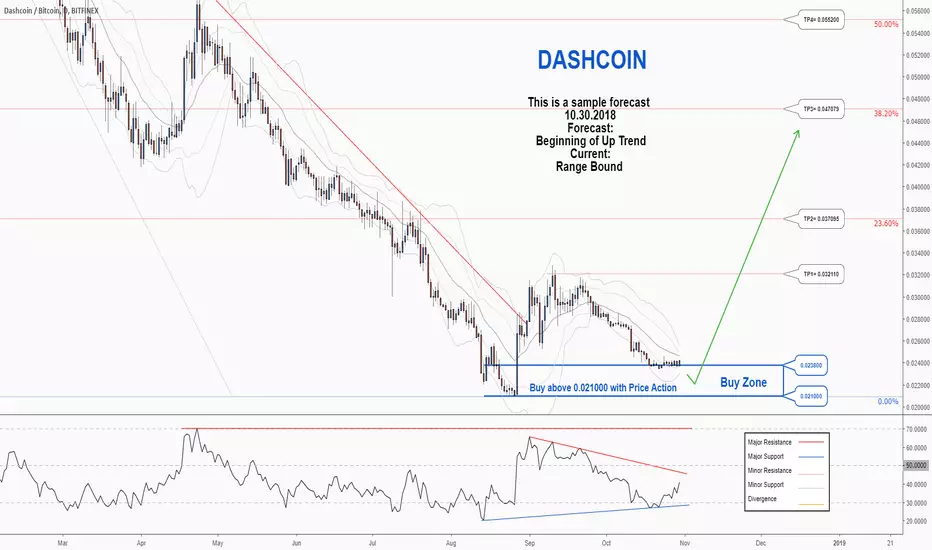
A trading opportunity to buy in DSHBTCTechnical analysis:
. DASHCOIN/BITCOIN is in a range bound and the beginning of uptrend is expected.
. The price is below the 21-Day WEMA which acts as a dynamic resistance.
. The RSI is at 40.
. The price downtrend in the daily chart is broken, so the probability of the resumption of an uptrend is increased.
Trading suggestion:
. There is a possibility of temporary retracement to suggested support zone (0.023800 to 0.021000). if so, traders can set orders based on Price Action and expect to reach short-term targets.
Beginning of entry zone (0.023800)
Ending of entry zone (0.021000)
Entry signal:
Signal to enter the market occurs when the price comes to "Buy zone" then forms one of the reversal patterns, whether "Bullish Engulfing" , "Hammer" or "Valley" in other words,
NO entry signal when the price comes to the zone BUT after any of the reversal patterns is formed in the zone.
To learn more about "Entry signal" and the special version of our "Price Action" strategy FOLLOW our lessons:
Take Profits:
TP1= @ 0.032110
TP2= @ 0.037095
TP3= @ 0.047079
TP4= @ 0.055200
TP5= @ 0.063260
TP6= @ 0.074765
TP7= @ 0.089450
TP8= Free

Dash is worth a watch - Loooow RSI, Stoch and MacdI think Dash is worth watching closely, the RSI is in oversold territory, stochastics are low and the macd looks like it may be finding a bottom soon. As you can see the RSI getting into the oversold area is no guarantee it will move up, its lingered down there for months in the past but its still worth setting some alerts to keep an eye on.
Last burst in price from this area seen a 50ish% move up. I haven't opened any positions yet but watching closely.
Short term
Be careful buying it because BTC is moving up. It doesn't always follow BTC's lead right away so if you're looking for quick gains, you could be playing with fire.
Long term
I think its a good buy, solid fundamentals but do your own DD.


DASHUSD UPDATEbreaking the line will be taking us down
and will probably test previous low.
sad
anyways like , comment and follow for more
ALSO SEE MY PREVIOUS DASH UPDATE

DASH Shows Us Incredible Strength!!Overall, DASH' has shown us as a pretty strong coin. The drops aren't so deep and the recoveries are faster and higher!
Currently, we have two triangles, one is bigger (blue trendlines ) and one is smaller (orange). Over the weekend, DASH' has made a breakout from the smaller triangle and it found a resistance from the round number at $200. At the moment it has started to make a throwback, the throwback is healthy if we find a support from the orange triangle upper trendline. The trendline is supported with several EMA's (50, 100, 200) which all starts to work as supports. Actually, at the moment, this is a pretty rear case that DASH' trades above the all important EMA's on the four-hour chart it is a very strong statement!
If the whole market starts to show us some positive signs then this retest area would be a perfect spot to invest into the DASH' but You have to watch what BTC' does, currently it 'sitting' on the "Descending Triangle" and we are ready to make a breakout from either direction so, the current market situation is a bit risky because we have mixed signs!
If the bounce happens then again we bounce upwards to the round number level and overall this is a pretty strong level to beat. Why? Because:
1. $200 round number works as a resistance
2. July low works as a resistance
3. The trendline since 20.07.2018 works as a resistance
So, a pretty tough level but if we manage to break upwards then the triangle pattern shows us that the next nearest target would be the next 'round number' $250 and definitely we reach there because DASH' has shown almost incredible strength compared to other top altcoins!
...and to give You a bearish view/confirmation, it is simple - at least a four-hour candle close below both triangles will guide us to the lower levels, so watch out if the price reaches into this area (around $175-$180)
Hopefully, those levels and this analysis helped You out a little bit to confirm Your own analysis!
Please, don't forget to hit the LIKE button to support us!
Best regards!

Daily Bullish Signal #DASH #DASHBTC (17-09)As DASH signal on my channnel, DASH has actioned so good
#DASH (DASH/BTC)
Buy : 292
Flash Sell : 300
Short Sell : 310
Long Sell : 320-330-340-350-360-380
Stop : 280
Follow me for more signals daily
PM me if you need help or learn to trade

DASH (DASH/USD) Looks Good Compared to Other ALTS!Currently, DASH' trades above the round number $200. After the massive market drop and after the tough weekend, DASH shows us still positive signs.
First of all the rare case is the EMA's, in the 4h chart we trade above the all important EMA's (50, 100, 200).
If we look at the monthly chart then there we could see that we got a bounce upwards from the 50 EMA which worked as a support and now if the market stays stable for a while then we could beat the blue trendline which is almost the last down-trendline on the DASH' chart!
If we break above the trendline then the next strong area would be around $230. There are the August high point and the area where the price started the last year's rally upwards!
Let's call this area the August high, this strong price level has worked historically very nicely and we can read this area to our key area. After the breakout above this price level could mean that DASH' have good times ahead, we make a new clean higher high and ready to climb upwards!
Currently, the price shows us (even in this tough market situations) very nice price action but if we want to confirm bearish price action then it would be a candle close below the short blue up-trendline. Then we trade above the EMA's, we broke the minor trendline and it made a new short-term lower-low, this means that it 'want's' to go and retest the lower prices around $125!
Hopefully, those level and this analysis helped You out a little bit to confirm Your own analysis!
Please, don't forget to hit the LIKE button to support us!
Check the full crypto-analysis u.today


Dash Targets
Welcome Back!
Taking a look at the weekly it looks like were finally finished correction.
Market structure points to a falling wedge breakout which would indicate a reversal, as well as, continuation.
These are my targets for the bounce im expecting.
They were calculated by Fibonacci which thus far, Dash has shown to follow quite accurately.
God Bless,
