Dashusd


#1 algo scoring Dash on Coincheckup is a steal near it's apexAt $111 usd with an ATH of $1,642 and < 9mil CS entering altcoin season, could ya really go wrong?


DASH/USD pivotal at 200-DMA support, breach will open up downsidDASH/USD is extending weakness for the 2nd straight week, bias strongly bearish.
Price action has approached strong support at 200-DMA, breach below will open up further downside for the pair.
Price action has slipped below 20W SMA and volatility is on the rise. MACD and ADX support further weakness.
That said, oscillators have approached oversold levels and price action is outside lower Bollinger band.
We could see some minor pullbacks in the pair. 5-DMA is immediate resistance at 129.20. Break above could see gains till 110-EMA at 139.50.
Breach below 200-DMA will see resumption of weakness.

Long DSH/USDAltcoins/BTC are crazy oversold. Bitcoin dominance is way too high considering all aspects.
Bitcoin finally looks like correcting and consolidating for a while - which would be perfectly healthy.
Altcoins/USD looks like ready for solid move.
This looks like the time to revive altcoin market. Most weak hands already sold on the way to the bottom.
Cheers!

DASH paints a bullish structureDespite the recent correction DASH is still holding strong above it's trendline (any large timeframe closes under would invalidate idea). Opening longs in this area, TP's shown on chart, setting SL under trendline.

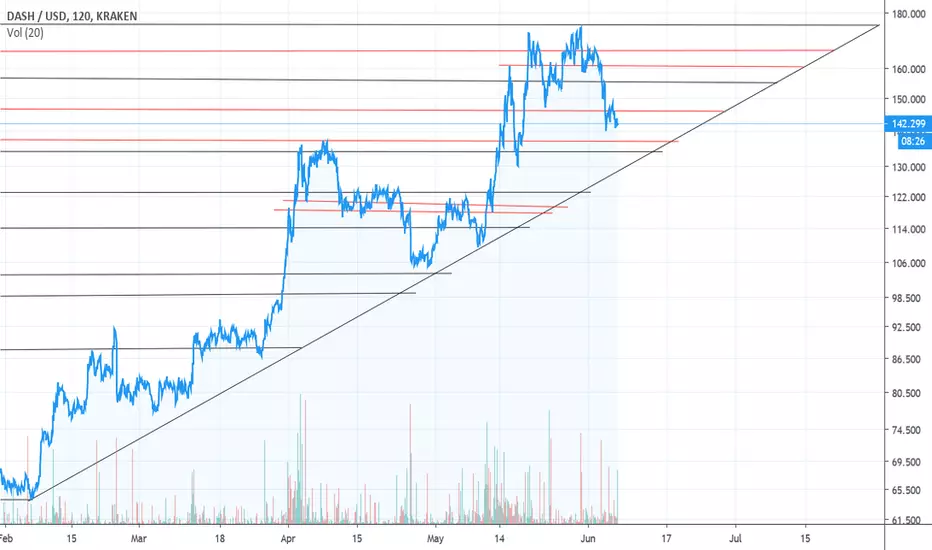
Dash is trading on major upward sloping trendline.Since Feb 6th 2019 this trendline has held, will this time be different?
Time will tell per usual.

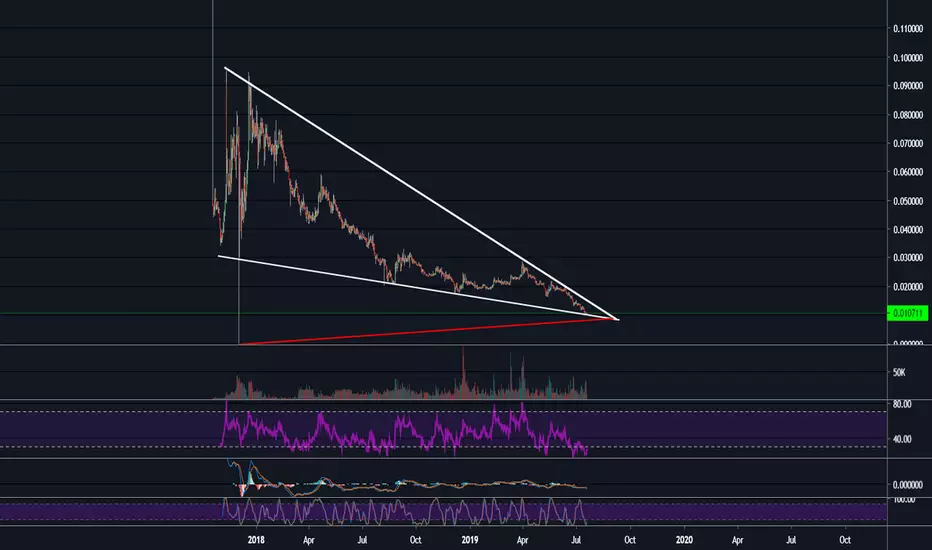
DASH - Wave I (Sub-Wave of the Fifth and Final Wave)Sub-Wave IV ( Symmetrical Triangle ) almost complete.
DASH should reach around $240-250 at the Peak of Wave I
Wave I is the first sub-wave of the Fifth and Final Wave that will see the price of DASH go between $1,400 - $2,500


Dash has a very high chance of increasingD1: Supported by increased EMA50 and trendline
D1 day candle also confirmed the price increase with a big body candle
RSI in region 43
Why is this area worth noting?
Keep in mind that Each time RSI is at 43, Dash often creates a bottom and increases strongly
=> Possibility of extremely high prices with DASH.
Hopefully this analysis helps you to choose the right time to buy and optimize the trading orders.
Have a nice day :)

DASH - WAVE V - A HypothesisDASH is currently in its Wave V.
With a Target between $1,400 and $5,000
Here is a Hypothesis of how this Fifth Wave could unfold.

DASH Trading Opportunity..As we see the Dash is trading in a great range and now we have opportunity to get around 10-15% gain with a great risk to reward .

Dash smaller forecast slower time frame!!Guys Dash made a small correction that will break over 200-250 usd area, if the move is very strong can go even more!

Dash - Eliot waves says it's time to growCauses of growth:
- common bull market
- vertical support level
- struck the level of $ 177
Goals when buying at $ 177:
1 goal - 225 $
2 goal - 300 $
Stop-loss is placed in the zone of $ 170
similar pattern

Dash breaks the key to boost it
Clearly DASH has exceeded the resistance of 172.34
After breaking the uptrend, it will be very strong
In addition, the price is also in the upward trend channel
Target: 100% fibonacci or upper channel

Dash, almost pattern completed!Guys, watch the trend line for the buys, I will update you if something new appear!!

Is Dash getting ready to make 2019 ATH's?It appears as though #Dash is about to break out of this rather massive Ascending Triangle & create new highs for 2019 in the near term.
Keep eyes on Neptune Dash, trading on the TSX.V under the ticker symbol Dash. The stock has seen decent correlation to Dash in 2019.
Also, they are now validators for the Cosmos network, which will see increased attention due to FB using similar or the same tech.
Time will tell per usual.

Dash is heading towards major upwards sloping support. Every time Dash has traded on this upwards sloping trendline since Feb 6th we've seen parabolic action.
It will be interesting to see if this recent bull trend in the Crypto space is going to continue.
Keep eyes on Neptune Dash on the TSX.V, they've been trading in correlation to Dash during this bull market.
Time will tell per usual.
Dash is looking like it's going to make a move in the near term.In my previous post I talked about Dash potentially making 2019 ATH's soon, and it appears as though that time is now.
I adjusted this chart slightly so the upward sloping trendline is up to date.
I see a Ascending Triangle that may play out in accordance with #BTC making new 2019 ATH's as well.
Neptune Dash is worth keeping your eyes on if you haven't been already. They've been seeing some nice correlation to Dash recently.
Time will tell per usual.

DASH - FULL & COMPLETE ELLIOTT WAVE ANALYSIS - LOGARITHMIC MODETarget seems between $5,000 to $20,000 for DASH

Dash - When to Buy? The daily timeframe tells us that the market is overbought. It should correct the previous upward movement and that we have solid signals confirming a downward movement.
Let's talk about these signals one by one.
First of all, the price diverged with RSI and MACD. We got a bearish divergence, which is a trend reversal signal. At least this signal should confirm the correction movement. Also, the market is forming a double top, which also provides a trend reversal signal. This pattern will be confirmed if the price can break the local swing low.
RSI drops from the overbought zone. It confirms the reversal from 175.00 resistance level and gives us a bearish signal. MACD lines and histogram support the further downward movement. So, we have two bearish signals from MACD. DMI is bullish and confirms trend market conditions. At the same time, ADX line moves sideways, and it tells us that buyers are not active now. Here is another signal confirming the correction movement.
As other top markets, Dash is also the overbought market, and it should be corrected. When can we see the downward movement? How deep will it be? It is just the question of time.
The good buying zone will be between SMA100 and the uptrend line.
If you like my work, please support it by clicking the LIKE button! Thank you!
