#DASH/USDT – Bullish Breakout Setup | 1H Chart Analys#DASH
The price is moving in a descending channel on the 1-hour timeframe. It has reached the lower boundary and is heading towards breaking above it, with a retest of the upper boundary expected.
We have a downtrend on the RSI indicator, which has reached near the lower boundary, and an upward rebound is expected.
There is a key support zone in green at the 48 price level. The price has bounced from this zone multiple times and is expected to bounce again.
We have a trend towards consolidation above the 100-period moving average, as we are moving close to it, which supports the upward movement.
Entry price: 49.50
First target: 51.60
Second target: 54
Third target: 56.81
Don't forget a simple principle: money management.
Place your stop-loss below the support zone in green.
For any questions, please leave a comment.
Thank you.
Dashusdlong

$DASH accumulation at last phase, decision time cameNASDAQ:DASH was accumulating after quick rally to 150, was making higher lows and resistance line is staying on the downside now. Personally expecting to rise over 71-73 level for further uprise retrecament. On the downside if we break below 50 level we will turn back where the story start.

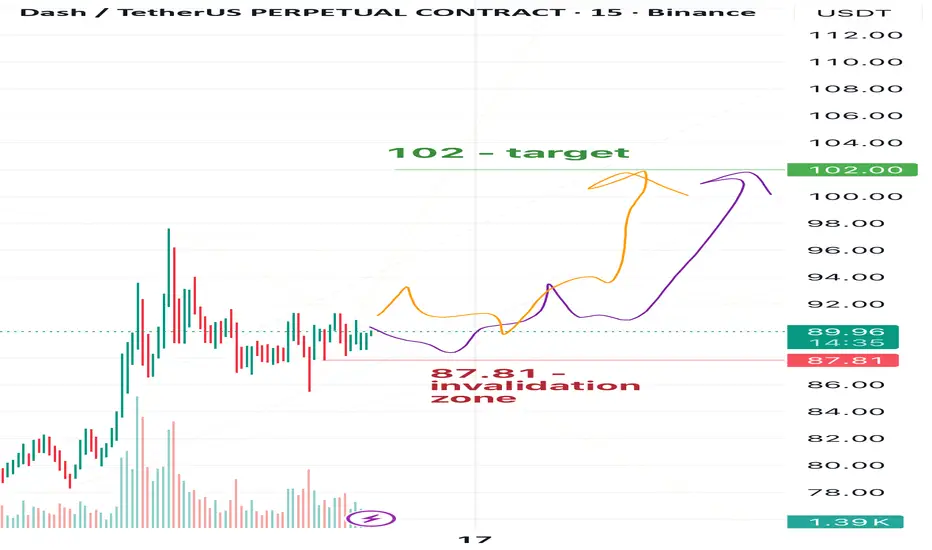
DASH: Building Momentum Toward 102📈In my view, Dash is currently forming an impulse. From the current levels, I’m expecting a move toward 102.
The invalidation level for this plan is 87.81.
🎯Target - 102
❌ Plan invalidation zone - 87.81
⚠️Disclaimer: This is not financial advice or a call to action — just my personal market view. Always make decisions based on your own risk management, and make sure to trade with stop-losses.
💬If you find this analysis helpful, feel free to leave a reaction, drop a comment, and follow so you don’t miss future updates and new Dash publications🚀
DASHUSDT 2D AnalysisDASH ~ 2D Analysis
#DASH Buy back gradually from this support block with short term target of at least 15%+ , Long term target $65

DASHUSDT 2D AnalysisDASH ~ 2D Analysis
#DASH If you still have a Conviction on this Coin, Maybe this support block you can consider to start buying back from here with a short -term target of at least 15%+.

DASHUSDT 1WDASH ~ 1W Analysis
#DASH Support that you might be able to consider to start buying back from here with a minimum target of 20%+.
Reason, This is the lowest support for now.

DASHUSDT 1WDASH ~ 1W
#DASH If you still have Conviction on this coin,. buy gradually on this support block with a target of at least 20%+

DASHUSD 1WDASH ~ 1W
#DASH This is the Bottom Support Block for $DASH.
We will consider making a small purchase here with a minimum target of 20%+.

DASH LONG BULLISH IDEASDash last bottom zone is $ 25 for me and I think I will buy from there if it falls. I think these two scenarios will develop, stay tuned. fibonacci levels are very important.

💡Don't miss the great buy opportunity in DASHUSD @DashpayTrading suggestion:
". There is a possibility of temporary retracement to the suggested support line (128.6).
. if so, traders can set orders based on Price Action and expect to reach short-term targets."
Technical analysis:
. DASHUSD is in a range bound, and the beginning of an uptrend is expected.
. The price is above the 21-Day WEMA, which acts as a dynamic support.
. The RSI is at 48.
Take Profits:
TP1= @ 134.3
TP2= @ 137.9
TP3= @ 143.7
TP4= @ 147.5
TP5= @ 155.4
SL= Break below S2
❤️ If you find this helpful and want more FREE forecasts in TradingView
. . . . . Please show your support back,
. . . . . . . . Hit the 👍 LIKE button,
. . . . . . . . . . Drop some feedback below in the comment!
❤️ Your support is very much 🙏 appreciated!❤️
💎 Want us to help you become a better Forex / Crypto trader?
Now, It's your turn!
Be sure to leave a comment; let us know how you see this opportunity and forecast.
Trade well, ❤️
ForecastCity English Support Team ❤️

DASHUSDT , Its ready to reach targetHello everybody
Its one the amazing privacy coin but its tired the holders and its do nothing but we think the compression of the price and the ... it happend and now its ready to go up and go to the moon step buy step
According to the chart you can see , the price in some months ago break the downward trend and now we are in upward trend , according to the chart , we were in correction of micro wave and now we supported the price from the support zone and the key level point and the first target is the end of the breakwave and ...
Guys entrance in position in lower time frame and check the chart in multi time , in 1h or 4h or 15 mins time frame then with nice R/r entrance in position and ENJOY YOUR PROFIT .
Good Luck
Abtin

DASHUSD ViewA trendline that can be drawn on the DASHUSD 1D chart
A clear pivot point
Very close to this point
Closer the better the buy potential

Dash doesnt have brakes!!Highest Probabilty for 5th is Orange
Green if Extended
Touching magneta Channel is where you look for exiting
Red is where all of this Invalid

DASHUSD LONGDASHUSD LONG
SL:180.247
TP: 213.013
RRR: 2.05
Price faked out of a 4hr trend and is coming off a respected line of support.

DASHUSDT 1D : We Have to buy it now , yes ?Let's buy Some #DASHUSDT ( DashCoin ) , Shall We ?? Great break of the resistance :)) do you have it or what ??
In order to buy, the SL (stop loss) and capital management must be observed.
All resistances and TPs (take profits) are marked on the chart.
(DYOR)

💡Don't miss the great buy opportunity in DASHUSD @DashpayMidterm forecast:
While the price is above the support 101.85, beginning of uptrend is expected.
We make sure when the resistance at 250.00 breaks.
If the support at 101.85 is broken, the short-term forecast -beginning of uptrend- will be invalid.
Technical analysis:
A trough is formed in daily chart at 109.35 on 07/19/2021, so more gains to resistance(s) 165.20, 178.70, 216. 05 and maximum to Major Resistance (250.00) is expected.
Price is above WEMA21, if price drops more, this line can act as dynamic support against more losses.
Relative strength index ( RSI ) is 56.
Take Profits:
TP1= @178.70
TP2= @216. 05
TP3= @250.00
TP4= @293. 40
TP5= @336.00
TP6= @399.65
TP7= @475.85
TP8= @542.90
❤️ If you find this helpful and want more FREE forecasts in TradingView
. . . . . Please show your support back,
. . . . . . . . Hit the 👍 LIKE button,
. . . . . . . . . . Drop some feedback below in the comment!
❤️ Your support is very much 🙏 appreciated!❤️
💎 Want us to help you become a better Forex / Crypto trader?
Now, It's your turn!
Be sure to leave a comment; let us know how you see this opportunity and forecast.
Trade well, ❤️
ForecastCity English Support Team ❤️

DASHUSDT Suppport BreakoutDASHUSDT(1H CHART) Technical Analysis Update
Support Breakout
DASHUSDT(1H CHART) currently trading at $126.50
Short Entry : $129.00 - $126.00
Stop loss: Above $133.00
Target 1: $119.00
Target 2: $115.00
Target 3: $108.00
Max Leverage: 3X
ALWAYS KEEP STOP LOSS...
Follow Our Tradingview Account for More Technical Analysis Updates, | Like, Share and Comment Your thoughts.

DASH - The Great Supply Shock! Pretty Self explanatory analysis.
ATH Retest soon for DASH which would be led by a massive supply shock as DASH keeps on getting accumulated and Locked up on Staking Platforms!
Wait and watch
The R/R is pretty favorable but if it were me, I'd be happy to have a naked long exposure.
..
..
This is (OBVIOUSLY) not a financial advice!


DASH Break Out? Will we DASH to the MOON?We can see that we are awaiting the break of the cloud on 4 hour, and RSI/CCI looking great at the lower level of cloud/support. I'm monitoring for a candle close ABOVE= BERAKOUT here.
I will be looking to enter break out trade to first target $120. Depending on your trading style, you could have also bought support line and already grabbed ~5% day trade (better with leverage and tight stops and need low fees).
Look further below as I discuss breakout entry in 15 min chart
When looking for entry on the breakout, we will monitor our Camarilla levels in the YELLOW HIGHLIGHT. A nice candle breakout above here and I will enter. Above and await retest bounce also works here for your entry
(STAY IN CONTROL-TRADE YOUR STYLE)
-If we break out- I will monitor at $120 level and likely implement a moving trailing stop loss strategy to allow for higher MOON BLAST breakout potential
-Stop loss is shown at $105 if you are not able to monitor charts and I will have on during overnight
-A 15 minute candle close back below entry level/Camarilla level while watching would allow for closing trade higher than STOP LOSS
-For straight take profits this is TP1 $120
-$140 is a good TP2 and can be looked at further back in higher time frame charts
**BE CAREFUL- OPINIONS NOT FINANCIAL ADVICE***
ENJOY :-)

Dash Flat with 3rd wave 87Fractal and Support
On last 62 day DASH atr on low is 6.09
10.88=6.09*1.788
24.36=6.09*4
November-December
TP1 - 74
Buy - 65
TP2 - 74
TP3 - 87
Daily:

DASH/USD LONG SET UP (HODL) DASH JOINS DEFITitle : DASH/USD BUY SIGNAL
Asset : Crypto
Type : Limit Order Or Market First Entry
Time Frame : WEEKLY
Entry Price 1 : $74.00
Entry Price 2 : $64.00
Stop Loss : $60.00 (140 PIPs)
TP 1: $88.00 (140 PIPs)
TP 2: $98.00 (240 PIPS)
TP3: $114.00 (400 PIPS)
Tp.4 $126.00 (520 0PIPS)
DASH bullish after 15% spike on back of masternode news
OCTOBER 20, 2020 BY BENSON TOTI
Dash has traded between a low of $73 and a high of $77 on the day
Dash has seen its price surge by more than 18% in the past 24 hours. The price is posting to the upside on the back of increased positivity among Dash users eyeing up a slice of the DeFi pie via yield farming in addition to rewards from staking.
DASH/USD price soared from lows of $64 to hit a 30-day high of $77, with the upside spurred by increased buying volume after Dash announced it was partnering StakeHound to make DASH accessible to DeFi users.
Also positive for Dash today is the news that the number of Masternodes on the network has hit a new record high of 5,002. Masternodes on the network use their token holdings as collateral to participate in governance. Operators of these servers earn regular payments in the form of Dash.
Dash price
The cryptocurrency is trading with a bullish bias as shown by the MACD on the 4-hour chart below. A look at the chart also shows that the 20 VWMA is moving away from the 20 SMA, suggesting the price jump was accompanied by increased upside volume.
After breaking above the 20-day, 50-day and 100-day moving averages, bulls have the energy to test resistances around $80. The MACD has strengthened and the MAs are providing healthy support around $70.
On the daily chart, bulls face slight resistance at the SMA200 and SMA100 lines, which are just under the 24-hour highs. Notably, the price has not experienced the aggressive rejection that characterised the last time we saw upside action.
On September 3, the price of Dash crashed 20% to fall from highs of $84, to touch $65. Bears showed the same aggressiveness near $73, with the subsequent action seeing bulls struggle to break above $70.
The hourly and 4-hour charts feature positive candles, although the momentum is squeezed by a decrease in buy volume. Bulls need to flip this to avoid giving sellers the initiative.
In this case, DASH/USD needs to close with a daily candle above the 100-day and 200-day simple moving averages. If bulls achieve this on higher buy volumes, the cryptocurrency will remain bullish.
A reversal in the short term will see bears aim at taking prices to the next major support level around $69.

DSHUSD: Possible Long (30.09.2020)On the 4 hours chart, the price found support at 65, where a divergence formed between the price and the RSI, indicating a temporary cessation of the downward movement. In addition, the price has broken the trend line.
An upward impulse is forming on H1, which heralds a possible continuation of the price growth, while the price found support at 67.
We recommend buying now, as well as when the RSI reaches the oversold level.
