BTC vs USD: Macro Liquidity vs TechnicalsBitcoin is at a hinge point.
Technical View: Weekly volume profile looks bearish, but if BTC closes above 119,465.52 the setup flips into an explosive breakout.
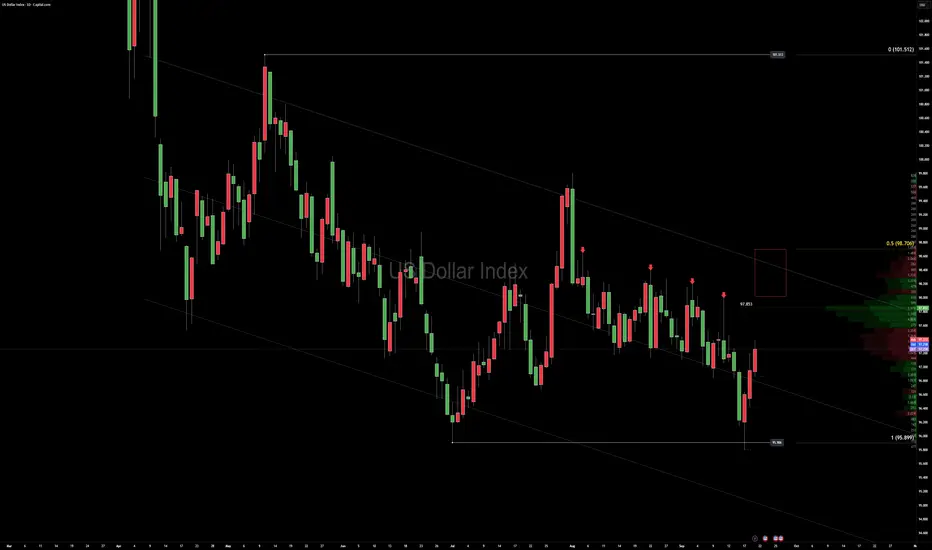
Macro View: The dollar is boxed (96.7–98.3) and fiscal stress + Fed cut bets are weighing on USD. Gold is at record highs on safe-haven demand. In this environment, macro liquidity can override technical ceilings.
That’s why I’ve stepped back to scalping until the macro picture stabilizes. The market is running on liquidity hunts, not clean structure.
🔑 Levels to Watch
BTC: Weekly close >119,465.52 → ignition higher
DXY: Breakout from 96.7–98.3 range decides cross-asset direction
When macros dominate, technicals bend. Patience and risk control matter more than chart perfection here.
Datatrading

BITCOIN USD UPDATE🚀 “117,998.17” — We Hit the Trigger
We pierced a massive rally threshold today (117,998.17) — a short squeeze or momentum flush — yet dollar and gold remain locked in ranges. That dissonance tells you this is a liquidity-game market, not a clean trend.
We’re still trading in what I’d call an overpriced arena — volatility amplified, direction masked. Price action will mislead until a big macro break comes.
The dollar remains boxed: Value Area High ~98.322 / Low ~96.747. Gold, meantime, is ripping higher under safe-haven flows, hitting record highs amid shutdown fears and rate cut bets.
Meanwhile, bitcoin is getting a bullish tailwind. Whale accumulation, institutional demand, and macro narratives favoring digital gold are pushing sentiment.
Macro catalysts (Fed, U.S. jobs, fiscal politics) could fuel either direction — but the setup is leaning toward asymmetric upside in risk assets if USD weakens.
LOOK OUT:
Liquidity hunts likely before clarity — expect fake-outs.
Dollar must break its box for cross-pairs and cryptos to trend.
Bitcoin is better aligned with the upside in this regime than dollar or gold.

US DOLLAR LIQUIDITY GAMES🇺🇸 US Dollar Range Politics – Liquidity Before Clarity
The dollar isn’t trending — it’s negotiating.
📊 Current Setup
U.S. Dollar Index (DXY): 98.322 → testing the value area high
Range Floor: 96.747 → the value area low
Structure: Bearish range, with liquidity being hunted before any true direction emerges.
🏛️ Macro Backdrop
Tariffs are reshaping global flows.
Fiscal gridlock + shutdown risk clouds investor confidence.
Inflation + Fed policy signals remain mixed.
Every headline feels like an amendment to a bill no one fully understands.
The result: the dollar drifts sideways in a liquidity-seeking phase. Traders should expect chop inside the box until a decisive catalyst (data, Fed action, or policy shift) provides clarity.
🌍 Cross Pair Impact
This stalemate spills into the majors:
EURUSD & GBPUSD → reflecting the same sideways ranges and fake-outs.
USDJPY → volatility compressed, waiting for dollar direction.
Crosses are trading in sympathy — liquidity hunts on both ends, with no clean trend until DXY escapes its range.
🧭 Takeaway: The dollar is boxed in by politics and policy. Patience rules here: trade the range, wait for the breakout.

EUR/USD Macro + Technical TargetLiquidity Run Complete
• EUR/USD swept last week’s key high and stalled.
• Dollar Index (DXY) just balanced on its weekly range—classic setup for a euro fade if USD strength resumes.
Macro Undercurrent
• U.S. Side: September core PCE inflation held at 2.8% y/y, keeping the Fed cautious about rate cuts. Futures now price only ~40 bps of easing into Q1.
• Eurozone Side: HICP inflation slowed to 2.4% and the ECB’s minutes flagged “weak growth, sticky wages.” Rate-cut odds for March keep rising.
Levels to Watch
• Resistance near 1.17540,todays High
• Southbound magnets: 1.16455 Lows

BTC USD PLAN
Bitcoin’s chart is one thing, but the bigger story is what’s driving the money behind it.
The Fed & Yields
The Federal Reserve is still the invisible hand. Every surprise in rates—whether a hotter inflation print or a sudden hint of deeper cuts—moves global risk appetite.
Lower real yields = cheaper capital = stronger bid for assets like BTC.
A hawkish turn does the opposite.
Institutional Flow
Big money isn’t just buying dips—it’s writing new rules.
Case in point: asset manager Strive is set to acquire about 5,800 BTC (≈ $675 million) through a corporate deal.
Moves like this tighten available supply and add a slow, steady demand base.
Bitcoin Technical View
This week’s candle is shaping up bearish, and Monday will tell us if today’s Sunday session finishes the job.
If the market doesn’t fill that daily gap, we’ll be watching Monday’s open closely.
Right now the daily range runs from 113,999 down to 108,644.
If the dollar pushes into higher liquidity zones, Bitcoin could feel the pressure and drift lower.
The plan is simple: wait for a clear shift on the smaller time frames before making any move and calculate risk from there.
Patience matters more than bravado—let the market come to you.
For now, the setup still looks constructive, but it only pays to act when the levels confirm.
Trade small, stay calm, and protect your capital first.

EUR/USD Mid-Range HoldThis week’s price action has done its job
Two recent highs were taken out after the massive bull-back we mapped.
First targets on the cross pairs are still open, so I’m standing by into the weekend—no new adds here.
Right now EUR/USD sits mid-range.
Bias remains lower if the dollar keeps its bid, but I’ll let next week’s closes confirm.
Fresh Brookings research this week tied the dollar’s safe-haven status directly to U.S. trade policy.
Even with the tariff drama earlier this year, current rates (≈17–18%) stay well below the 26% “tipping point,” leaving the us dollar reserve role intact.
Fed Chair Powell’s recent remark that U.S. equities are “fairly highly valued” only adds to the cautious tone that supports the dollar.
Next Week’s Data to Watch
Tue – U.S. Consumer Confidence
Wed – Eurozone CPI Flash
Thu – U.S. Q2 GDP Final
Fri – U.S. PCE Price Index & Personal Income/Spending
Stronger U.S. numbers here would reinforce the dollar’s strength and keep pressure on EUR/USD.

US DOLLAR LIQUIDITY GAMES MAPThe U.S. Dollar is testing traders resolve.
Price action keeps pressing higher, and a daily close above 97.394 would confirm a classic “fractal low” — the kind of structural pivot that lures late buyers before the real move unfolds.
3 Key Insights
Macro Calendar – Stay alert:
Thu – Final Q2 GDP, Weekly Jobless Claims, Durable Goods Orders.
Fri – Core PCE Price Index, Personal Income & Spending, University of Michigan Sentiment (final).
These are the week’s steering currents for USD flows.
A daily close above 97.394 is the key trigger to confirm a fresh leg higher.
• EUR/USD short bias remains valid while DXY stays bid, but expect intraday volatility around data releases.

US DOLLAR War Map stays simple right nowThe dollar’s been sliding for months, but we finally saw the range lows taken out after the FOMC spike, and that sets up the next move.
Here’s how I’m reading it:
Rotation lower is still the logical path unless politics or surprise news change the game.
On the DXY chart, I’m watching for a heavy-volume node to act as a target for a short-term pullback higher.
For cross-pairs, that means I’ll look for short setups while using the recent bullish dollar lows as day-to-day reference points.
Key level to watch: around 98.7, where heavy bearish order-flow has been building.
If the market keeps moving, it’s a straightforward trade plan: stay positive, take intraday signals, and let the bigger down-cycle play out.
Bitcoin OutlookWeekend trade after the FOMC has been a ghost town—low volume and choppy, un-tradable price action.
The dollar has been pinned inside a narrow hourly fractal range: high 116.211 / low 115.132.
I’ve been waiting for a sharp dollar pullback with a news driver, but the broader macro picture keeps price in oversold territory. Timing the next big move is anyone’s guess.
For now:
Higher-timeframe bias: still unpredictable.
Intraday (high-frequency) moves: perfectly tradable.
Crypto: don’t expect a clean breakout this weekend.
On the weekly map, there’s a bullish imbalance that still needs to be tapped.
Expect any breakout to have a dose of manipulation—trade carefully.

DXY vs. EURUSD – Pre-FOMC DivergenceDollar Index (DXY)
Yesterday’s move was fully absorbed inside a tight range, leaving the internal range high at 99.804 ahead of the Fed meeting.
Liquidity is at 98.00 stacked above that zone; market makers could easily run the stops toward the 98 handle before any larger downside move.
EURUSD
Meanwhile, EURUSD broke out of its major range, giving us a new weekly structure with a key reference low at 1.13914.
Cross-Market View
This sets up a classic divergence:
Dollar – trapped in a premium sell range, heavy liquidity overhead.
Euro – fresh upside structure.
For cross-pairs this often means sharp pullbacks or erratic price action as we approach the FOMC decision.
Trade Notes
Stay nimble and keep stops tight.

BTCUSD – Target Hit: $116,833.25Bitcoin has reached the upside objective I mapped from the prior point of structure, tagging $116,833.25 in today’s session.

#DATA (SPOT) BINANCE:DATAUSDT
#DATA/ USDT
Entry range (0.01500- 0.01600)
SL 4H close below 0.00.01498
T1 0.0180
T1 0.0198
_______________________________________________________
Golden Advices.
********************
* collect the coin slowly in the entry range.
* Please calculate your losses before the entry.
* Do not enter any trade you find it not suitable for you.
* No FOMO - No Rush , it is a long journey.

#DATA (SPOT) entry range( 0.03400- 0.0427) T.(0.0643) SL(0.0330)BINANCE:DATAUSDT
entry range ( 0.03400- 0.0427)
Target1 (0.0643)
2 Extra Targets(optional) in chart, if you like to continue in the trade with making stoploss very high.
SL .1D close below (0.0330)
1:2 Trade
**** #Manta ,#OMNI, #DYM, #AI, #IO, #XAI , #ACE #NFP #RAD #WLD #ORDI #BLUR #SUI #Voxel #AEVO #VITE #APE #RDNT #FLUX #NMR #VANRY #TRB #HBAR #DGB #XEC #ERN #ALT #IO #ACA #HIVE #ASTR #ARDR #PIXEL #LTO #AERGO #SCRT #ATA #HOOK #FLOW #KSM #HFT #MINA #DATA****

Pound Weakness After U.K. InflationAs a young trader (21 years old), I see my trading style as more of an art than a science. I don't understand patterns, and I don't use technical analysis. I am a macro trader. I take information from various sources (WSJ, Twitter, Investing.com, Trading Economics, ect.), and my instincts kick in. I understand where assets should be moving on data releases.
The U.K. pound has been on a monster rally in the past month and change. Expectations for the U.S. Federal Reserve to pause rates, with some saying cuts later into the year, has simmered the red hot U.S. dollar. The Bank of England on the other hand, is expected to continue hiking rates in the midst of the highest inflation in recent memory. When yields rise on the U.K. Gilt, that makes their debt more attractive to foreign investors, making their currency appreciate against the greenback.
This past Wednesday morning, at 1:00AM (CST), U.K. inflation came in hotter than consensus estimates (8.7% actual versus 8.2% consensus), as did core inflation (6.8% actual versus 6.2% consensus). I would have expected the pound to appreciate against other currencies as their currency becomes more valuable as Gilt yields rise. The opposite happened, FXB has now fallen two consecutive days. I was building up my short position against the pound, but we must remember U.S. data sets can affect currencies across the globe. I exited my FXB position before the open today with the intention of hopping back in after said release.
Tomorrow (5/26), before the bell, we have U.K. retail sales MoM, U.S. durable goods orders MoM, core PCE prices MoM, personal spending MoM, and personal income MoM. There's no telling where any of this data will land us, especially the U.S. data, and that is why I closed out of my position today.
As far as I can see, we have no upcoming U.K data that would affect the pound. That is why I'm confident in this trade. The market will have time to digest what has transpired, and my hope is that it will come to the same conclusion that I have.
I have full intentions of getting back into my trade after this data is priced back into the stock. The most important lesson I've learned in my very young trading career is protecting your capital and letting the trades come to you, don't look for them, they will find you ;)
fyi - this is my first writing and any feedback is appreciated! Thanks

Axis Bank on a strong Trajectory !Axis bank seems to be on good strong trajectory after it has recently filled up the downfall in lesser than the duration of the fall. The recovery not only showed the strength but also builds confidence that the stocks fails to move down even the big red candle with high volume. Stock was able to lift the price beyond it and now is trading in range bound fashion with rising triangle type patter on daily. However the important thing is that we see good volume with price rise and POC being a crucial level which the price tested and respected. Stay tuned to witness the spurt.
