DAX breaks a recent high, next target 13600! DAX manages to break through the 13305 high on decent volume after holding the support structure we had mapped out at 12910. The fact that it broke into 13400 and retested the broken high at 13290 means that there could be immediate support here for an all-time high move or a slight retrace into 13050 before we see the all-time high again. For the move to come out into the all-time high we need to see a new higher-low form so that means a move below 12910 ultimately would disqualify this long.
Disclaimer: This idea is for educational purposes only, this does not constitute as investment or trading advice. TRADEPRO academy is not responsible for any market activity.
Dax30long

DAX30 CFD to reach new All-Time Highs for Christmas?After last Thursday's developments in the US-Chinese trade deal, the UK's general election, and the Fed's liquidity announcement, the outlook for the DAX30 CFD is very bright as we start the trading week.
The main driver for the bullish action, and the ensuing break above 13,180/200 points resulting in new yearly highs, was certainly the "deal" between the US and China where both sides are said to have agreed on a reduction on existing tariffs, and a delay in those planned to go into effect on December 15.
In addition to this, there was the landslide victory of UK prime minister Johnson's Tories in the General election which made a near-term Brexit deal likely and diminished uncertainties among market participants, as well as the Fed's announcement that it will flood markets with $500 Billion in liquidity to avoid a year-end repo crisis (and will thus extend the Fed balance sheet to new record highs by mid-January).
That said, we project a bullish DAX30 CFD for the yearly close, with a high likelihood of new all-time highs and thus a push to and above 13,600 points in the coming days.
A short-term correction finds a potential Long trigger in the region around 13,280/300 points and a littler deeper around 13,180/200 points, with the mode staying bullish on an Hourly time-frame above 13,080/100 points.
Ready to start trading the live markets? Then open a free account with Admiral Markets - 8,000+ instruments to choose from, some of the market's tightest typical spreads, and the world's #1 multi-asset trading platform. www.admiralmarkets.com
Disclaimer: CFDs are complex instruments and come with a high risk of losing money rapidly due to leverage. 76% of retail investor accounts lose money when trading CFDs with this provider. You should consider whether you understand how CFDs work and whether you can afford to take the high risk of losing your money.

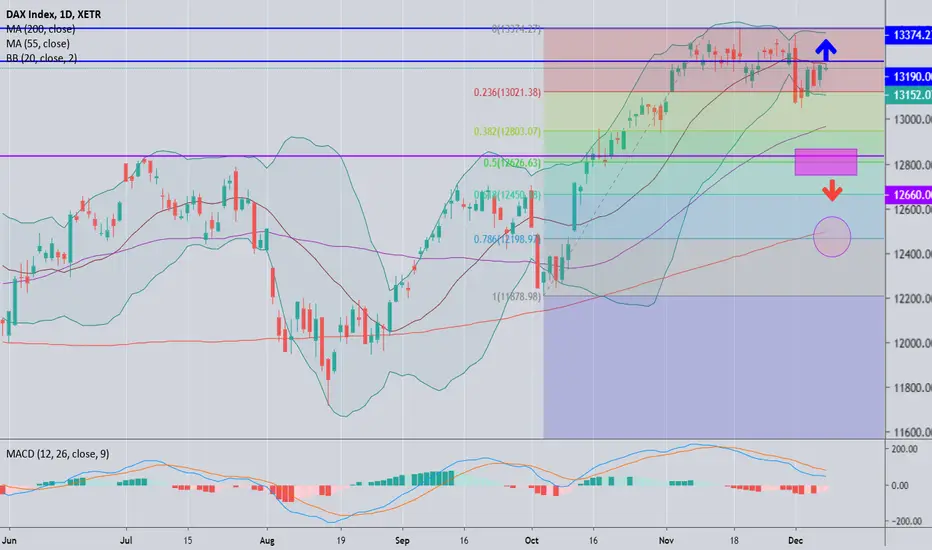
DAX30 Still Looks Neutral in Short-termThe DAX30 index currently faces a challenging resistance area at 13,190. The index is holding the rebound from the 23.6% Fibonacci retracement of the October 4 low (13,879) to November 19 high (13,338.25) rally at 12,970. The 55-day moving average has risen to 12,827. Yet the positive slope in the 55-day SMA that increases distance above the 200-day EMA suggests that the bullish trend is intact and an eventual reversal could come later rather than sooner.
On upside, if the price break above upper border of Bollinger Bands at 13,350, our first target is Nov. high 13,374.27. A clear break of which could see the bulls to retest the all-time high level of 13,597 registered in late January 2018.
A closing price below Tuesday’s low of 12,927 and the 55-day SMA could encourage more selling pressure. However, only a significant fall below 12,660 would put the current uptrend under speculation, shifting the medium-term picture from positive to neutral first. There is located also 50% Fibo level on the above-mentioned rally.
DAX Intraday LongThis is just a quick long with very low risk.
I also have an aggressive stop at 12983 but i want to be more conservative

DAX hits first level of support and rallies, new all-time high?The DAX managed to pull back, as anticipated through rotations at the top of a structure area it failed to break above into its all-time high and into a new high after several attempts and the downside was expected. We had 2 levels identified as potential targets, the first being the cluster of support that was mapped out based on where the price started its rally which was between 12930 and 12965 which happened to be the inflection point at which the DAX recent bounced off.
The second target area for the downside on the retrace was 12615 which was a Fib level that we were watching, but the rejection at the first level suggests that this move lower was just enough to get some new buyers interested. Now, what is the move higher? Where is the upside target? With the Christmas rally ahead we may see new highs across the board in equities. From here we really need to break through the 13305 level that is holding resistance and get into the previous all-time high.
If price breaks above 13305 into 13320 then we will anticipate the move into the high at 13600 or so. For that, some good European trade talks will help out a lot.
Disclaimer: This idea is for educational purposes only, this does not constitute as trading or investment advice. TRADEPRO Academy is not responsible for any market activity.

Elevated volatility in the DAX30 CFD into the start of the week?While the last week of trading primarily saw subdued volatility in the DAX30 CFD, this will likely change as we start this trading week.
Technically, the German index continues to trade sideways between 13,100 and 13,300 points. Due to its proximity to the 13,300 region, it is generally more likely to get to see a break on the upside, with a first potential target being seen around 13,370 / 13,400 points.
A break higher could be initiated by the upcoming US ISM manufacturing figures, which are due at 3 pm GMT. A better-than-expected dataset could initially dampen recession concerns for the world's largest economy. A lower-than-expected data set could, on the other hand, fuel speculation that a more dovish approach by the Fed at the policy meeting on December 11 would be more likely.
Or to put it another way: the DAX could be off to a win-win in the start of the week.
On the flip side, however, there is also the danger of a renewed escalation in the US-Chinese trade conflict, after US President Trump signed a Legislation Bill on developments in Hong Kong during the night from last Wednesday to Thursday.
The resulting support for Hong Kong and clear US position against China could spark a response from the Chinese that China could for the time being fail the current Phase 1 trade talks and put the DAX under pressure.
This would then put the region around 13,100 into focus and below the area around 13,040 / 050 points at the center of the action.
Ready to start trading the live markets? Then open a free account with Admiral Markets - 8,000+ instruments to choose from, some of the market's tightest typical spreads, and the world's #1 multi-asset trading platform. www.admiralmarkets.com
Disclaimer: CFDs are complex instruments and come with a high risk of losing money rapidly due to leverage. 76% of retail investor accounts lose money when trading CFDs with this provider. You should consider whether you understand how CFDs work and whether you can afford to take the high risk of losing your money.

Dax - Trade setup- lookout buying opportunities XETR:DAX has a good run up recently and has formed an uptrend on the daily charts.
While the chart is self explanatory, I would like to share some thoughts
If you are long the DAX, stay invested. When it comes to fresh entry, I may want to look at a retracement and see higher low formation, and then buy!
Trust this helps
If you like what you see, then please share a thumbs up and a comment in the section below
Cheers

Will a break at 13,300 push the DAX30 CFD up to all-time highs?After bullish performance over the last week of trading, there seems to be a higher chance of a slow start into the new week.
Due to the “Veterans Day” bank holiday in the US, the US Fixed Income Markets will not be open for regular trading hours, indicating that trading volume will be lower than on average. That’s noteworthy because of the fact that yields have been a principal driver of price action in the last days, and with no impulses to be expected from this end, volatility should stay low.
From a technical perspective, the picture in the DAX30 CFD on H1 stays bullish and the Long sequence stays intact as long as the German index trades above 13,100 points. Only a break lower would darken the technical picture from a short-term perspective, activating the region around 12,970/13,000 points as a first target.
On the upside, the region around 13,300 points stays in focus: a break higher could initiate a Short-squeeze to around 13,500 points in the days to come. One main driver here could be the small expiration in DAX options next Friday. Data from EUREX shows an elevated Open Interest of Short Calls around 13,300 points and then around 13,500 points, meaning that a break above 13,300 could trigger a wave of market participants being in a need to hedge their Short exposure by buying the DAX.
Ready to start trading the live markets? Then open a free account with Admiral Markets - 8,000+ instruments to choose from, some of the market's tightest typical spreads, and the world's #1 multi-asset trading platform. admiralmarkets.com/start-trading/
Disclaimer: CFDs are complex instruments and come with a high risk of losing money rapidly due to leverage. 76% of retail investor accounts lose money when trading CFDs with this provider. You should consider whether you understand how CFDs work and whether you can afford to take the high risk of losing your money.

DAX LONG - Target 13500DAX - Watch for close above 13150 - TG 13500, which is also 1.618 daily Extension

DAX Long Target reached Hello to all watching my charts.
As a lot of yours wanted to get from me information about Risk/Reward trades
i will try it here in Dax as sample.
New Long has been the Mode after the break of last resistance
at 12914.
Target has been the old high 12975 which has been reachin during
the trading day.
RRR = 2.55
Good trades.
if you want to support my work, please like them
My analyes here are all NOT a request to buy or sell
seomething. Allways do you own research.
Renkotrade

DAX Short as Forecasted Break 12885Hello to all watching my charts.
Dax is since the decision level break and
break of
12885 short
I have shown you the levels again in the chart.
The short run has now increased...
Good trades
If you want to support my work , please be so kind and like them
-
My posts are not and advice to buy or sell something
always do your own research
-
Renkotrade
----------

Dax DEU30 Long Here are the Marks to Watch for tomorrowMajor Support (BLACK) 12900
Lower Level Support (BLUE) 12885
Major Resistance (RED) 12975
Good trades
If you want to support my work , please be so kind and like them
-
My posts are not and advice to buy or sell something
always do your own research
-
Renkotrade

DEU30 DAX Long in My TrendchannelHello to all watching my charts
Dax DEU 30 climbs step by step and our by hour
to higher Levels.
Fine that my forcast has been 100% correct..
Hope you are in.
At the moment for today Support Level to wacth is
12840 for further long-
Good trades
If you want to support my work , please like them
-
My posts are not and advice to buy or sell something
always do your own research
-
Renkotrade

DAX30 CFD bulls are likely in charge of the action till the FEDAs expected, the ECB's key interest rate decision last Thursday didn't provide any significant volatility in the DAX30 CFD. And, with the economic calendar being thin today, it's difficult to see significant impulses on either side.
Currently, the German index has stabilised between 12,800 and 12,900 points, but this is on an Hourly time-frame above 12,600 points with a clear bullish tendency.
In fact, given the latest news around the massive liquidity injections from the FED, conducting nearly 65 billion USD in overnight repurchase agreements and another 35 billion USD in repo operation last Tuesday alone, it's difficult to see Equities come under serious pressure in the near-term, especially with the FED rate decision taking place next Wednesday.
The reason for that: since 1980 research shows a clear bullish tendency "Pre-FOMC", not only in US-equities, but also in the DAX30 CFD. That's especially true with a flattening US-yield curve and volatility being solid. Here, on average, nearly 80% of all profits in the S&P 500 were made within eight days leading up to the interest rate decision.
With that in mind, and the DAX30 CFD trading above 12,800 points, another push up to last week's and current yearly highs around 12,920 has a higher probability than a push lower and test of the region around 12,600 points.
Ready to start trading the live markets? Then open a free account with Admiral Markets - 8,000+ instruments to choose from, some of the market's tightest typical spreads, and the world's #1 multi-asset trading platform. admiralmarkets.com/start-trading/
Disclaimer: CFDs are complex instruments and come with a high risk of losing money rapidly due to leverage. 84% of retail investor accounts lose money when trading CFDs with this provider. You should consider whether you understand how CFDs work and whether you can afford to take the high risk of losing your money.

DAX DEU30 LONG exact like Forecasted in the ChannelDAX is in Long Mode since 15.10. and runns up
in my channelsystem like it should.
The shorttime forecast is exact in the middle of
the longtime forecast channel, so move is straight
gone up in same manner since 15.10.
Please have an eye on the lower BLUE marked trendline
Short only by fall below that line at 12730
Stopp Long if the blue trendline is broken !
Good trades
If you want to support my work please like them...
and if you want to know more about my trading style
please send my a boardmail.
I am just started yesterday a blog, the design
must be finished , but the infos you are ableo to
find here.
www.patreon.com
Good trades
If you want to support my work please like them...
and if you want to know more about my trading style
please send my a boardmail.
Renkotrade
Renkotrade

DAX 2 possibilitiesred line : vwap pull back trade to go long
green line : breakthrou trade with small SL to go long


DAX DEU30 1 HR Long End of 20.10.2019Hello to all watching my charts,
I am back here with a new analysis of german Dax Index
on a 1 HR view.
We have a very nice long setup since 10.10. and i do hope
everybody have seen that.
Thats in my midtime channel (blue) nice to see.
Of course such a strong rally cant last forever and has to be paused
sometimes.
Since yesterday we have such a phase
but if you check my shorttime channel (turkis green)
it still long.
So all which cried "short" at 18.10. are now faked out.
Please remember some of my rules:
Dont trade what you want to come next
only trade what you do see in the trading channels.
Good trades to all.
Renkotrade

A simple and optimistic trend idea on DAXHey guys! First time publishing an idea, please bear with me. :) I don't know if this idea is kind of obvious or blatantly ignorant, but I'm just doing this to learn. I'm open to any criticism.
So this idea is basically based on the longer term channel (thick purple lines) VS the shorter term wedge (thin purble lines). I believe there's a high probability that the price will not move outside the long term channel. Therefore, it should continue in upwards direction once it bounces off the line.
The short term wedge isn't reliable by any means in my opinion. If on Monday 21st the wedge breaks immediately, I believe it will follow scenario A: The price will move towards the blue dash resistance level into a retracement until it bounces off high term channel line (Entry Point 2) and shoots towards year high (green dashed line) and perhaps beyond. Scenario B would occur if wedge meets channel border, in which I believe it will still break and creates Entry Point 1.
I believe Entry Point 2, whether scenario A or B occurs, offers a safer approach since it would have been confirmed that the long term channel theory is holding. Furthermore, it's a bit farther away from the support level (red line). If I were to swing trade this, I would set TP at year high (green dashed line) and SL at the red line support.
If I were to approach Entry Point 1 I would still use the red support line as SL. There's less wiggle room here but I believe that's more appropriate considering we wouldn't have confirmation on the long term channel theory, therefore it has a lower probability to succeed.

Elliott Wave View: Bullish Sequence in DAXDAX shows Elliott Wave bullish sequence from August 15, 2019 low (11266.48) favoring more upside. The rally from 11266.48 to 12497.28 ended wave (1) as a 5 waves impulse Elliott Wave structure. On the chart below, we can see wave 3 of (1) ended at 12471.83, wave 4 of (1) ended at 12141.82, and wave 5 of (1) ended at 12497.28. Index then pullback in wave (2) and ended the correction at 11877.32.
Index has resumed higher and broken above wave (1) at 12497.28, signalling the next move higher has started. Up from 11877.32, wave ((i)) ended at 12097.43 and wave ((ii)) ended at 11933.02. Expect Index to see a few more highs before ending wave 1 of (3) a 5 waves from 11877.32. Index should then pullback in wave 2 to correct cycle from October 4 low (11877.32) in 3, 7, or 11 swing before the rally resumes. We don't like selling the Index.

DE30EUR Possible reversal/retracement of recent bearish dive.After the steep bearish movement of the DAX it bounced on MA200 on Daily and created a bullish pinbar. On the 4h you can see that it is at historical resistance (from early september). it seems to be pushing up into the resistance and the RSI suggest bullish momentum. A break above 1200 could mean a bullish move up to MA200 on 4h or even up to historical resistance at approximately 12150-12170.

Bounce continues, but how farWe saw a nice bounce from lower resistance on $DAX on Friday. I believe we could be in for a trend day on Monday taking us to 12.155, if we manage to break through that area we could see another test of the top of the trend channel, but I find that unlikely. I might try a long Monday morning depending on how it opens, but will definitely look an opportunity to short once we see development at 12.155.

