GOOG: AlphaBet A Defining Day Ahead AlphaBet GOOG Defining Day Ahead
This turned a little tricky on Friday. A mean/invisible gap on the 15 minute chart and not even there on the 60 minute completely arrested the decline fully 8 bucks above the 1180.85 target line.
The stop was then lowered to 1201 to protect what was left of the profit from any shorts from the 1206.28 line - the original gap line.
The mofo then rallied right back up to kiss the gap line again and left a little spike at the line before falling back again.
Looking at the chart in isolation this still looks bearish and it should fall away to make a proper test of the 1180.85 line.
But it's going to move on news and right now in very near term hopes of a peace deal with China on trade could help GOOG gap up on the open and to jump the 1206.28 line in one bound.
If so it has to hold up from there on any retest.
Only then will Goog (and markets too) be out of clear and present danger.
That looks best case scenario from here...
As the chart currently stands Goog will remain vulnerable whilst trapped below the 1206.28 gap line.
Whilst unable to break and hold above here then markets should also find difficulty in advancing further from this point.
It's still weak whilst trapped inside the channel shown on the chart.
Maybe it will open just around the gap line and maybe twitch either side for a little while - which way it breaks from there will be most likely decide the direction of major markets too.
But on an overall view, this ended last weak looking weak still. Its only way out from here is to gap up and hold above that key gap line on retests.
Right now GOOG looks like it will continue to be the bellweather for markets in general, the canary in the mine.
Hopefully it will help to determine direction for Nasdaq and SandP and other majors and be as helpful as a confirming signal as it has tended to be in the past.
For fastest updates on stocks and major markets please see link at top-left of main page.
DAY

BTC may become bullish again#BTC
Yesterday, immediately after breaking through the bottom of the triangle, we were warned about the likelihood of a decline. At the moment the market has returned back (above 8100) and the current level again looks good support, since it does not allow the price to go lower. If, on a 1-day scale, a new candle opens above 8100, the probability of a decline will be minimal and you can count on a further positive scenario, perhaps even open long margin transactions.

SPY half day dragEvery now and then, 'they'll pull a surprise half day rally.
It's design to complete some orderbooks when no one is looking. Not the only reason of course,but it helps when volume is low to help market makers shift the market to their benefit easier.
That said,I'm not going to be going too frenzied after the 273 attempt tomorrow,price now 271.84.
I've seen the machines go bonkers into the half day close decently.


2pm_3pm_4pmHi guys,
from another chart on daily I posted my idea to go long untill to touch the line @1.42
On this other strategy we will hit a lower TP, but let's see if it's worth!
Enjoy your wallet!
Tari.

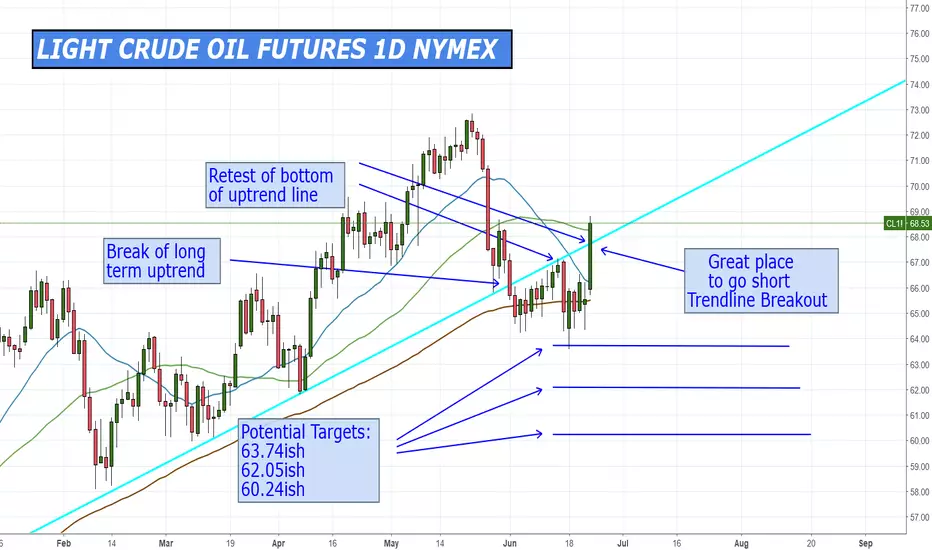
Crude is retesting the broken up trend lineCrude broke a year long up trend line earlier this month. It has now tested the bottom of the up trend line several times and looks ripe for drop.
Take your loss on a daily candle close back above the trend line .
Target the three indicated levels. You can even hold a portion of the trade for the June 2017 low.
Follow your stops as the trade moves in your direction.
Be sure to size your trade according to your risk parameters. NEVER BET THE FARM!
No trade is guaranteed 100% to work. You NEVER know what the market will do.
Your first job is to protect your trading account.
Time to short!Hi guys,
it seems it's selling time. Price is in overbought, at the resistence of the channel. This channel has been already tested many times, so everything I see tells me to go short.
Target area is around @102.00 Nice move with a very tight SL @111.50 more or less.
Enjoy your wallet!
Tari.

RTRX new highslooks like RTRX is holding onto new highs! Another day another dollar! gains are being made on a daily!!! basis

EURUSD DAY DRAGON BULLISH REVERSAL PATTERNThis trade was brought to our attention by Tex3rdgen from the strike-trader-signals-chatroom. Here is his comments "I'm seeing a very definite Dragon Pattern on EURUSD daily chart. For those who haven't heard of it, it is a reversal pattern, it looks left with head at the top of a typical long neck with front feet lower than back feet with a hump in between. Confirmation comes at the break of the down TL drawn from back of head to back of hump. May confirm on Monday."
Thanks Tex

NZDUSD wave signalsI don't normally trade the NZDUSD but the chart looks very clean we the Pro-Trading System on it. Started to nibble on the short side today. I know the Dollar is playing out a 4th wave retracement and so we should be seeing the NZDUSD pushing higher but, we are I think this could be a good area to enter. Stop placement wouldn't be so far away and the reward would be down at wave 5. So good risk reward.
I don't know how to put videos on here because I wanted to show you why and how I took 100 points out of oil this morning.

Watch for the live CAT bounceThis is a short term trade.
to specify, short term meaning no more than 2 hour trade(Perhaps max) I'm pretty sure we break above the close Tuesdays 152.95. The quicker you are in the morning, the better. Hopefully we get a quick bounce off of 152.70s to launch into 153.50s.
And the final reminder, this trade is no longer than 2 hours. At the very least, trail a stop loss just in case it runs beyond 153.70s.
Lets see how I do on the CAT call(s)

POSSIBLE FUTURE FOR AUGJPY FIRST OF WEEKHere are some signs of possible bullish bias for next week for the AUDJPY
Day Chart double bollinger bands - price closed above BB midline bullish bias
4H Chart - Macd crossed above zero line and Price closed above 100 sma bullish bias
1H showing possible bearish retracement back to the 50 sma area, macd over bought
15m showing possible bearish retracement back to 50/100 sma, macd over bought
Take Profits will be in updates below

Best Indicators for Day/Swing Traders and How to Use Them
An Introduction
This is a quick overview of three of the best trading indicators for day and swing traders alike. If you are a new trader then it is very important for you to understand that no indicator or oscillator is going to make you trade profitably immediately, so don’t go on a wild goose chase to find one that will. Learn a select few indicators and the methods and strategies to use them effectively. Master them, and then learn more.
“Your strategy will be more profitable using fewer indicators that you have mastered. Then more indicators that you haven’t.”
Let’s begin.

GBPAUD 4H REVERSAL - DAY RANGE TRADESGBPAUD is in a Day range pattern
Price is at the bottom of the range and also at a long term sup/res level
Price can bounce off range bottom or breakout and continue the trend
Day Breakout trade -
Sell Stop @ 1.7520
Take Profit @ 1.7420
Watch Macd to cross below Red signal line - close trade if Macd crosses above Red signal line again
4H Reversal Trade
1st Buy Stop @ 1.7775
2nd Buy Stop @ 1.7805
3rd Buy Stop @ 1.7875
Take Profit 2 options
Opt 1 - 1st and 2nd Trades take 1/2 profit at 50 pips each - run with balance to take profit
Opt 2 - Run all 3 trades to take profit
Take Profit @ 1.7920

BTCUSD DAY TRADEABLE SPACEPrice paused a Day Support
Price will either break bullish or bearish
Bullish Trade
Use your trading plan for entry
Take Profit at 0% fib
Bearish Trade
Bearish side has a trade-able space to the left clear of consolidation
15m break-hook-go pattern for entry short
Take Profit from a Day support level

Simple BTC USD 1% per day (compound that for a couple years)Money Flow index is similar to RSI but I feel presents more buying opportunities, however it's hard to use RSI and MFI to decide when to sell reliably - however making 1% profit per day (on average, don't try to force a trade if the RSI and MFI is high, just wait until it is low) can be done with this method and adds up over time.

LTCUSD DAY TRADESPrice at a decision point - Bear or Bull fork on Day Double Bollinger chart
Price has setup in between 100 sma and 50 sma for bearish move
Macd has setup an over bought bearish pullback

Day trade- USDCHF longIm waiting for market back to support area (0.99155)
EP: 0.99155
SL: 0.98955 (-20)
TP1: 0.99355 (+20)
TP2: 0.99555 (+40)

Still Bearish on Day Chart BTCBTC price is currently being supported by 100 day EMA. Also large support exists given the price volume profile visible range around 8800. CMF looks to have hit the top and will now see more selling pressure as it declines. We are not seeing spikes and dips in the OBV so volume has been relatively constant. Ichimoku Cloud is in the red zone with the Base line (pink) still above the Conversion line (Orange), a bearish signal.
Still a very bearish outlook on the Day chart. Price will need to break 12k for a bull reversal.

GBPUSD 4H TRADESEURUSD fell to 800 sma
GBPUSD could follow
Short Trade
Sell Stop @ 1.3867
Take Profit @ 1.3775
Long Trade
Buy Stop @ 1.4005
Take Profit @ 1.4070

GLOW Hammer Forming Looks like GLOW may be signaling a bottom. With a green hammer forming on the daily chart this could be a change in the trend. GLOW has been flirting with sub $.19 but held up well. GLOW has a p/e of nearly 1.28 and total assets of 15.42 mil. Could be a short squeeze coming.

just wanna ask , hat if i sell usd/jpy now?since the world war 3 that has been going on , which the obviously will make the currency to decrease

GOLD / XAUUSD / ELLIOT WAVES / DAY ANALYZISWIZARD OF FARTS AND CHARTS AT YOUR SERVICE!
Just because I was in a good mood I decided to calculate an estimate for you guys how we are moving in 1D chart counting to Elliot Waves.
The wave targets are subjective at this point because we dont have enough data but this is my rough estimation.
THIS IS NOT AN INVESTMENT ADVICE!
