kvmev / GBPJPY long / 01/02/2026 - 07/02/2026Price is currently trending bullish on the daily time frame.
Break and retest oh h4 time frame, looking to hold buys until double top is retested.
Daytrader

Wait for Liquidity. Then Execute.CAPITALCOM:US100 Overall structure remains bearish on both HTF and LTF.
Price is trading around 25,000, holding below key resistance zones. No structural shift confirmed yet.
VANTAGE:NAS100 In the short term, price may attempt a corrective
pullback toward 25,300–25,400, where prior imbalance and resistance sit.
As long as there is no acceptance above 25,400, this move is corrective only, not a trend reversal.
🎯 Key Levels & Scenarios
Upside (Corrective only)
• 25,300–25,400
→ Liquidity grab / short term pullback zone
→ Preferred area to look for short setups on rejection
Downside targets
• 24,800
→ Immediate intraday support (currently in play)
• 24,600
→ First clean downside objective
• 24,000
→ Major HTF liquidity pool / extended bearish target
⚡ Scalp Ideas (LTF)
Scalp Short
• Rejection from 25,250–25,400
• Weak bullish momentum or lower high on LTF
• Targets:
→ 25,000
→ 24,900
Scalp Long (counter trend, quick only)
• Strong reaction from 24,900–24,850
• Clear displacement and acceptance on LTF
• Targets:
→ 25,050–25,150
• Reaction trades only, not swing longs
⚠️ Invalidation
• Sustained acceptance above 25,400
→ Weakens immediate bearish continuation
→ Requires reassessment of short bias
Until invalidation occurs, rallies are sell side opportunities, not reversals.
Bias stays bearish. 📉🦈
🧠 Execution Reminder
Higher time frame first.
Lower time frame execution second.
Not investment advice. Always manage your own risk.

xauusdthis week was not so good after monday,, well some time there is no trend so need to calm.
i see my prediction bias on daily time frame, here is 4h frame
i may wanna say it is risky to buy gold on such high price but if that is the trend and still continue so we follow the trend according rule and dicipline.
made some clean line and hopefully it may help you all to understand. if not
leave a comment below.
happy weekend

1/15 recap - Tears are real and we cannot have all winning daysPremarket POI map
Key levels I marked:
NY AM High: 25,954.25
PDH: 25,878.75
NY AM Low: 25,803.50
POIs above: 25,871.25 / 25,920.50 / 26,006.00 / 26,083.50 / 26,106.25
Lower POIs: 25,690.00 / 25,670.25 / 25,622.50 / 25,596.25 / 25,579.50 (and lower)
Gameplan (simple):
Bull case: reclaim/hold PDH + POI1 → push to POI2/POI3.
Bear/flush case: lose AM Low → next POIs below.
What price actually did (chart story)
Early session: Price was strong (green trend/structure), then sold off from the upper POI zone, showing “decision candle” rejection near your POI2 area.
Mid-morning: The drop drove into the NY AM Low (25,803.50) zone (I highlighted this). That level acted like the decision point.
Reversal confirmation: You caught the key idea—hold AM Low → reclaim back into PDH/POI1 area. Your later screenshots show LONG valid entry printing around the POI1 / PDH reclaim area and then continuation.
Clean takeaway: Today’s “A+” idea was the AM Low hold + reclaim (your circled 25,803.50).
Your Trades (QQQ 1/15 Calls) — lined up & totaled
From your trade screenshot list:
Sequence (CST)
11:18 – Buy QQQ 1/15 $627C x3 @ 0.43 → -129
11:23 – Buy $627C x3 @ 0.40 → -120
11:31 – Buy $627C x4 @ 0.28 → -112
12:05 – Buy $627C x5 @ 0.21 → -105
12:15 – Buy QQQ 1/15 $626C x2 @ 0.54 → -108
13:40 – Buy QQQ 1/15 $625C x1 @ 0.18 → -18
Late-day closes / salvage:
14:11 – Sell $625C x1 @ 0.05 → +5
14:17 – Sell $626C x2 @ 0.02 → +4
14:37 – Sell $627C x15 @ 0.01 → +15
P/L Summary
Winners: +$24
Losers: -$592
✅ Net P/L: -$568.00
What this means in plain English: you kept a bullish thesis (calls) while price/IV/theta didn’t pay fast enough, so the position decayed and you ended up “selling for pennies” into the close.

GOOGL (daytrading)-D1 (Daily chart):
The price is moving inside a channel (read comment)
It touched the support line (the bottom line).
-H1 (1-hour chart):
Price is moving sideways (no clear up or down).
Expect going up
-R:R = 1:2 (Risk : Reward)
You risk $1 to try to make $2.
👉 This is good risk management

Bulllflag QQQ Tight stopPretty clear in the picture consolidating around price you could argue its a triple top but people often forget even within a triple top you can rip past price just to come back down. Doubt we see an explosive move today but something to be mindful of

XAUUSDbased on tecnical only the breakout and creating new low or high will have the new confirmation what gold really up to? considering as an this week gold had played side ways and din break the inside resistent and support. lets see how gold close as weekly candle.
clear draw on the chart so take a good look and understand.
what you think leave a your comment below.

BTCUSDwhat a hug drop base drop, as my analysis i see continustion drop on btcusd after the confermation or next (nfp) as i have draw some on chart it may help to understand that support and liquidity and new low has been created, now pull back..
let me know what you all thinking drop your comment .
safe trade,

Gold’s Next Explosive Move: The Chart No One Is Talking About...Important assumption (stated clearly): I do not have the image of your exact chart or the numeric value of the blue-line target, so this analysis assumes the blue-line target is above today’s spot level and represents a meaningful resistance/target on the weekly/monthly timeframe. If your target is below current price the technical story flips — tell me the exact value or upload the chart and I’ll adapt.
---
Executive summary — the short thesis
Gold’s move toward the blue-line target is plausible because three mutually reinforcing themes are in play:
1. Macro tailwinds (inflation persistence + lower real rates expectation → higher gold demand),
2. Structural demand (central bank buying + ETF/institutional accumulation), and
3. Technical breakout dynamics (momentum, volume confirmation, and common extension targets).
Each theme alone can push price higher; together they create a high-probability path to the blue line — but risks (real yield rebounds, USD strength, rapid risk-on reversals) can abort or delay the move.
---
1) Macro and policy drivers (why gold wants to be higher)
Real interest rates are the single most important macro control on gold. Lower or falling real yields reduce the opportunity cost of holding non-yielding gold, improving gold’s appeal as an inflation hedge. Markets are pricing a path toward easier policy (or lower terminal rates) and that compresses real yields — a pro-gold environment.
Inflation expectations and uncertainty remain elevated. Where inflation expectations stay sticky, investors and treasuries use gold as insurance. If headline or core inflation surprises on the upside, that directly supports continued buying.
Geopolitical & risk-off shocks amplify the move. Any escalation in geopolitical risk (trade tensions, regional conflicts) increases safe-haven demand and often triggers large, fast price jumps.
(Load-bearing facts for this section: central bank buying, inflation drivers, Fed expectations — see cited institutional and market commentary.)
---
2) Structural demand and flows (why the rally can be sustained)
Central banks continue to add to reserves. Persistent, sizeable purchases by official buyers create a structural bid that is different from short-term spec flows — it’s long-dated accumulation. That reduces available supply for investors and supports higher levels over months/years.
ETF and institutional flows are material. Record or heavy inflows into gold ETFs and funds add persistent buying pressure; large inflows can sustain rallies beyond purely technical breakouts.
Retail and seasonal physical demand can reinforce rallies. Jewelry seasons and retail demand (Asia, Middle East) often coincide with price momentum, adding a final push toward technical targets.
---
3) Technical structure — how price actually gets to the blue line
(I’m speaking generically because I don’t have the exact chart; apply these to your time frame — weekly or daily — whichever your blue line sits on.)
Breakout + retest dynamic: If price has broken a multi-week/month resistance (or important swing high) and then retested it successfully with rising volume, the path to the next measured target (often a measured move or Fibonacci extension) becomes much more likely. Traders and algos use these confirmations to add size.
Momentum and moving-average alignment: A stack of moving averages (e.g., 50 crossing above 200 — a "golden cross" on longer timeframes) plus rising RSI and MACD momentum supports an extended impulse leg toward the blue-line.
Volume & open interest: Increasing cash/spot volume and rising futures open interest on advances indicates real participation (not just short covering). That structural participation reduces the chance of a quick reversal and helps sustain a push toward obvious targets like your blue line.
Common extension targets: Traders commonly use Fibonacci extensions (127–161.8%), prior range height projections, or measured moves from consolidation to set the “blue line” style targets. If the blue line aligns with one of these projections, it gains legitimacy as a target because many actors place orders there.
---
4) Market structure and supply-side constraints
Physical mine supply is relatively inelastic short term. Mines can’t quickly add meaningful tonnage, so when demand surges, price adjusts more than quantity. Capital spending and long lead times for new production create upward pressure if demand remains strong.
Scrap supply is cyclical and price-sensitive. As prices rise, scrap supply can increase, capping upside — but that often lags price moves, letting gold run first then supply grow later.
---
5) Alternative scenarios — what would stop it
Real yields rebound fast: A surprise hawkish central bank reaction or unexpectedly strong employment/inflation data could push real yields higher and crush the rally.
US dollar strength returns: A sharp USD rally would subtract from USD-priced gold and can stop a run toward the blue line.
Flow exhaustion / profit taking: If ETF flows stall and positioning becomes one-sided, a volatility spike could trigger a fast unwind.
---
6) Probability framing & tactical checklist (how I’d watch it as an analyst)
High-probability signals that validate the path to the blue line:
Spot > key resistance with a clean retest and higher-than-average volume.
Open interest in futures rising alongside price (not diverging).
Continued central bank purchases / ETF inflows reported weekly.
Macro path: market pricing of Fed easing or lower terminal rates, or at least declining real yields.
Warning flags: real yields spike > 50–75 bps, USD index sharply higher, or a sudden halt/ reversal in ETF flows.
---
Concrete near-term scenarios (example probability splits, adapt to your time frame)
Base case (45–55%): Macros stay supportive, technical breakout consolidates — price reaches the blue line over several weeks. (Most likely if volume and flows continue.)
Bull case (20–25%): Macro shock (big geopolitical event or accelerating inflation surprise) causes an overshoot beyond the blue line — fast, big move.
Bear / failed breakout (25–35%): Real yields rebound or flows reverse; price fails to sustain above resistance and falls back to prior support.
---
Practical phrasing you can post under the chart (English, professional + share CTA)
> Market-leading analysis (professional):
The blue-line target is a natural extension of the current multi-month breakout. Macro conditions — persistent inflation expectations, lower real yields priced by markets, and ongoing central-bank accumulation — create a structural bid. Technically, a confirmed breakout with rising volume and expanding open interest will propel price toward the blue line; Fibonacci and measured-move projections align with this target, increasing its credibility. Counter-risks are a rapid rebound in real yields or a stronger USD, which would likely stop or reverse the move. This is an analysis, not investment advice — monitor real yields, ETF flows and the breakout retest for live confirmation.
Like and comment — tell me your view and what time-frame you want me to focus on.
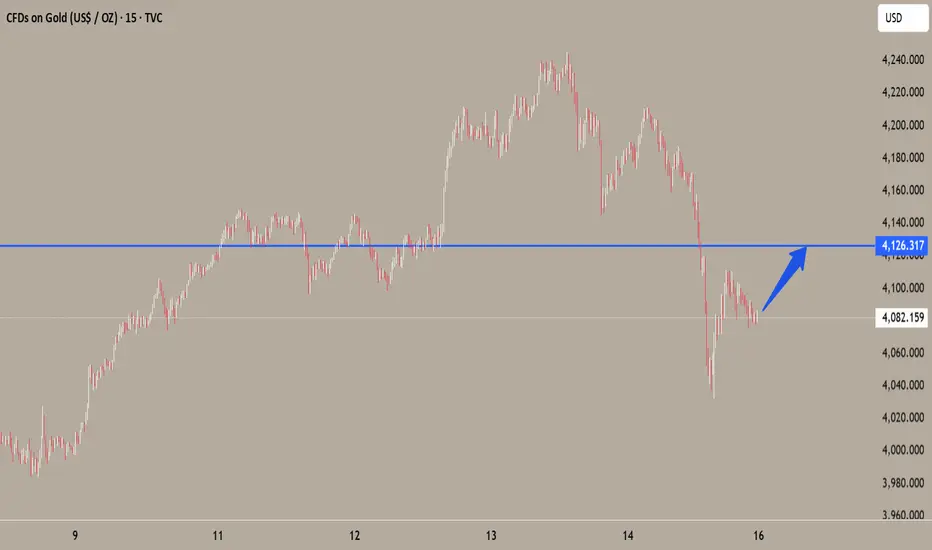
XAUUSD5% drop in a day was incradibale move short on gold. made some clean analasis 4h time frame, i believe that gold is still on short for 1 more major drop as reteste was great on 4000.
trade with own risk,,, this is just an idea.
let me know what you all think about the metal?
happy weekend.

GU, UJ & Gold Weekly Outlook | Key Levels & Trade Plan |Oct 6–10This week’s market outlook is packed with opportunities and risks. In this video, I walk you through my personal chart structures on GBP/USD, USD/JPY, and Gold, showing you the levels I’m watching, what they reveal about market sentiment, and how I’m planning my trades for the week.
By the end of this video, you’ll:
✅Understand the key support and resistance zones driving price action.
✅See how I balance fundamentals and technicals in real time.
✅Learn why structure is my guide, not predictions.
✅Get a practical roadmap to approach the week with confidence.
⚠️ This isn’t a signal service; it’s my personal trading map, shared to help you think and trade smarter.
🔔 I’ll also be dropping updates in the comments section as the week unfolds, so keep an eye there for my real-time thoughts.

USDJPYas i live in japan but not much as i trade on this pair, here is what i see potentional move aftre brinking the resistent or support, can catch up the trend follow.
the line may make youu clear image, this analysis is base on weekly frame to 4H
weekly low.
weekly high
leave your comment or any qustion in the comment.

XAUUSD3 week continue long on gold after breaking 3500 , it took 3 month around , are we looking for 4000 coming within this month? is gold short or keep up trend.? i am sure everyone have this question in mind.
i have drawed line to understand what could happend as it is an analysis base on education, every price need to be confirmed after breakout and retested with rejection,,, and it take time to predict the direction of the market.
i had a great 3 week. how about you leave your thoughts in the comment.

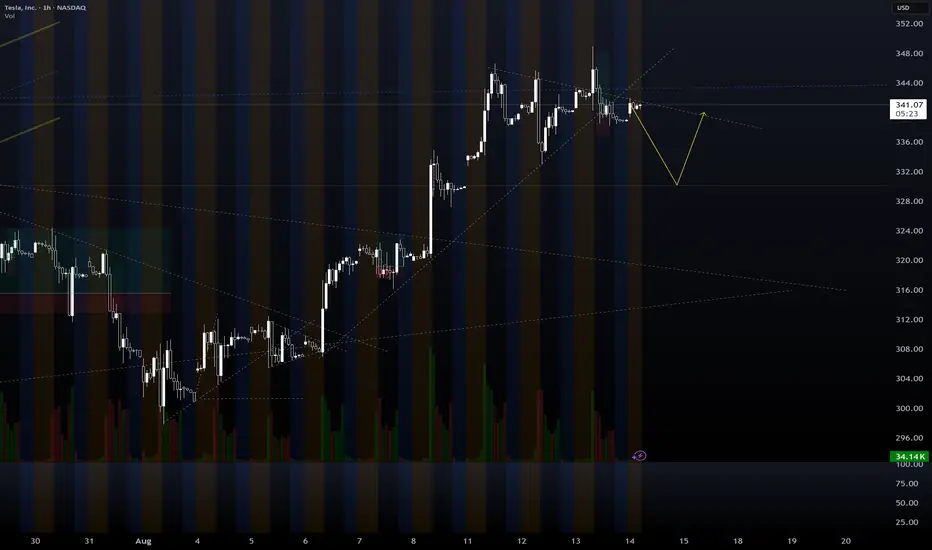
TSLA (daytrading) 2 plan for itPlan 2 could be possible because:
(p1 price is on sma 50 d1,p2 could be sma 200)
TSLA still has a small gap below that might need to be filled.
This week doesn’t look good for the overall market.
I will continue to watch it closely

BTCUSDi am looking for 1 sharpe retest and quick short on btcusd, as on major higher and high 3 major attempt on weekly time frame. simple draw line you may understand the reason as trend line has a huge gap beetween market that gap considerd to be filed up... if btc continued go high by end of this year. let me know your opinion in the comment. trade with confirmation only.

TSLA daytrading (fill gap)1. tsla still have a gapp need to fill
2. tsla break down the trend line could pull back a little bit
* in the past tsla is not often fill fill the gap so just watch. dont put down
META daily updade(swing) Meta after break out is going retest the flag.
have 2 important point to get in.
ready to entry and watch out could fake break out.

GBP/USD Short
Looks like its safe to say the trend has now changed on the daily timeframe. Only looking for shorts. Lower timeframe entries (4hr, 1hr) in conjunction with daily key levels. Targeting the nearest daily levels for TPs. You know what to do. Good luck my friends.
Follow me for more!
Professional Trader - Michael M.

GOLD: Pre-market PrepSo for gold today, I see a lot of confluence around the prior week's high, prior day's high, and the prior value area high. We also had a poor high last Friday that we've clearly broken through.
Right now, we're in balance up above these key levels. My immediate plan is to continue going long up to the prior month's value area high. If we get a pullback to the confluence area, I want to take it up from there.
If the market opens and we accept back into the previous area, I'll be looking to go short from that area and take it down. That's my main analysis for gold today. Let’s trade smart, peace!

XAUUSDgold has played over a week and finally took a long as we know it will fly on wednesday but trap with seller.. i am looking for continue long on gold, as i have drw simple line reason is clear w pattern,, and the (bos) .. lets see is it flying without fvg, or lit a bit to fill the fuel..what are your thought let me know in the comment.

Pre-Market Prep 7.18.2025What it do, everyone! Here’s my pre-market prep for Friday, July 18th. Just to give you a quick overview, I'm using my prior value areas, the prior day's high and low, and the CVA levels from my market profile. I use all this history to help me plan my trades for the day.
So, starting with the S&P, as of now we’re green across the board. We’re in balance up from the prior day’s range, value area, and the CVA. My main plan is to look for acceptance and a pullback to a confluence area for longs. If we get rotational and break out of that area, I’m ready to go short.
For the NASDAQ, it's a similar story. We’re rotational in the prior value area and range, but we’re balanced up from the recent CVA. Right now, I’m waiting to see if we can confirm acceptance and then I’ll look for a short from that rotational area down to the prior value area low.
In the Russell, I’m seeing clear acceptance above all levels, so a pullback to the confluence area for a long would be ideal.
For Gold, I’m also seeing it in balance up on all fronts. My first move would be a long from the prior day’s high. If we drop a bit lower, I’ll be looking at that CVA and PVA area for another long.
The Euro is a bit more mixed. We’re rotational in the prior day’s range but balanced up in the value area and CVA. I want to clear the prior day’s high before taking any big moves.
The Yen is also rotational, so I’m looking to trade the extremes, maybe some scalps while we’re balanced in the prior value area.
For the Aussie Dollar, we’re in balance up from the PVA, but rotational in the prior day’s range and CVA. I’m looking for shorts near the top area and longs at the bottom, staying out of the middle for now.
And finally, Crude Oil is rotational on all fronts. My first plan is to look for shorts from the confluence area down to the prior day’s range.
That’s my pre-market prep for today. Let’s trade smart. Happy Friday, peace!

Pre-Market Prep
Today, I'm narrowing down to six key markets. For the S&P, it's all about waiting for a pullback from the prior day's high or a breakout above the CVA. If it dips back inside the range, I'm ready to go short with some scalps.
For the NASDAQ, it's looking strong. I'm thinking about a long position if it pulls back to the prior day's high.
Gold is in a downtrend across all areas, and I'm already in a short position from the CVA low. I'm thinking about adding to that if it pulls back to the prior day's low.
Crude Oil is pretty balanced. I'm looking at the high of the CVA for a short opportunity if it gets there.
For the Yen and Euro, both are rotational. I'm eyeing long opportunities if they show some acceptance and pullbacks from key levels.
That's the vibe for today. Let's trade smart, avoid the chop, and keep it moving. Peace!

