LTC/USDT – Breakout Above $135 Could Trigger Rally Toward $240Litecoin is approaching a pivotal breakout point after consolidating within a multi-year accumulation range between $60 and $140.
The recent higher-low structure and sustained strength above $100 reflect improving market sentiment and growing accumulation interest.
A decisive weekly close above $135 would confirm a breakout from this long-term base, potentially initiating a mid-term rally toward $180, followed by the major supply zone at $230–$240.
Momentum is steadily shifting in favor of buyers, supported by improving trend alignment and volume behavior.
As long as the $95–$100 support zone remains intact, the technical bias stays bullish, and the broader market structure favors continuation to the upside.
These are my observations and plans based on my chart analysis and not financial advice.
Daytrading

XAUUSD (GOLD SPOT)# 💰 XAUUSD (GOLD SPOT) COMPREHENSIVE TECHNICAL ANALYSIS 🎯
## Week of November 10-14, 2025 | Intraday & Swing Trade Mastery
Close Price: 4,001.15 USD/oz | Entry Point: November 8, 2025, 12:54 AM UTC+4 📈
## 🔍 EXECUTIVE SUMMARY - MULTI-TIMEFRAME PERSPECTIVE
Gold is at a critical inflection point near the psychological 4,000 barrier. Technical structures across all timeframes reveal early accumulation patterns with institutional interest evident in volume clustering. Elliott Wave analysis suggests we're completing corrective cycles before the next impulse leg. Bollinger Bands are contracting significantly, indicating a major volatility expansion imminent . RSI readings show healthy neutral bias (not extreme), creating optimal entry windows. Harmonic patterns converge around 4,010-4,050 resistance—breakthrough here targets 4,100+ extension. Wyckoff spring tests near 3,980-3,995 zone provide dynamic support triggers for aggressive buyers.
## 📊 TIMEFRAME-BY-TIMEFRAME ANALYSIS
### 5-MINUTE (Scalping Precision) ⚡
Candlestick Formation: Japanese candles reveal micro-consolidation patterns with doji and hammer formations at support zones. Evening Star pattern spotted at 4,010 resistance—potential intraday reversal trigger.
Elliott Wave 5M: Sub-wave completion suggests wave 4 micro-consolidation nearing apex. Wave 5 breakout anticipated 4,005-4,015 direction with targets 4,025-4,035 (measured move).
Bollinger Bands: Extreme compression mode—middle band at 3,998 acts as pivot. Lower band rejection patterns at 3,988-3,992 create scalp-long setups. Upper band squeeze breakout targets 4,020+.
RSI (14) Analysis: RSI oscillating 42-58 range—neutral zone with divergences forming. Bearish divergence at 4,012 resistance suggests caution; bullish divergence at 3,990 support signals buyers engaged.
Micro Support/Resistance: 3,985 (micro-support) | 3,995 (POC cluster) | 4,005 (pivot) | 4,015 (intraday resistance) | 4,025 (scalp target)
Volume Signature: Volume concentrated at 3,995-4,005 zone—institutional accumulation marker. Breakout volume required above 4,015 for sustained move above 4,030.
VWAP Alignment: Price hugging VWAP around 3,998—each touch generates scalp opportunity. Upper VWAP band at 4,018; lower band support at 3,982.
### 15-MINUTE (Quick Swing Setup) 🎢
Candlestick Patterns: Engulfing bars forming at support—bullish engulfing at 3,990 zone signals reversal attempts. Three-candle patterns (flag continuation) detected with 25-40 pip breakout potential.
Harmonic Pattern Recognition: Gartley Pattern potential completion near 3,990-4,005 PRZ (Potential Reversal Zone). Risk-reward ratio compelling at 1:3 for harmonic traders. Butterfly variant also forming.
Wyckoff Accumulation: Classic accumulation phase evident—small barometer move (SBM) near completion. Spring test anticipated around 3,975-3,985; markup phase should follow.
Bollinger Bands (15M): Band squeeze intensifying—historical analysis shows 30-50 pip moves follow. Upper band resistance at 4,028; lower band support at 3,975.
Volume Profile: Point of Control (POC) at 3,998—high-probability concentration zone. Volume surge required for breakout confirmation above 4,020. Imbalances favor upside potential.
Ichimoku Cloud (15M): Price consolidating below cloud—Tenkan-sen at 4,008 acts as resistance. Kijun-sen (4,002) = critical pivot. Cloud support zone 3,985-3,995.
EMA Structure: EMA 9 (3,999) above EMA 21 (3,992)—bullish alignment confirmed. Price above both = continued intraday strength.
### 30-MINUTE (Intraday Swing Foundation) 🔄
Pattern Formation: Symmetrical Triangle pattern forming with apex near 4,020 area. Ascending triangle variant shows bullish bias—breakout above 4,025 targets 4,060-4,075 extension.
Dow Theory Application: Confirming higher highs/higher lows structure on corrected timeframe. Secondary trend turning bullish; pullbacks to EMA 20 (4,000) = optimal entry zones.
RSI Divergence Setup: Positive RSI divergence confirmed—price making lower lows (3,988) while RSI forms higher lows (38 level). Classic reversal setup targeting 4,035 minimum.
Exponential Moving Average: EMA 9 (4,001) = price anchor. EMA 21 (3,995) = secondary support. EMA 50 (3,975) = structural support. Bullish ribbon alignment intact.
Support Architecture: 3,975 (EMA 50/structural) | 3,990 (demand zone) | 4,000 (psychological/EMA 20) | 4,010 (volume cluster)
Resistance Architecture: 4,020 (triangle apex) | 4,035 (extension target) | 4,050 (weekly resistance) | 4,075 (measured move)
Volume Analysis: Volume increasing on last 3 bars—accumulation signature. Buying volume > selling volume confirms institutional interest.
### 1-HOUR (Core Swing Trade Engine) 🎯
Elliott Wave Structure: Major wave analysis suggests potential Wave 3 completion near 4,050. Current Wave 4 correction targets 3,990-4,005 support zone. Wave 5 impulse anticipated—target: 4,100-4,150.
Pennant Formation: Classic Bullish Pennant pattern consolidating—breakout confirmation above 4,025 validates pattern. Pole height measured move = 4,100+ target.
Bollinger Bands (1H): Upper band at 4,060 = squeeze breakout target zone. Middle band (4,010) = bullish support. Lower band rejection (3,970) creates swing longs with great R/R.
VWAP Daily: Gold trading above daily VWAP at 3,998—bullish gradient confirmed. Each hourly candle close above VWAP strengthens trend continuation probability.
Volume Profile Hotspot: Heavily traded at 3,995-4,005 (support accumulation) and 4,020-4,035 (resistance cluster). Imbalances above 4,040 suggesting vacuum-fill potential.
Ichimoku Cloud Alignment: Price above Senkou Span A (4,005) & Span B (3,995)—cloud thickness indicates strong support. Chikou Span above candles = bullish confirmation. Cloud color: BULLISH GREEN.
Gann Theory Application: 45-degree angle from swing low (3,960) establishes rally angle. Resistance at 38.2% Fibonacci extension (4,035) = aggressive breakout trigger.
Support Tiers 1H: 3,970 (structural hold) | 3,985 (EMA support) | 4,000 (psychological) | 4,010 (accumulation)
Resistance Tiers 1H: 4,025 (breakout trigger) | 4,035 (extension) | 4,050 (major level) | 4,075 (impulse target)
### 4-HOUR (Swing Trade Thesis Foundation) 💼
Inverse Head & Shoulders Pattern: Potential IH&S formation completing—left shoulder (3,955), head (3,935), right shoulder completing (3,970-3,990). Neckline breakout at 4,010 targets 4,075-4,100 extension.
Wyckoff Distribution/Accumulation: Institutional buying evident—SBM (small barometer move) completing. Spring test to 3,975-3,985 anticipated; then markup phase targets 4,080-4,120.
RSI 4H Deep Dive: RSI at 55-62 range—neutral bullish positioning. Room for upside extension without extreme overbought. RSI above 70 targets 4,100+; below 30 = defensive posture required.
Cup & Handle Formation: Potential bullish Cup pattern visible on 4H—handle stabilization near 4,000-4,010. Breakout above handle (4,035) targets cup depth extension = 4,080-4,100.
EMA Ribbon Structure: EMA 8 (4,002), EMA 13 (3,998), EMA 21 (3,995), EMA 50 (3,975), EMA 200 (3,850)—BULLISH ALIGNMENT. Compression/expansion cycles indicate momentum phases.
Support Tiers 4H: 3,960 (structural support) | 3,980 (accumulation) | 4,000 (pivot) | 4,015 (demand cluster)
Resistance Tiers 4H: 4,035 (key breakout) | 4,050 (extension) | 4,075 (major target) | 4,100 (weekly projection)
Volume Signature: Accumulation volume bars > distribution bars—bullish bias maintained. Volume nodes clustering at 3,995-4,010 indicate institutional support.
### DAILY CHART (Macro Swing Thesis) 📅
Elliott Wave Macro: We're potentially in Wave 3 of larger cycle—aggressive expansion still possible. Wave structure supports break of 4,050 targeting 4,150-4,250 daily close objectives.
Double Bottom Recognition: Historical Double Bottom pattern near 3,920-3,940 support—confirmed breakthrough above 4,010 neckline triggered. Second target near 4,100-4,120.
Bollinger Bands Daily: Upper band at 4,120 = realistic daily target. Mean (4,000) = healthy pullback support. Band slope indicates volatility expansion—expect 80-150 pip daily ranges.
Volume Profile Daily: Strong buying volume bar at 3,955-3,980 zone—institutional accumulation marker. Selling volume decreasing significantly—demand now controls trend.
Ichimoku Cloud Daily: Cloud thickness growing—bullish trend strengthening significantly. Cloud support around 3,980-4,000 zone. Kumo breakout anticipated—targets cloud top at 4,050-4,080.
Harmonic Analysis Deep: Butterfly Pattern potential completion—PRZ at 4,010-4,030 suggests reversal zone OR breakout confirmation. Confluence amplifies probability of extension.
Gann Angles & Fibonacci: 50% retracement (3,945) + 61.8% extension (4,080) = key reversal zones. Gann fan angles suggest 4,050-4,100 as structural resistance before continuation impulse.
Key Daily Support: 3,920 (psychological/structural) | 3,960 (accumulation zone) | 3,990 (demand level) | 4,000 (midpoint)
Key Daily Resistance: 4,035 (breakout trigger) | 4,050 (extension) | 4,080 (measured move) | 4,120 (weekly target)
Trend Confirmation: Higher highs & higher lows maintained—uptrend intact. Daily close above 4,050 = strong continuation signal targeting 4,150+ next level.
## 🎪 TRADING SETUP PLAYBOOK - NOV 10-14
### BULLISH SCENARIO (Probability: 75%) ✅
Trigger: 4H candle close above 4,035 + volume surge (>50% above average) + RSI above 60
Entry Zone: 4,010-4,025 (with breakout confirmation signal)
Target 1: 4,050 (TP1) | Target 2: 4,080 (TP2) | Target 3: 4,120 (TP3)
Stop Loss: 3,970 (below EMA/structural support)
Risk/Reward: 1:3.2 (excellent asymmetric setup)
Trade Duration: 24-72 hours (swing trade window)
### BEARISH SCENARIO (Probability: 25%) ⚠️
Trigger: Daily close below 3,990 + volume increase + RSI divergence failure
Entry Zone: 4,035-4,055 (short setup)
Target 1: 4,000 (TP1) | Target 2: 3,970 (TP2) | Target 3: 3,940 (TP3)
Stop Loss: 4,100 (above resistance)
Risk/Reward: 1:1.8 (acceptable but lower probability)
Trade Duration: Watch for trend reversal confirmation first
## ⚠️ VOLATILITY & OVERBOUGHT/OVERSOLD IDENTIFICATION
Current Volatility Status: Moderate-to-High compression → Expect significant expansion imminent
5M/15M RSI: 40-62 range (neutral)—room for 15-25 pip movements | Targets: micro-trend extensions
30M/1H RSI: 52-65 range (bullish bias, not extreme)—sweet spot for swing entries
4H RSI: 55-70 range—approaching caution zone but room to run | Still safe for core swings
Daily RSI: 60-75 range (approaching extremes)—be defensive if daily RSI>78 | Take profit aggressively
Overbought Recognition Signals:
RSI daily >75 combined with upper Bollinger Band rejection = take profits
Ichimoku cloud top penetration fails (bearish candle rejection) = trend exhaustion
Volume declining on breakout attempt = false breakout warning
Harmonic pattern PRZ exact hit without follow-through = reversal likely
Oversold Bounce Setups:
RSI 1H <35 on support touch = high-probability bounce back to 4,025-4,050
Price below EMA 50 (3,975) + RSI <30 = aggressive accumulation zone
Spring test below 3,970 with volume surge = Wyckoff spring reversal setup
Harmonic pattern PRZ support bounce = measured move extension targets
## 🎯 ENTRY & EXIT OPTIMIZATION STRATEGY
### OPTIMAL ENTRY TIMING
For Scalpers (5M): RSI bounce from 38-42 zone after Bollinger Band lower touch = 12-18 pip scalp target (1-3 min holds)
For Quick Swings (15M-30M): 15M candle close above 4,015 with 4H alignment = 40-80 pip swing target (30 min-2 hour holds)
For Core Swings (1H-4H): 4H pennant breakout above 4,035 on volume = 150-200+ pip target (hold 6-24 hours)
For Position Swings (Daily): Daily close above 4,050 = continuation play targeting 4,120-4,150 (hold 5-7 days)
Best Entry Windows: Asian close (GMT 8:00), London open (GMT 8:00), NY close (GMT 21:00)
### EXIT STRATEGIES & PROFIT TAKING
Take Profit Levels: TP1: Fibonacci 38.2% (4,045) | TP2: Harmonic PRZ (4,080) | TP3: Daily Band upper (4,120) | TP4: Weekly target (4,150)
Stop Loss Placement: Always below most recent swing low + 8-12 pips (strict risk management)
Trailing Stops: Activate at TP1—trail with 25-30 pip buffer for 4H+ trades (lock in profits while riding winners)
Breakeven Exit: Move stops to entry after 1:1 risk/reward hit—eliminates emotional trading risk
Partial Profit Strategy: Close 25% at TP1 | 25% at TP2 | 25% at TP3 | Let 25% run to TP4 (maximize winners)
## 🔔 REVERSAL & BREAKOUT RECOGNITION CHECKLIST
### REVERSAL SIGNALS TO MONITOR:
RSI positive divergence (lower price lows, higher RSI lows) = bullish reversal setup
Candlestick engulfing patterns at support/resistance zones = trend reversal confirmation
Volume profile breakdowns (declining volume on breakout attempts) = false move warning
Ichimoku Cloud rejection (price fails to penetrate cloud layer) = structural resistance confirmed
Harmonic pattern completion at exact PRZ = reversal zone high probability
Elliott Wave 5th wave failure (truncation) = impulse completion = reversal imminent
Gann angle break through significant angle = trend line break = reversal trigger
### BREAKOUT CONFIRMATION RULES:
Close beyond resistance with >30% volume surge above average = confirmed breakout
RSI crosses above 55 for bullish breakout, below 45 for bearish breakout
VWAP alignment with directional move = institutional participation confirmation
Bollinger Band breakout with band expansion (squeeze release) = volatility expansion confirmed
Multiple timeframe confluence (5M + 15M + 1H + 4H aligned) = highest probability setup
Ichimoku Cloud break (price clears all clouds with bullish candles) = strong confirmation
Volume imbalance (ask volume > bid volume) = directional sustain likelihood increases
## 💡 WEEK FORECAST SUMMARY - NOV 10-14
Monday (10th): 🌍 Consolidation continuation near 4,000-4,015 zone. Range-bound trading likely. Watch for early breakout direction. Entry setups favor reversal plays at support.
Tuesday-Wednesday: 📈 Breakout window opens—4,035 represents key decision point. Expect 60-120 pip daily volatility moves. Breakout confirmation targets 4,050-4,080 extension. This is the prime swing trade window.
Thursday (12th): ⚠️ Potential profit-taking pullback after previous breakout (if occurred). Support retest of 4,025-4,000. Buying opportunity if pullback holds above 3,985.
Friday (14th): 📊 Weekly close pattern formation critical. Extension run anticipated if above 4,050. If above 4,080 = week target 4,120+ achieved. End-of-week positioning for next week's trend.
## 📍 CRITICAL CONFLUENCE ZONES - KEY TARGETS
3,960-3,980: Major support zone (accumulation marker, Wyckoff spring area, structural hold)
3,985-4,000: Secondary support (EMA 9, demand cluster, psychological level, volume POC)
4,010-4,020: Micro-resistance cluster (consolidation squeeze zone, early breakout resistance)
4,025-4,040: KEY BREAKOUT ZONE (triangle apex, harmonic confluence, all timeframe resistance)
4,050-4,080: Primary upside target (Elliott Wave 5, daily Band upper, measured move extension)
4,100-4,120: Weekly resistance/extension target (macro resistance, Gann level)
4,150+: Monthly target (if wave 5 impulse extends beyond projections)
## 🏆 RISK MANAGEMENT RULEBOOK
✅ 1) Position Sizing: Never risk >2% of account equity per single trade
✅ 2) Risk-Reward Ratio: Minimum 1:2 R/R on every entry—1:3+ preferred for swing trades
✅ 3) Profit Scaling: Close 25-50% at 1:1 ratio, let remainder run to 1:2+ targets
✅ 4) Stop Loss Discipline: Place stop IMMEDIATELY on entry—no exceptions (10-15 pips tight)
✅ 5) Breakout Confirmation: Avoid FOMO—wait for candle close confirmation + volume surge
✅ 6) Daily Support Respect: Psychological holds (round numbers) matter—trade with confluence not against
✅ 7) Time Management: Exit losing trades quickly (max 1:0.5 acceptable for educational losses)
✅ 8) Macro Alignment: Always check daily/4H bias before taking 1H or lower trades
## #XAUUSD #GOLD #GOLDTRADING #TRADINGSETUP
#TECHNICALANALYSIS #ELLIOTTWAVE #HARMONICPATTERN #BREAKOUTTRADING
#SWINGTRADER #DAYTRADING #INTRADAY #FOREX #TRADINGVIEW
#BOLLINGER BANDS #RSI #ICHIMOKU #VWAP #TRADINGSTRATEGY
#WYCKOFFMETHOD #GANNTHEORY #DOWTHEORY #TECHNICALS #ANALYSIS
#SUPPORTANDRESISTANCE #VOLUMEANALYSIS #OVERBOUGHT #OVERSOLD #REVERSAL
#GOLDBULLS #COMMODITYTRADING #BREAKOUTSETUP #TRADERSOFTWITTER
#TECHNICALTRADER #CANDLESTICK #PATTERRECOGNITION #CHARTANALYSIS
## 🎁 BONUS: QUICK REFERENCE SIGNAL CHECKLIST
Use this daily before market open:
☑️ Check daily RSI (should be 55-70 for bullish bias)
☑️ Identify support/resistance zones (3,970 | 4,000 | 4,035 | 4,080)
☑️ Verify 4H chart alignment (pennant pattern status)
☑️ Check Ichimoku cloud position (above/below = trend confirmation)
☑️ Review 1H Elliott Wave count (which wave are we trading?)
☑️ Scan volume profile (POC = likely rejection zone)
☑️ Set entry orders + stop losses BEFORE market opens
☑️ Plan 3 Take Profit levels before entering any position
💡 Disclaimer: This technical analysis is educational only. Always conduct your own due diligence and risk management. Past performance does not guarantee future results. Trade responsibly and within your risk tolerance. Use stop losses on every position.
Analysis Created: November 8, 2025 | Valid Through: November 14, 2025 | Updated Hourly

Building a Trading System: From Idea to ExecutionEvery trader starts with an idea — a setup, a pattern, a theory that seems to work.
But until that idea becomes a structured system, it’s just intuition.
A trading system gives your ideas rules, logic, and repeatability.
That’s the difference between a trader who hopes, and a trader who executes.
Define the Core Idea
Every system begins with an observation.
Maybe you notice breakouts after volume spikes, or reversals after RSI divergence.
Whatever the logic, write it down.
A system has to be specific, if you can’t define it clearly, you can’t test it.
Set Your Entry and Exit Rules
Your system should answer three things precisely:
When to enter a trade
When to exit a trade
How much to risk
Ambiguity is the enemy.
Rules make your strategy repeatable, testable, and objective.
Backtest the Logic
Before going live, test your rules on past data.
You’re not looking for perfection, you’re looking for consistency.
If your logic survives bull, bear, and sideways markets, it’s valid.
Track win rate, drawdown, and profit factor — they’ll tell you what’s working.
Execute With Discipline
A system only works if you do.
Follow the rules exactly as tested, even when it feels uncomfortable.
Consistency turns probability into profit — emotions destroy both.
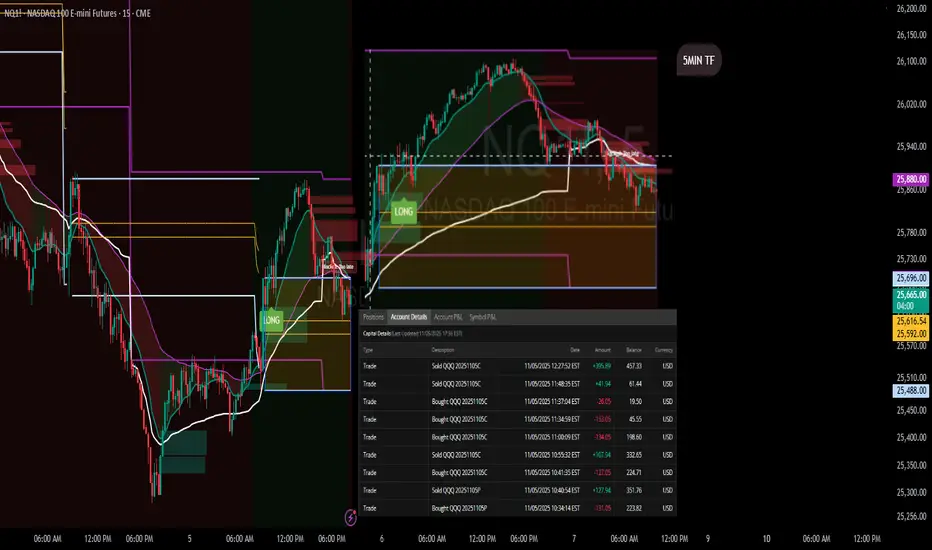
Application
Here we have a very good example from our trading signals where we executed one of our strategies for 10 days. The strategy was designed with detailed inputs, logic and executed with a precise setup in a trading bot.
Refine and Evolve
Once live, keep notes.
Track how the system performs under real conditions.
Make small, measured improvements based on data, not emotion.
A system should evolve, not change its identity.
Redefining and tuning is a part of the process, there is no strategy that lasts forever, everything needs to evolve and adjust!
$YM | Premarket Prep and Analysis | Higher Timeframe LISWalks through plans today for YM traders. Primary focus on shorts, but our clear line in the sand allows us to be flexible based on interaction with our levels.

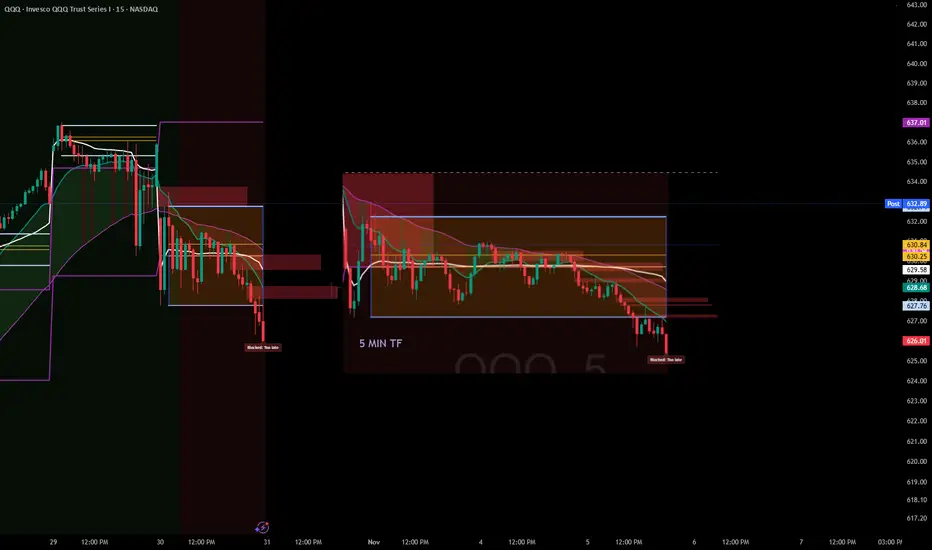
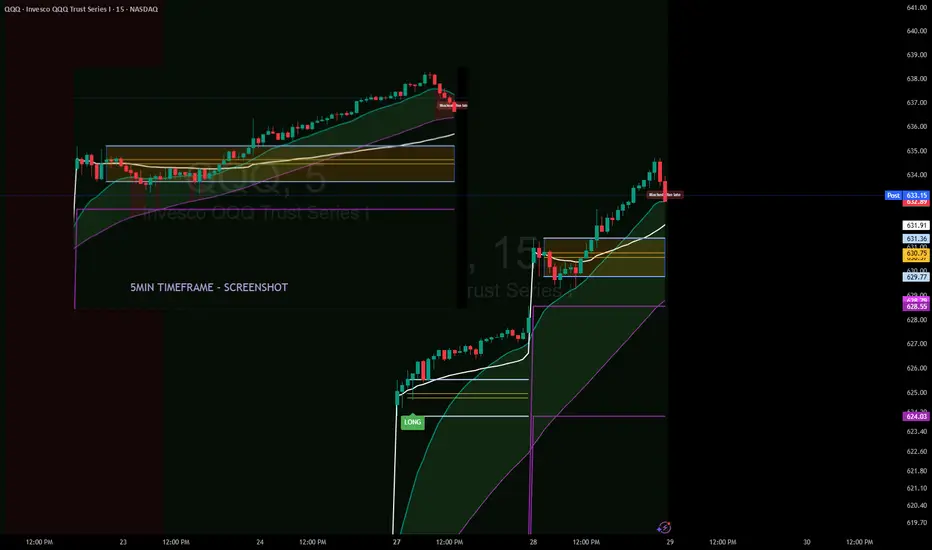
ORB Pro Signal Recap – Nov 5, 2025 | “Respect the Levels”Ticker: QQQ / NQ1! (5-min + 15-min TF)
Strategy: ORB Pro + Trendline Breakdown + Previous Day High Rejection
Focus: Signal confirmation & reaction zones
🧭 Market Context
The morning started strong, with buyers pushing off the open toward the previous day’s high (PDH) and ORB extension zone.
As price tapped the upper band, the ORB Pro system generated a clean long confirmation, aligned with the higher timeframe momentum.
But the rally quickly stalled at the PDH — a textbook reaction zone where the structure shifted.
From there, trendline breakdowns on both 5-min and 15-min charts confirmed exhaustion, and the system correctly prevented new long entries once momentum failed.
💹 Trade Breakdown
Initial Long: Taken on ORB Pro signal confirmation near the intraday retest (strong follow-through into PDH).
Profit-Take Zone: Price rejected sharply at the PDH and VWAP cluster — partials locked.
No Chasing: After the rejection, ORB Pro flagged “Blocked / Too Late,” keeping risk managed while trend flattened.
Result: Finished the day green with multiple small wins across calls — +$89.68 net on the $623C and +$15.89 on $626C.
📊 Performance Summary
Symbol Side Contracts Net Result
QQQ $623C Long 2 +$89.68
QQQ $626C Long 1 +$15.89
QQQ $622P Short hedge 1 –$3.11
Total P/L + $102.46 (Realized)
📈 Chart Recap
Price pushed through the early range with momentum but stopped exactly at the previous day’s ORB high and Fib confluence.
That rejection aligned perfectly with the HTF resistance zone on both 5-min and 15-min TFs.
The chart shows two green “LONG” entries and a clean signal fade once volume dropped —
a prime example of respecting structure over bias.
💡 Key Takeaways
PDH = Reaction Zone: Don’t ignore prior highs — they mark algorithmic defense zones.
Trust the Filters: ORB Pro prevented chasing the failed continuation after PDH rejection.
Structure First: The trendline breakdown confirmed what price was already telling us.
🧘♂️ Reflection
“The system signaled the move early, and I followed structure. PDH rejection confirmed the top, and discipline locked the profit. The goal wasn’t to predict — it was to react with control.”
YM (Dow), Short idea (30-minute+3-minute TF)See the bottom two charts for the red bear zone I have for today. While it's entirely possible (due to TFs above 30 minutes) for the market travel up past this bear zone, it's a great risk/reward opportunity to take a shot short this morning.
Look for an interaction with the red zone, and momentum shift based on your rules for entry.
Happy trading!
-StoicTrader

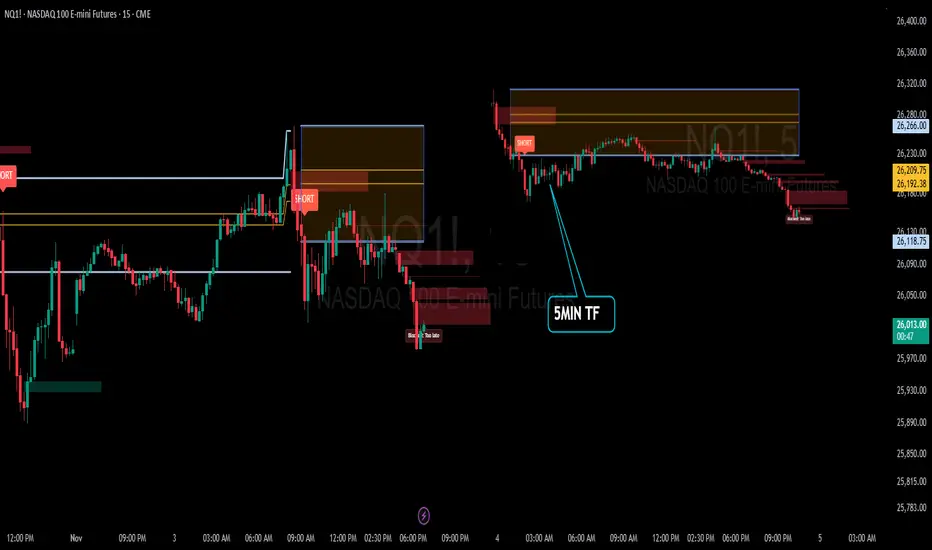
Recap: ORB Pro in Action | “Discipline > Direction”Date: November 3rd 2025
Ticker: QQQ / NQ1! (5-min TF)
Strategy: ORB Pro + Golden Pocket Retest + Volume Filter
Focus: Trend confirmation & controlled execution
🧭 Market Context
The morning opened sideways inside the ORB range — no clean conviction early on.
Around mid-morning, sellers gained control as lower highs formed beneath the EMA band and the Golden Pocket retest (0.5/0.618) failed with volume confirmation.
That break produced the clean short setup of the day, perfectly aligned with the higher-timeframe (HTF) downtrend.
🧠 Trade Review
Early Entries: Entered pre-confirmation and took initial heat.
Mid-Morning Setup: All filters aligned — EMA, volume, HTF direction. This was the textbook short that delivered follow-through.
Late Session Attempts: Momentum faded after lunch, with signals correctly blocked as “Too Late.”
Result: Several small wins offset by early losses, closing the day + $7.34 realized P/L after fees.
📊 Performance Snapshot
Metric Value
Win Rate ≈ 42 %
Best Trade + $287.94
Largest Loss – $189.05
Net Result + $7.34 (Realized)
Setup Accuracy High — execution mixed
📈 Chart Breakdown
The 5-minute chart highlighted a short trigger around 26 260 – 26 280, with smooth continuation into ORB extensions.
The ORB Pro filter marked “Blocked / Too Late” after the move — confirming that the system logic protected capital from late chases.
💡 Key Takeaways
Patience > Prediction — early entries rarely pay off.
Protect Green — partial profit lock once 1 R:R is reached.
System Strength — ORB Pro continues to validate structure when filters align.
🧘♂️ Reflection
“The system nailed the move — I jumped early. Still finished green, proving that execution discipline is the real edge. Tomorrow’s goal: one clean setup, one confident hold, and protect the profit.”
🧩 Next Steps
✅ Wait for full confirmation before entry
✅ Hold until 1:2 R:R min
✅ Avoid re-entries once HTF zone is tapped
Backtesting 101: How to Turn an Idea Into a Tested StrategyEvery trader has thought it:
“If I’d just followed that setup every time, I’d be up big.”
That’s where backtesting steps in, it separates luck from logic.
It’s how you find out whether your strategy has a real edge, or just worked in hindsight.
Most traders skip it, not because it’s useless, but because it forces them to face the truth.
But if you can handle that truth, backtesting will make you a far more confident trader.
What Backtesting Really Is
Backtesting means applying your trading rules to historical data to see how your system would have performed.
It’s not about predicting the future, it’s about proving whether your idea works in different market conditions.
When done properly, it gives you three key insights:
Profitability: does your edge actually exist?
Risk: how deep are the drawdowns, and can you handle them?
Consistency: does it work across bull, bear, and sideways markets?
A solid backtest gives you confidence, not because it guarantees profit, but because it exposes weakness before the market does.
The Most Common Mistakes
Curve-fitting: tweaking rules until the past looks perfect.
Ignoring fees and slippage: small costs that quietly erase profits.
Testing too little data: short periods create false confidence.
Focusing on one market: edges must survive different conditions.
If your backtest looks too clean, it’s probably lying to you.
Why It Matters
Backtesting builds trust in your system and discipline in yourself.
When you know your data, you stop second-guessing every trade.
Losing trades stop feeling like failure, because you understand they’re part of a proven edge.
Even bots rely on backtesting. Without it, automation is just random execution.
With it, every trade follows structure, not emotion.
All of these points make a difference between a winning or losing strategy.
From Idea to System
Every strategy starts as a hypothesis.
Backtesting turns that hypothesis into data.
Data turns into structure.
Structure turns into consistency.
That’s the real path to professional trading - logic first, emotion second.

XAU/USD Daily Structure – Bullish Reversal Targeting BPR ZoneA potential bullish reversal after a recent pullback, aiming for a retest of higher price levels.
Prior Price Action: The price experienced a strong uptrend (sequence of large green candles) leading up to the mid-October high, followed by a sharp pullback (red candles) which broke below a previous low, labeled as BOS (Break of Structure). This BOS confirms a short-term bearish shift or the start of a deep correction within the larger uptrend.
Current Price Level: The price is currently near $4,008.10, having shown recent bullish momentum (the last green candle) off a recent swing low.
Key Levels and Concepts:
D/FVG (Daily Fair Value Gap): There are two Fair Value Gaps marked on the chart.
The lower D/FVG (around $4,000 - $4,060) acted as an initial target or point of interest during the decline. The price has started to move up from this area.
The upper D/FVG (around $4,170 - $4,220) represents a future potential target.
BPR (Balanced Price Range): This blue area (around $4,160 - $4,180) is an area where a previous down move's FVG overlaps with a subsequent up move's FVG (or vice versa), suggesting a zone where the market might find temporary balance or resistance/support.
Projected Path: The black arrow illustrates a bullish projection. The price is expected to continue its upward move, potentially targeting the lower D/FVG for a re-entry/retest before making its way towards the BPR and the upper D/FVG as the final target of this short-term analysis.

AUDUSD | Smart Money Building Long Positions From Demand ZoneAUDUSD is showing early signs of strength after reacting perfectly from the higher-timeframe demand zone (0.6530–0.6550). Price is consolidating near intraday support, suggesting possible accumulation before a liquidity sweep to the upside.
Trade Outlook:
Demand Zone: 0.6530–0.6550 (retest area)
Liquidity Target 1: 0.6596
Liquidity Target 2: 0.6615
Bias: Bullish unless price breaks below 0.6530
Possible Play: Look for BOS + retrace entry confirmation inside demand

Trend Status: Strong Uptrend.The technical trend remains strongly bullish, but the stock is undergoing a necessary short-term correction or pullback.
Trend Status: Strong Uptrend.
Immediate Action: The market is testing a key support level (the shorter-term moving average). A bounce from this level would signal a continuation of the rally. A close significantly below the Green Line could suggest a deeper correction towards the 63.50 area or the Red Line.

The stock is neutral or slightly bearishThe technical trend is mixed:
Overall/Longer-term: The stock is in a broad consolidation/downtrend from its April/May highs.
Short-term: The stock is neutral or slightly bearish following a failed breakout attempt, currently trading just below a key longer-term moving average.
Key Level: A clear break and close above the red moving average (approx. $$$76.50 - $$$77) would be a strong bullish sign. A break and close below the recent consolidation low (approx. $$$71.00) would confirm a new bearish leg.

Based on macd and SMA ready to go up .Based on macd and SMA ready to go up . Simple moving average is ready and supportedby MACD also

ETH/USD Short Setup: Bearish Reversal Toward $3,830 TargetA short (sell) trade setup for Ethereum (ETH/USD).
The entry zone is around $3,870–$3,880.
The stop loss is set at $3,909.71, protecting against upside breakouts.
The target is $3,830.85, suggesting a downside move of about $40.
The price action and drawn arrow indicate expectations of a bearish move after a small consolidation

Bearish Continuation Setup with Defined Risk/RewardKey Observations and Trading Setup
Price Action Context: The price recently made a high around $4,045 and appears to be consolidating or forming a lower high after a previous upward move.
Identified Setup: A bearish (sell) trade setup is clearly marked on the chart.
The Entry Price appears to be around $4,009.24 (the current price shown on the OHLC data).
The Stop Loss (the maximum acceptable loss level) is placed at $4,030.62, just above a recent swing high, indicating the point where the bearish bias would be invalidated.
The Target (Take Profit) is set at $3,980.22, indicating the desired level to exit the trade for a profit.
Visual Representation:
The red box highlights the area of risk (above the entry up to the stop loss).
The green box highlights the area of potential reward (below the entry down to the target).
The white arrow clearly illustrates the expected downward price movement.

NZDCHF: H1 ATL BreakKey observations across the D1 and H1 timeframes
D1
Pair is in a clean downtrend
Right now, the bearish bar hasn't closed below the low of the bullish bar, which is a small point of concern for selling strength
H1
Price is crossing below a very structural ATL
EMA bands haven't crossed over yet

A Lesson in Patience and structure - ORB waited till 2pm todayFellow traders,
Today tested patience more than precision.
The morning was a maze — choppy price action, overlapping candles, and zero conviction. The ORB range between 9:30–9:45 never gave clean confirmation. Buyers held the low, sellers pressed the top, but neither could gain control. Every candle said, “not yet.”
Then came midday compression. From 11 AM to 1:30 PM, QQQ coiled tightly under the EMAs and VWAP. That silence wasn’t random — it was the market loading energy. The moment VWAP was lost for good, the floodgates opened.
Finally, around 2 PM, the breakdown came: a clean retest rejection of the ORB box and an accelerated drop through 629. The move I had been watching all day finally unfolded — only this time, discipline said don’t chase.
And that’s the point of today’s session.
Not every move is yours to catch. Sometimes your biggest win is not forcing a trade that forms too late or breaks your system’s timing window.
Patience is part of the strategy.
The setup played out exactly as it should — I just didn’t have to be in it to learn from it.
Stay disciplined. Stay sharp.
— Trades with B ⚡
Trading Bots: The Future of the Markets?Let’s be real, the idea of a trading bot sounds like the holy grail.
Set it up, go to bed, and wake up to profit.
If only it were that simple.
Most bots don’t fail because of bad code, they fail because of bad logic.
A bot is only as good as the rules you give it.
What a Trading Bot Actually Does
A bot doesn’t predict the market, it reacts to it.
It follows a defined strategy:
Buy when X happens, sell when Y is confirmed, cut losses if price breaks Z.
That’s all.
No fear. No greed. No “maybe I’ll wait for one more candle.”
The power of bots isn’t in magic,it’s in consistency.
They do what most traders can’t: follow the plan exactly as written, every single time.
Why Most Bots Fail
The truth?
Most traders plug in random bots they find online without understanding what’s inside.
They win a few trades, feel invincible… and then lose it all when volatility spikes.
The reason isn’t the bot, it’s the lack of testing and understanding.
If you don’t know your system’s weak spots, you’ll eventually find them the hard way.
That’s why backtesting matters.
Backtesting: Your First Line of Defense
Backtesting shows how your logic performs over hundreds of trades — across bull, bear, and sideways markets.
It reveals your system’s strengths, weaknesses, and drawdowns before you risk a dollar.
A good backtest should tell you:
Your average win rate and risk/reward ratio.
How your system handles volatility.
How often it hits consecutive losses.
Whether your edge actually holds over time.
If your bot looks good in backtests and performs similarly in live conditions — you’re onto something real.
*Example of one of our indicator
How Bots Can Enhance Your Trading
You don’t have to hand everything over to automation.
In fact, many great traders use bots to handle the mechanical side, while keeping the decision-making human.
Here are a few examples:
Trade Execution: Let the bot enter trades instantly after your setup triggers.
Risk Management: Bots can move stop-losses, take partial profits, or scale positions automatically.
Signal Filtering: Use automation to scan hundreds of pairs and alert you only when conditions align.
Backtesting Sandbox: Test new ideas safely with data before deploying them live.
Bots don’t replace traders, they multiply efficiency.
They free your mind from execution so you can focus on refinement.
The Real Lesson
A trading bot isn’t a shortcut.
It’s a mirror, it reflects your discipline, your rules, and your logic.
If your plan is solid, a bot will make it unstoppable.
If your plan is weak, it’ll just lose money faster.
Automation doesn’t fix bad habits, it exposes them.
So learn the logic, test it hard, then let the system do what humans struggle with most: follow the plan.

XAU/USD: Intraday Retracement into FVG Followed by Bearish ?Recent Trend: The overall trend in the past few days has been strongly bearish (downward), as evidenced by the price action from October 22nd to the 29th. The current candles show a slight upward bounce (retracement).
Fair Value Gap (FVG): A grey shaded area, the FVG, is clearly marked as an area of resistance and price inefficiency, located between approximately $3,960 and $3,980. This FVG was created during the most recent sharp move down.
Consequent Retracement Levels (CRT):
CRT-L (around $4,005) is the higher boundary of the recent downward structure.
CRT-H (around $3,915) marks a key low level, representing the anticipated target for the current move.
Proposed Price Action:
The price is currently showing resistance at the lower boundary of the FVG (around $3,949.99).
The primary arrow indicates the expected move: the price is anticipated to reject the FVG/current resistance zone, turn bearish, and continue its decline towards the CRT-H level at approximately $3,915.

Gold (XAU/USD) - Daily Retracement into Fair Value Gap (FVG)Prior Bullish Move & Sharp Reversal: The chart shows a strong rally throughout late September and early October, followed by a dramatic and impulsive bearish reversal starting around October 24th.
Fair Value Gap (FVG): A large Fair Value Gap (FVG) is clearly defined by the gray shaded box. This gap represents an area of price inefficiency created during the aggressive drop.
The price is currently trading within the lower boundary of this FVG (the current price is around $3,983.70).
CRT-L (Consequent Retracement Low): The upper line of the FVG (around $4,070) is the price level that marked the top of the range.
CRT-H (Consequent Retracement High): The lower line (around $3,935) appears to mark the 50% midpoint of the large down candle that created the FVG, or possibly a key level within the gap.
Proposed Price Action:
The current price action suggests an immediate continuation of the drop (indicated by the large green arrow) towards the CRT-H level ($3,935).
The curved black arrow suggests an alternative or subsequent scenario: the price might retest the upper part of the FVG (near $4,000) before making its eventual move.
Interpretation & Trading Bias
The overall bias is bearish due to the magnitude and speed of the recent drop.
The immediate focus of the analysis seems to be on a potential move lower to fill the remaining portion of the FVG, specifically targeting the CRT-H level. The FVG itself acts as a large zone of resistance and price mitigation. The daily timeframe suggests this drop is part of a major structural shift.

Recap: No Signal? No Problem. Reading Price Like a ProFellow Traders,
I had some time today to do a quick recap — let’s break it down.
Opening Morning
What happened? Exactly what needed to happen: nothing.
No signal. No golden pocket retracements. Nothing worth forcing a trade.
We saw a break of the ORB at 10:40 AM on the 5-minute chart. A bearish candle closed just below that level, but there was no signal giving any conviction of a further move.
Between 10:00 AM and 10:20 AM, the 5-minute candles also showed no real conviction. Even though they played right in the Golden Pocket, there was no close inside the pocket itself.
Looking for confluences in other signals — particularly the 0DTE Context Indicator — price action on both the 5-minute and 15-minute charts never pushed below any of the EMA, SMA, or VWAP lines. Again, no conviction for the bears to step in.
First Entry
I played the waiting game today. My first trade on QQQ 0DTE didn’t happen until 11:05 AM. When I saw price holding above my lines and refusing to break lower, I knew a trade was setting up to the upside.
You’re probably wondering what kind of contracts I took.
I typically trade CALL or PUT options with a Greek Delta of 0.40 or higher, which puts me just under an ITM option. Once I’m in, I aim for a 50% profit target, which can come fast with the right move. The lower the Delta, the higher the risk — so I keep it tight.
If you want more details on how I time those entries, feel free to DM me.
Price Action Confirmation
After entering, I made a few additional plays as price began to push above my 0DTE Context Indicator lines. On the 5-minute chart, the candles between 12:05 PM and 12:20 PM played directly into the Golden Pocket — this gave me strong conviction that price was heading for new highs.
Final Thoughts
Today was a bit tricky. It required more patience and reading the tape than I would have liked. But as traders, we’ll see plenty of days like this. The key is to not overstay your welcome. Don’t force trades. Let price action finish its story before making your move.
I hope these recaps help you better understand how to use the indicators I’ve built. If you have any questions or feedback, drop a comment or DM me — I’d love to hear from you.
Thank you again for the continued support.
— TradeswithB
Gold (XAU/USD) - Bearish Reversal and Potential ContinuationPrior Uptrend: The chart clearly illustrates a strong, sustained uptrend from late September to mid-October, where the price rose consistently, making higher highs and higher lows.
Market Structure Shift (MSS): Around October 21-23, the price broke decisively below a significant previous low (the swing low marked by the MSS line, near $4,040). This event signals a likely change in market character or a Market Structure Shift, suggesting the uptrend is over and a downtrend has begun.
Impulsive Down move: Following the MSS, the price fell sharply.
Fair Value Gap (FVG): The chart highlights a Fair Value Gap (FVG), which is an area of price inefficiency created during the sharp move down. This gap acts as a potential magnet or resistance zone. The price is currently near the bottom of this FVG area (around $3,930 - $3,960).
Current Price Action and Bias: The overall sentiment is bearish following the MSS. The analysis suggests the price may retrace higher into the FVG (the dashed arrow indicates a possible move into the FVG) before continuing its move lower.
Target: The TARGET is marked by a dashed horizontal line around $3,870 - $3,880. This suggests a specific price level the analyst expects the price to reach if the bearish continuation plays out.
Interpretation
This chart suggests a bearish trading opportunity based on the recent change in trend. The immediate plan seems to be to watch for a reaction within the FVG for a potential entry to short Gold, aiming for the $3,870-$3,880 target.

US30 Intraday Plan – Bullish Bias Above 47,700 - 28/10/2025US30 has been maintaining strong bullish structure with a series of higher highs and higher lows on the lower timeframes. After breaking through the 47,700 zone, price is now retesting that area — which may act as intraday support going into the U.S. session.
📊 Scenarios:
Bullish Scenario (Primary Bias)
Watch for a pullback into the 47,730–47,700 zone — this area may serve as a liquidity grab / confirmation zone before continuation.
If support holds, potential upside targets are:
TP1 → 47,850
TP2 → 47,950
TP3 → 48,000 (psychological level & round number target)
Bearish Scenario (Alternative)
If price rejects near 47,780 and fails to hold above 47,700, we could see a deeper retracement.
Downside targets in that case:
TP1 → 47,500
TP2 → 47,350–47,300
📈 Bias: Bullish above 47,700
📉 Invalidation: Sustained break below 47,600
This plan focuses on waiting for confirmation at key levels rather than chasing momentum. Watch the first 15–30 minutes after NY open for direction confirmation — expect volatility and potential fakeouts.
