Bitcoin & Ethereum Daily Analysis|Ready for Wednesday’s Fed News📊 In today’s daily Bitcoin & Ethereum analysis, we break down the critical levels to watch before Wednesday’s Federal Funds Rate decision.
🔥 Will the Fed’s move push Bitcoin into a new uptrend — or trigger a sharp correction?
👉 Stay tuned as we explore the multi-timeframe structure, key triggers, and setups you can actually use.
Daytrading

GBP/USD Base Case for the Week Ahead (Structural View)The path of least resistance is eventually lower for Cable. Using short-term strength (e.g., from hot UK data or a weak Dollar) as opportunities to establish or add to strategic short positions for a major move lower.
For This Week: Be agile. Recognise that price action will be a battle between:
Short-Term Sterling Longs: Betting on the carry trade and a weak dollar.
Long-Term Sterling Shorts: Betting on the UK's fundamental decay..
Key Levels remain: 1.400 demand and 1.500 to 1.600 for supply. With 1.3725 and above for strategic shorts. A break below 1.400 would signal the institutional shorts have already built their book. Base case is more distribution above 1.500 and bounce from 1.400 suggests the carry trade is still in play for a little while longer.

Gold (XAUUSD) – 12 Sep | Short Setup Watching 3651 – 3657.6 POI🟡 Gold (XAUUSD) Analysis – 12 September
Market Context
• Price is currently trading around 3649, approaching our fresh M15 POI (3651 – 3657.6) .
• We have seen a recent Break of Structure (BoS) to the downside, confirming a short-term shift to bearish sentiment.
• Price has now retraced back into the POI zone, aligning with a potential short setup area.
Key Observations
• POI Zone: 3651 – 3657.6 (aligned with LH + supply zone)
• Liquidity Sweep Potential: Price might push slightly above the POI to grab liquidity before resuming the downtrend.
• Structure: Market is forming lower highs and lower lows after the BoS, reinforcing a bearish bias unless price closes decisively above the POI.
Execution Plan
• Wait for price to retest 3651 – 3657.6
• Look for M1 confirmation (micro-ChoCh / micro-BoS)
• If confirmation aligns → plan short setup with fixed risk ( SL: 40 pips | TP: 120 pips , 1:3 R:R)
• If the POI is broken → step aside and reassess deeper levels
Invalidation
A clean break and 15M candle close above 3657.6 invalidates the short idea.
Patience pays — let the market reject the POI before committing capital.
Bias for Today
📉 Bearish only. Short setups will be taken only from the POI zone with confirmation.
📘 Shared by @ChartIsMirror

EURJPY: Uptrend ContinuationSeveral observations over on the daily and H1 timeframes.
Daily Timeframe:
EMA20 remains above EMA60, which indicates uptrend from a technical standpoint.
Price is also crossing above HTL so that's no longer holding as resistance.
H1 Timeframe:
Price crosses above ATL, pulls back, and holds above breakout level.
The demand zone is subjective but price's pull-back did remain above this zone.

SPY's Final Wall: The Bearish ThesisRight now, SPY is facing the most significant confluence of resistance trend lines it has seen in years. Think of this as the ultimate ceiling—a multi-layered wall that the bulls have to smash through.
The market's parabolic move has pushed the price to this critical point. But here's the thesis: the combined strength of these converging trend lines is just too much. The buying power is exhausted.
We believe this is a classic rollover setup. Instead of a breakout to new highs, we expect a strong rejection from this level. The price will hit this solid wall of resistance and turn over, leading to a significant pullback.
The current price isn't a simple pause; it's a test of strength that the bulls are likely to fail.
Day Trade/Swing Trade Idea: Short at red arrow and cover at the green arrow

Gold (XAUUSD) – 11 Sep | Next Short POI(3643.8–3646.7) in Focus🟡 Gold (XAUUSD) Analysis – 11 September
Market Overview
Gold remains in an H4 pullback phase after making the all-time high at 3674.650 . The M15 trend is aligned to the downside and recently printed a Break of Structure (BoS) , confirming bearish continuation.
Current Market Scenario
• H4: Pullback phase active, looking for continuation lower
• M15: Bearish trend intact, recently made a new lower low (BoS)
Key POI for Today
🔹 Our next potential M15 POI for a short setup is 3643.8–3646.7 .
If price retests this zone and provides LTF confirmation (micro-ChoCh / BoS) , we will plan a short setup from here.
Execution Plan
Wait for price to retest 3643.8–3646.7
Drop to M1 for micro confirmation
If confirmation aligns, execute short with fixed risk ( SL: 40 pips | TP: 120 pips , 1:3 R:R)
If the zone fails, step aside and reassess
Patience is a position — wait for the market to give you the setup, not the other way around.
Important Note
Today’s CPI event is expected to cause high volatility.
Avoid trading during news spikes unless a very clear, high-probability setup forms.
Bias for Today
📉 Bearish only . All setups will be taken from M15 POI with confirmation.
📘 Shared by @ChartIsMirror

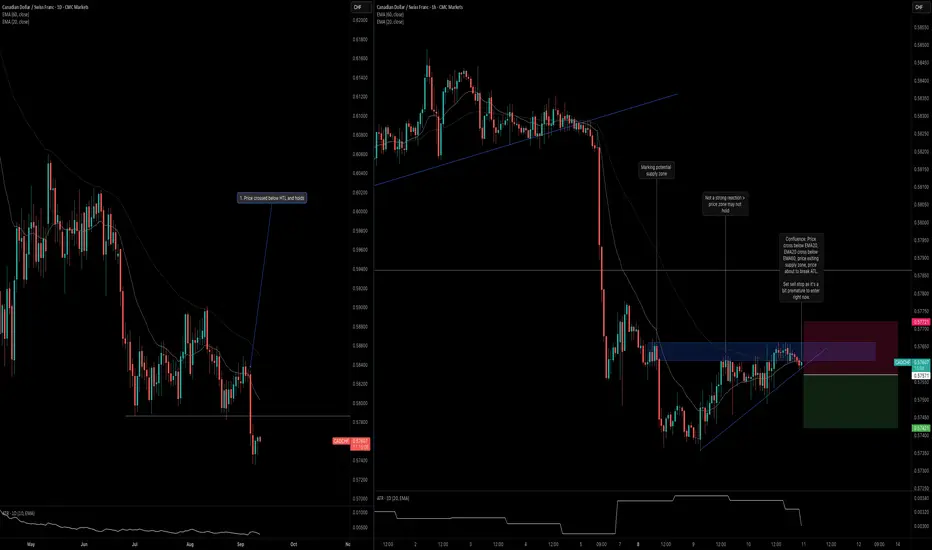
CADCHF: Trend Continues Below Daily LevelCADCHF is beginning to show confluence, which gives me an opportunity to frame my entry opportunity. Here are the key observations across the daily and H1 timeframes.
Daily Timeframe:
Price made a strong break below the HTL and is holding below it.
Although two bullish bar formed, they did not engulf the previous bearish bar, which is a good indication that buying strengh just isn't there.
H1 Timeframe:
There's quite a bit of confluence on the H1 timeframe with the first being price entering and exiting the potential supply zone.
In addition, price is about to cross below the ATL, which is another sign that the counter-trend move is ending.
Finally, there's confluence with the moving averages where EMA20 is crossing below EMA60; price is also beginning to cross below EMA20.
Sep 10 MES Recap: Watching MAG7, Session Highs/Lows, and Higher MES Journal – September 10, 2025
Today I traded MES using supply and demand levels, while also tracking leadership from the MAG7 (with QQQ as my main proxy).
Track the MAG7 with me on TradingView using the MAG7
List .
I didn’t trade with this strategy until a few guys in my Discord recommended it. I had a bit of a learning curve, but I finished green on most accounts for the first time in a while.
Context I Tracked
Asian session high/low: 6,514 / 6,492
London session high/low: 6,528 / 6,506
Previous day high/low: 6,536.25 / 6,489.25
PPI report (Aug 2025): -0.1% vs forecast, shifted bias from bullish to bearish intraday
VWAP levels on both ES and QQQ
Wins
Stayed green overall on funded accounts with payout potential.
Saw the end-of-day pump confirmed by MAG7, even after an initial retrace.
Reinforced my supply/demand and VWAP process.
Losses and Lessons Learned
Entered one trade without higher timeframe confirmation, which cost me a FundingTicks eval account (treating this loss as tuition).
Learned that higher timeframes (1H/4H/Daily) must confirm intraday levels before entering.
Looking Forward
I’ll combine:
Supply/Demand + Session Highs/Lows
Leader ETF (QQQ/MGK/MAG7)
Higher Timeframes (1H/4H/Daily)
This approach gives me more conviction and fewer blind trades.
Indicators
Since I’m still learning how to mark levels properly, I’m starting out with indicators to help reinforce that I’m using potentially correct levels. I primarily used:
Asian
& London Sessions High/Lows
Previous
Highs & Lows
Supply
and Demand Visible Range
TradingView default VWAP indicator

TSLA (daytrading) 2 plan for itPlan 2 could be possible because:
(p1 price is on sma 50 d1,p2 could be sma 200)
TSLA still has a small gap below that might need to be filled.
This week doesn’t look good for the overall market.
I will continue to watch it closely

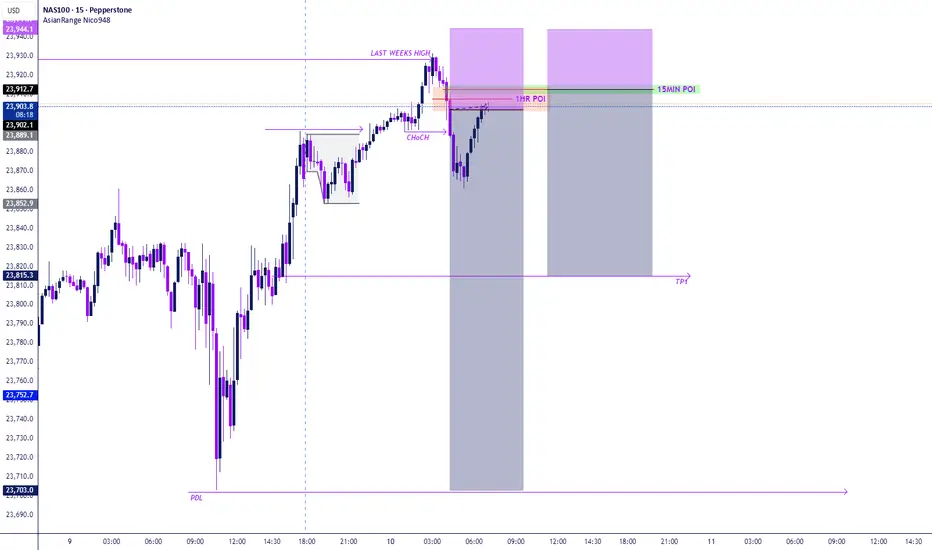
NAS100 – Liquidity Sweep & Short Setup (1H + 15M Scaling)After an aggressive bullish run, NAS100 swept last week’s high and immediately shifted structure (ChoCH).
This confirms external liquidity has been taken and market sentiment is turning bearish.
🔎 Trade Narrative
1. Liquidity Sweep → Last week’s high taken.
2. ChoCH → Order flow shifted bearish after sweep.
3. POIs in Play:
1H Supply Zone → First entry short (early exposure, confirmation).
15M Refined POI → Sell limit placed (precision scaling inside the 1H zone).
4. Target → Previous Day’s Low (PDL) as the next liquidity pool.
📐 Execution Plan
Entry 1: Short from 1H POI ✅
Entry 2: Sell limit at refined 15M POI ✅
Stop Loss: Above 1H supply sweep candle.
Take Profit: Previous Day’s Low (PDL).
Risk Management: Total risk capped at 1% across both entries.
🧠 Institutional Logic
Scaling entries across HTF + LTF zones provides:
Higher TF confirmation ✅
Lower TF precision ✅
Blended entry for better RR ✅
⚖️ Bias: Bearish
Targeting PDL unless price structure shifts bullish again.
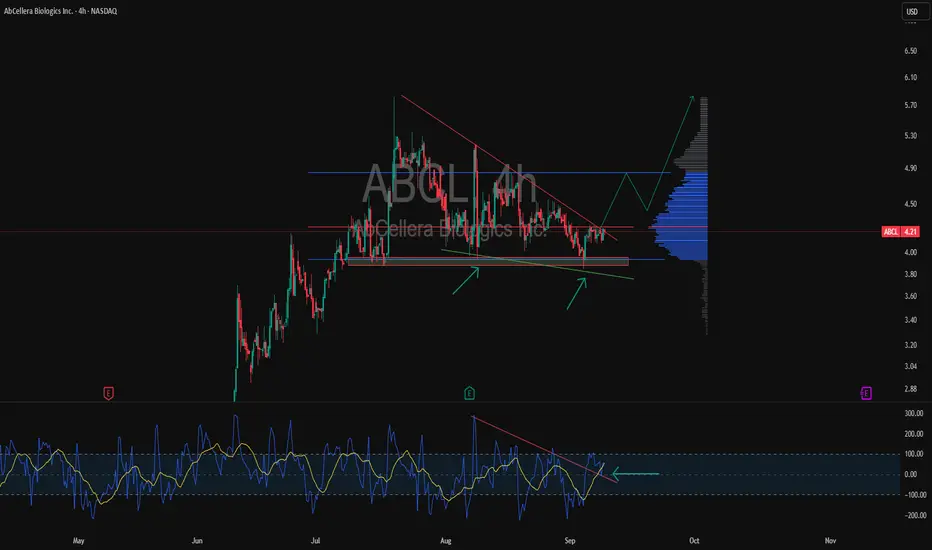
ABCL 4H support test and triangleAbCellera Biologics stock is trading inside a triangle pattern and testing the key support at 3.90–4.00.
Signals are showing that sellers are losing momentum: CCI prints a bullish divergence and the volume profile highlights accumulation above the current level. A breakout above the descending trendline around 4.30 could open the way towards 4.80 and even 5.60.
From a fundamental perspective the company remains an important biotech player focusing on antibody-based drug development. The sector is highly news driven and any announcement on trials or partnerships could trigger sharp moves.
As long as support holds buyers keep the advantage and the market looks like a spring that has been compressed too long and is ready to release.
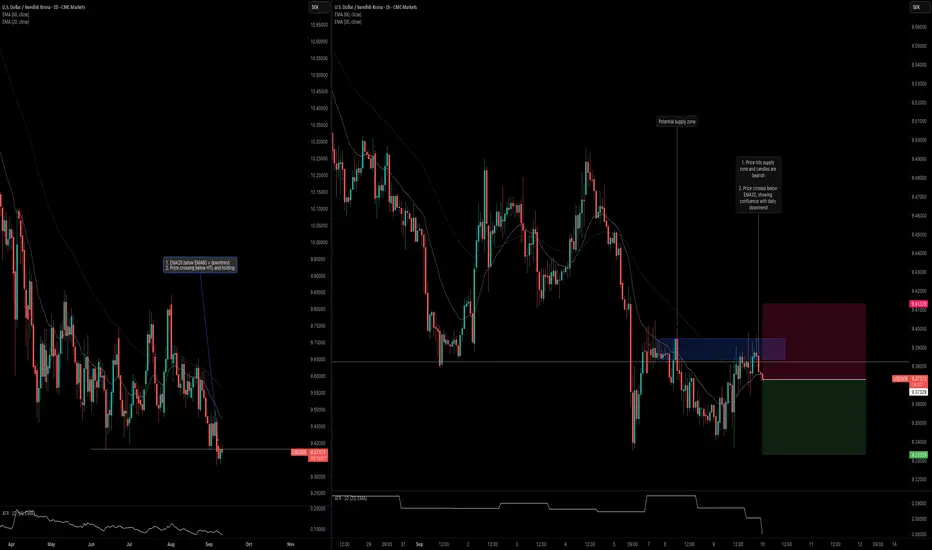
USDSEK: Trend ContinuationUSDSEK is one of the latest pairs to break below a key daily level. Here's my analysis on both the daily and intraday timeframes.
Daily Timeframe:
EMA20 is below EMA60, which indicates that this is a downtrend.
Price crossed below the horizontal trend line (HTL) and then a bullish bar formed that remain below the HTL.
H1 Timeframe:
Price entered a supply zone, and seemed to hold below it.
Price also crossed back below the EMA20, signaling confluence with the overall daily downtrend.
BTCUSD Testing 112,700 Resistance – Breakout or Rejection Ahead?🚀📊 BTCUSD Testing 112,700 Resistance – Breakout or Rejection Ahead? 🔍💡
Hey Traders! Kiri here, the FX Professor 🙌 It’s been a while, but I’m back with fresh charts and levels for you. Let’s dive straight in:
🔹 Bitcoin is still holding within an ascending formation. Despite losing parts of the channel earlier, price never tested the big lower support. Instead, it rebounded strongly and is now consolidating in the mid-range.
🔹 The key battleground today is 112,700 – a strong mid-channel support/resistance zone that also aligns with my Fibonacci levels. We’ve already seen rejection here, so it’s the level to watch.
📈 Bullish Scenario:
If BTC breaks and holds above 112,682 – 112,700 , we could see momentum pushing price toward 113,000+.
📉 Bearish Scenario:
Rejection at this zone brings downside targets at 112,250 and further down at 111,613 .
Remember, September has historically been a tricky month for Bitcoin – lots of games between the big and small players. That’s why risk management is everything!
🔥 Ethereum also looks strong, holding support at 4,275 with upside targets at 4,881 and 6,433 still in play. (chart/post will follow).
For now, I’m trading the levels, taking profits quickly, and letting Fibonacci guide the way. 🎯
One Love,
The FXPROFESSOR 💙
Disclosure: I am happy to be a HUMAN and as an AI-dev let me tell you this: AI will NEVER be able to come close to Human power: no feelings, no thinking, no intuition, no soul. YOU, my fellow human are the biggest strongest piece of Code. You are the best blockchain, your kids, your work, your hobbies, your pets and your Wisdom are the best Altcoins. Remember to live with Love and respect for yourself and for others.🌟🤝📈

USDSEK: Trend ContinuationUSDSEK looks to resume its downtrend. This is observable based on the daily and 1-hour timeframe confluence.
Daily Timeframe:
Starting on the daily timeframe, EMA20 rests below EMA60, with price hovering below EMA20. This indicates that the overall trend is down.
In addition, price recently made a clean break below the horizontal trendline (HTL). It then tried to trade above it with no success.
1-Hour Timeframe:
Over on the lower timeframe, we see confluence as well. Price crosses below the ascending trendline, which indicates the overall trend is resuming. There's alignment on the daily and 1-hour timeframes.
My entry is based on the consolidating range that formed after the price pullback. Price is now breaking out of this range, which signals that momentum is picking up.

Gold Plan - Market awaits JOLTS, gold holds safe-haven role⚓️ Captain Vincent
US–Venezuela tensions push gold into safe-haven spotlight
1. News Waves 🌍
U.S. Secretary of State Marco Rubio confirmed: American forces attacked a drug vessel originating from Venezuela, as Washington steps up pressure on Maduro’s government.
Earlier, Trump placed a $50 million bounty to force Venezuela’s president out of power, while deploying military forces closer to the Caribbean.
👉 These moves have fueled fears of regional conflict, and gold was immediately chosen by big money as a safe-haven. This morning’s rally clearly reflected defensive flows rushing back into GOLD.
📌 Note – 21:00 (03/09): JOLTS Job Openings report – a key gauge of U.S. labor health. If weaker than expected → USD under pressure, gold has room to accelerate.
2. Technical Outlook ⚙️
H1 Chart: gold continues forming bullish BOS , confirming the uptrend.
Golden Harbor 🏝️ (Buy Zone 3,478 – 3,480): overlapping major Order Block, strong support for pullbacks.
Storm Breaker 🌊 (Sell Zone 3,577 – 3,579): near 1.618 fib extension, potential resistance with profit-taking pressure.
Captain’s Shield 🛡️ (Support): 3,528 – 3,507
Captain’s Wall 🧱 (Resistance): 3,562 – 3,585
3. Captain Vincent’s Map – Trade Scenarios 🪙
🔺 Golden Harbor 🏝️ (BUY Zone – Priority)
Entry: 3,478 – 3,480
SL: 3,470
TP: 3,483 → 3,486 → 3,489 → 349x → 35xx
🔻 Storm Breaker 🌊 (SELL Reaction at Resistance)
Entry: 3,577 – 3,579
SL: 3,586
TP: 3,573 → 3,570 → 3,567 → 3,560 → 35xx
4. Captain’s Note ⚓
“The gold sea is stirred by U.S.–Venezuela political winds 🌊. The ship has anchored at Golden Harbor 🏝️ and is now steering toward Storm Breaker 🌊 3577 . But remember: before big waves, wise sailors always time their departure at the right harbor.”

BTCUSD DAY TRADING SETUP (CAFX)"This is how I am currently analyzing BTCUSD. I’m paying close attention to the overall market structure, key support and resistance zones, and recent price action to determine where the next move might unfold. I’ll be watching for potential breakout opportunities, liquidity grabs, and retests around major levels to confirm my bias. Keep in mind, this is simply my personal outlook and not financial advice — always do your own analysis before making trading decisions."

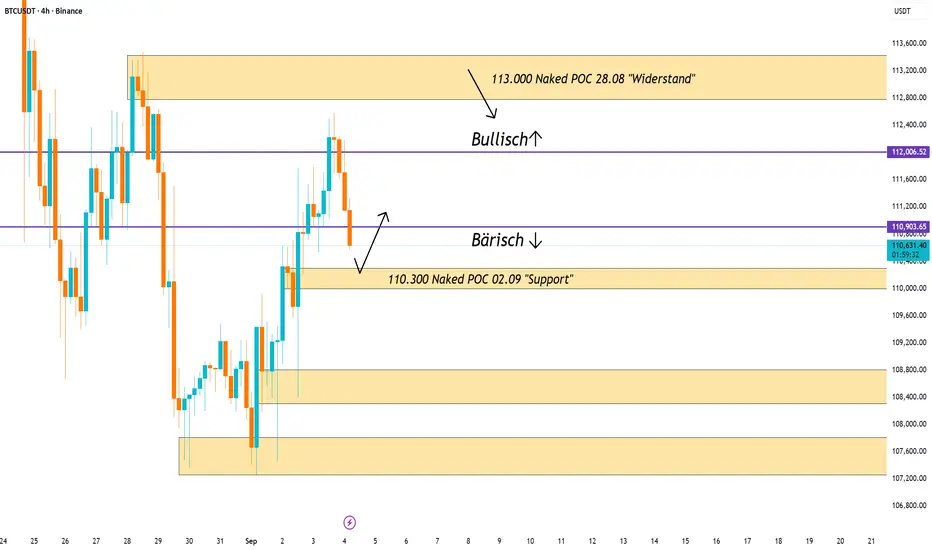
Bitcoin in the decisionBitcoin opened bearish today, and this outlook remains as long as we trade below 110,900.
At 110,300 we still have a naked POC from September 2nd, which should act as support. Since this level often acts like a magnet, I expect we might revisit it. It is important that this level holds – otherwise, a quick move down toward 108,600 could follow, which I see as the next real support.
If we somehow manage to reclaim 112,000, the picture flips back to bullish. In that case, a test of the naked POC at 113,000 would be the target, where I expect strong rejection.
EURJPY: FakeoutEURJPY is currently undergoing an interesting transition. While the EMAs indicate that this pair is in an uptrend (where EMA20 is above EMA60), there's early indication that we might be seeing a downtrend soon.
Daily Timeframe:
Price attempted to cross above the daily level, but it failed to close above it. It's also a lower high after a strong run-up, which indicates to me that the upside momentum might be exhausting.
H1 Timeframe:
We see an intraday double top formation, which indicates that price is having a hard time pushing higher. Price also crossed below the intraday neckline.
While it tried to pull back above the intraday neckline, it quickly reverted below, indicating quite a bit of selling pressure.

EURAUD: Ascending Trendline BreakThis is a counter-trend trade as I see exhaustion on the daily timeframe.
Daily Timeframe:
I plotted an ascending trendline on the daily timeframe. Price attempted to push to a new high on August 20th, but failed to hold. That was the first indication that the uptrend might be over.
The signal occurred when price crossed below the ascending trendline. Currently, the daily bar is active. If the current bar manages to close below the ascending trendline and tomorrow's daily bar does the same, it's safe to say that we can expect further downside.
H4 Timeframe
The bearish signal is also supported on the 4-hour timeframe. In the intraday timeframe, price made a "double top" indicating that it's not able to push higher to the upside. I'm anticipating that momentum will build up throughout the rest of the day and into tomorrow as well.
GBPUSD | PDL Sweep → Bullish Swing into PDH LiquidityThis setup is a textbook liquidity play: PDL sweep + CHoCH + refined demand POI. Targeting PDH liquidity next.
📍 Setup Context:
- Price swept the Previous Day Low (PDL), confirming a liquidity grab.
- A CHoCH has formed, signaling bullish intent.
- Refined POI (1H Demand Zone aligned with 15m FVG) gives a clean entry zone.
📊 Trade Plan:
- Entry: Buy limit inside refined POI
- Stop Loss: Below swept PDL (invalidation if daily close returns below)
- Take Profit 1: 1:2R (partial 50%)
- Take Profit 2: Previous Day High (PDH liquidity run)
- Take Profit 3 (extended): Daily imbalance above PDH
NOTE: You can still scale down to 5 minutes for a more refined entry..

TSLA (daytrading) small tradeI already entered but didn’t post earlier because I was too busy. You guys can wait for a small pullback tomorrow. Take profit whenever you feel comfortable.
1. Bullish doji candle on the daily (D1).
2. Uptrend still intact on D1 and higher timeframes.
3. Retest of the 50 SMA on D1.
4. Price touched the trendline.
Plan: Buy call options at the closest strike price with expiry this week. Don’t forget to set a stop loss.

EURGBP should fall to 0.85The Euro/Pound is showing considerable weakness on the 4h timeframe. We are currently rejecting out of the anchored VWAP channel. A close above the channel would invalidate the trade.

CaptainVincent | Gold in a tug-of-war amid new geopolitical bloc1. News Waves 🌍
At a 2-day summit in Shanghai, Prime Minister Modi and President Xi Jinping announced that India and China will become development partners instead of rivals.
The summit also included Russia and four Central Asian countries, aiming to establish a Global South bloc to counterbalance the U.S. and the West.
👉 This highlights a geopolitical power shift, raising concerns over global polarization → gold maintains its safe-haven appeal.
2. Technical Outlook ⚙️
On the H2 chart, gold has printed Higher Highs after its recent strong breakout.
Storm Breaker 🌊 (Sell Zone 3511 – 3518): strong resistance, potential supply if retested.
Golden Harbor 🏝️ (Buy Zone 3450 – 3448): confluence of FVG + Fibonacci 0.5/0.618 , key support for a rebound.
Main trend: gold may continue ranging within 3450 – 3510 before choosing a major direction.
3. Captain Vincent’s Map – Trade Scenarios 🪙
🔻 Storm Breaker 🌊 (SELL Reaction)
Entry: 3511 – 3508
SL: 3518
TP: 3505 → 3500 → 3497 → 349x → 348x
🏝️ Golden Harbor (BUY Zone – strong support)
Entry: 3450 – 3448
SL: 3440
TP: 3453 → 3456 → 3459 → 3462 → 346x
4. Captain’s Note ⚓
“Political news continues to stir the gold sea 🌊. Bears are waiting at Storm Breaker 3511 , but the safe harbor remains Golden Harbor 3450 – 3448 . In an unpredictable environment, prioritize short-term SELL setups to ride with safe-haven flows, instead of recklessly challenging the rough waves.”
