Why this strategy works so well (Ticker Pulse Meter + Fear EKG) Disclaimer: This is for educational purposes only. I am not a financial advisor, and this is not financial advice. Consult a professional before investing real money. I strongly encourage paper trading to test any strategy.
The Ticker Pulse + Fear EKG Strategy is a long-term, dip-buying investment approach that balances market momentum with emotional sentiment. It integrates two key components:
Ticker Pulse: Tracks momentum using dual-range metrics to pinpoint precise entry and exit points.
Fear EKG: Identifies spikes in market fear to highlight potential reversal opportunities.
Optimized for the daily timeframe, this strategy also performs well on weekly or monthly charts, making it ideal for dollar-cost averaging or trend-following with confidence. Visual cues—such as green and orange dots, heatmap backgrounds, and SMA/Bollinger Bands—provide clear signals and context. The strategy’s default settings are user-friendly, requiring minimal adjustments.
Green dots indicate high-confidence entry signals and do not repaint.
Orange dots (Fear EKG entries), paired with a red “fear” heatmap background, signal opportunities to accumulate shares during peak fear and market sell-offs.
Now on the the educational part that is most fascinating.
Load XLK on your chart and add a secondary line by plotting the following on a secondary axis:
INDEX:SKFI + INDEX:SKTH / 2
Now, you should see something like this:
Focus on the INDEX:SKFI + INDEX:SKTH / 2 line, noting its dips and spikes. Compare these movements to XLK’s price action and the corresponding dot signals:
Green and Orange Dots: Opportunities to scale into long positions.
Red Dots: Opportunities to start scaling out of positions.
This concept applies not only to XLK but also to major stocks within a sector, such as AAPL, a significant component of XLK. Chart AAPL against INDEX:SKFI + INDEX:SKTH / 2 to observe how stock and sector indices influence each other.
Now, you should see something like this:
Long-Term Investing Considerations
By default, the strategy suggests exiting 50% of open positions at each red dot. However, as long-term investors, there’s no need to follow this rule strictly. Instead, consider holding positions until they are profitable, especially when dollar-cost averaging for future retirement.
In prolonged bear markets, such as 2022, stocks like META experienced significant declines. Selling 50% of positions on early red dots may have locked in losses. For disciplined long-term investors, holding all open positions through market recoveries can lead to profitable outcomes.
The Importance of Context
Successful trading hinges on context. For example, using a long-term Linear Regression Channel (LRC) and buying green or orange dots below the channel’s point-of-control (red line) significantly improves the likelihood of success. Compare this to buying dots above the point-of-control, where outcomes are less favorable.
Why This Strategy Works
The Ticker Pulse + Fear EKG Strategy excels at identifying market dips and tops by combining momentum and sentiment analysis. I hope this explanation clarifies its value and empowers you to explore its potential through paper trading.
Anyway, I thought I would make a post to help explain why the strategy is so good at identifying the dips and the tops. Hope you found this write up as educational.
The strategy:
The Companion Indicator:
DCA

Buying The Dip / Dollar Cost AveragingI recently published my first script and felt now would be a good time to share something I feel could help some people out. I have been trading since 2021 and it has been an amazing journey. Anyhow, I would consider myself a value based investor and in it for the long term.
So as the market takes a dip - now is certainly the time to be buying the dip or dollar cost averaging. The way I see it, if you are going to DCA/Buy The Dip, it might be handy to have access to a tool that is slightly better than just regularly timed investments.
Take a look at my indicator and let me know your thoughts.
Comment, Like and Follow if you enjoy the strategy and companion indicator.

OptionsMastery: A break and retest on MO!🔉Sound on!🔉
📣Make sure to watch fullscreen!📣
Thank you as always for watching my videos. I hope that you learned something very educational! Please feel free to like, share, and comment on this post. Remember only risk what you are willing to lose. Trading is very risky but it can change your life!

$AVAX: Avalanche – Snowballing Gains or Melting Away?(1/9)
Good evening, everyone! 🌙 CRYPTOCAP:AVAX : Avalanche – Snowballing Gains or Melting Away?
With AVAX at $23.07, is this blockchain beast a sleeper hit or a slippery slope? Let’s avalanche into it! 🔍
(2/9) – PRICE PERFORMANCE 📊
• Current Price: $ 23.07 as of Mar 25, 2025 💰
• Recent Move: Up from $18, below $40 highs, per data 📏
• Sector Trend: Crypto volatile, AVAX rides the waves 🌟
It’s a rollercoaster—hold tight for the drop! ⚙️
(3/9) – MARKET POSITION 📈
• Market Cap: Approx $9.56B (414.78M tokens) 🏆
• Operations: Scalable L1 for DeFi, dApps, subnets ⏰
• Trend: $1.121B DeFi TVL, whale buys, per posts on X 🎯
Firm in L1 race, but market’s a blizzard! 🚀
(4/9) – KEY DEVELOPMENTS 🔑
• Whale Action: 500K tokens moved, per posts on X 🌍
• DeFi Strength: $1.121B TVL holds firm, per data 📋
• Market Vibe: Bearish Fear Index (34), yet resilient 💡
Snowballing quietly amid crypto storms! ❄️
(5/9) – RISKS IN FOCUS ⚡
• Market Correction: Bearish pressure could sink it 🔍
• Competition: Solana, Ethereum vie for dApps 📉
• Macro Woes: Trade tensions, rates shake things ❄️
It’s a chilly slope—brace for ice! 🛑
(6/9) – SWOT: STRENGTHS 💪
• Scalability: 4,500 TPS, beats rivals 🥇
• DeFi Base: $1.121B TVL, solid ecosystem 📊
• Adoption: Enterprise use grows, per data 🔧
Got a snowy peak of potential! 🏔️
(7/9) – SWOT: WEAKNESSES & OPPORTUNITIES ⚖️
• Weaknesses: Volatility, high off $59 peak 📉
• Opportunities: Whale buys, subnet growth 📈
Can it snowball or melt under pressure? 🤔
(8/9) – POLL TIME! 📢
AVAX at $23.07—your take? 🗳️
• Bullish: $30+ soon, whales fuel it 🐂
• Neutral: Steady, risks balance out ⚖️
• Bearish: $18 looms, correction hits 🐻
Chime in below! 👇
(9/9) – FINAL TAKEAWAY 🎯
AVAX’s $23.07 price tags a volatile gem 📈, with DeFi strength but market risks 🌿. Dips are our DCA jackpot 💰—buy low, ride high! Gem or bust?

CAKEUSDT (PancakeSwap): Sweet Gains or Stale Trade?(1/9)
Good afternoon, everyone! ☀️ CAKEUSDT (PancakeSwap): Sweet Gains or Stale Trade?
With CAKE at $2.599, is this DEX token a tasty treat or a flat pancake? Let’s flip the details! 🔍
(2/9) – PRICE PERFORMANCE 📊
• Current Price: $ 2.599 as of Mar 25, 2025 💰
• Recent Move: Consolidating $2.6-$2.8, up from $2.34, per data 📏
• Sector Trend: Crypto steady, DeFi mixed amid trade tensions 🌟
It’s a flip-flop—value might be cookin’! ⚙️
(3/9) – MARKET POSITION 📈
• Market Cap: Approx $760M (292M circulating) 🏆
• Operations: Leading BNB Chain DEX, yield farming, staking ⏰
• Trend: Deflationary model burns 102% minted, per data 🎯
Firm in DeFi, but volatility’s the spice! 🚀
(4/9) – KEY DEVELOPMENTS 🔑
• Recent Surge: Up 45% earlier in March, per X posts 🌍
• Platform Updates: Expanded NFT marketplace, per web data 📋
• Market Reaction: High volume ($230M daily), showing interest 💡
Adapting to DeFi trends, cooking up growth! 🍳
(5/9) – RISKS IN FOCUS ⚡
• Regulatory Risks: Crypto scrutiny could hit DEXs 🔍
• Market Volatility: Crypto swings could drag price down 📉
• Competition: Other DEXs like Uniswap challenge, per data ❄️
It’s a risky recipe—watch the heat! 🛑
(6/9) – SWOT: STRENGTHS 💪
• DEX Leader: Top on BNB Chain, strong user base 🥇
• Deflationary Model: Burns tokens, potentially boosts value 📊
• High Volume: $230M daily, per data, shows activity 🔧
Got a sweet spot in DeFi! 🏦
(7/9) – SWOT: WEAKNESSES & OPPORTUNITIES ⚖️
• Weaknesses: Price volatility, regulatory fears 📉
• Opportunities: DeFi adoption, new features like lending 📈
Can it rise or get burned? 🤔
(8/9) – POLL TIME! 📢
CAKE at $2.599—your take? 🗳️
• Bullish: $3+ soon, DeFi booms 🐂
• Neutral: Steady, risks balance gains ⚖️
• Bearish: $2 drops, market sours 🐻
Chime in below! 👇
(9/9) – FINAL TAKEAWAY 🎯
CAKE’s $2.599 price reflects consolidation, with strengths in its platform and deflationary model, but risks from market volatility and competition persist. DCA-on-dips could be a strategy to average in over time, banking on long-term growth. Gem or bust?

$XAUUSD (Gold): Golden Rally or Gilded Pause?(1/9)
Good morning, everyone! ☀️ XAUUSD (Gold): Golden Rally or Gilded Pause?
With gold at $3,020.82, is this safe-haven surge a treasure or a tease? Let’s sift through the shine! 🔍
(2/9) – PRICE PERFORMANCE 📊
• Current Price: $ 3,020.82 per ounce as of Mar 25, 2025 💰
• Recent Move: Near $3,057 high from Mar 20, per data 📏
• Sector Trend: Precious metals up on tension, per posts on X 🌟
It’s a golden glow—let’s see if it holds! ⚙️
(3/9) – MARKET POSITION 📈
• Global Role: Top safe-haven asset ⏰
• Drivers: Central bank buying, geopolitical risks 🎯
• Trend: Bullish near $3,000, per data 🚀
Firm as a refuge, shining in uncertainty! 🏦
(4/9) – KEY DEVELOPMENTS 🔑
• Geopolitical Boost: Trade tensions linger, per data 🌍
• U.S. Data: PMI strength supports USD, caps gold, per posts on X 📋
• Market Reaction: Consolidating near $3,020-$3,030 💡
Simmering in a tense market! 🌩️
(5/9) – RISKS IN FOCUS ⚡
• Profit-Taking: Post-$3,000 sales loom 🔍
• U.S. Rates: Policy shifts could hit, per data 📉
• Oil Prices: CAD link affects broader forex ❄️
It’s a shiny tightrope—watch your step! 🛑
(6/9) – SWOT: STRENGTHS 💪
• Safe Haven: Thrives in chaos, per posts on X 🥇
• Central Banks: Steady buying props it up 📊
• Green Demand: Key in renewables, per data 🔧
Got a golden backbone! 🌟
(7/9) – SWOT: WEAKNESSES & OPPORTUNITIES ⚖️
• Weaknesses: Volatility from profit-taking 📉
• Opportunities: More tensions, rate cuts 📈
Can it gleam higher or dim out? 🤔
(8/9) – POLL TIME! 📢
Gold at $3,020.82—your take? 🗳️
• Bullish: $3,100+ soon, rally rolls 🐂
• Neutral: Steady, risks balance out ⚖️
• Bearish: $2,950 looms, correction hits 🐻
Chime in below! 👇
(9/9) – FINAL TAKEAWAY 🎯
Gold’s $3,020.82 price tags a safe-haven rally 📈, but volatility’s in the mix 🌿. Dips are our DCA jackpot 💰—buy low, ride high! Gem or bust?

Dow Jones Industrial Average ($US30): Market Mover or Stumbling?(1/9)
Good afternoon, everyone! ☀️ Dow Jones Industrial Average ( BLACKBULL:US30 ): Market Mover or Stumbling Block?
With the Dow at $42,407.80, is this blue-chip index a steady climber or a shaky step? Let’s chart the course! 🔍
(2/9) – PRICE PERFORMANCE 📊
• Current Price: $ 42,407.80 as of Mar 24, 2025 💰
• Recent Move: Up 0.8% from $41,985.35 on Mar 21, per data 📏
• Sector Trend: Mixed with tech, aerospace gains 🌟
It’s a bumpy climb—let’s see what’s driving it! ⚙️
(3/9) – MARKET POSITION 📈
• Composition: 30 U.S. blue-chip firms, all sectors but transport, utilities 🏆
• Trend: Volatile but up 1.2% weekly as of Mar 21, per data ⏰
• Sentiment: Cautious optimism amid trade tensions 🎯
Firm but tested by macro winds! 📊
(4/9) – KEY DEVELOPMENTS 🔑
• Fed Update: Rates steady, economic uncertainty up, per data 🌍
• Sector Gains: Boeing up 7% on Air Force deal, per data 📋
• Market Reaction: Dow up after tariff reprieve hopes 💡
Navigating a stormy market! 🌪️
(5/9) – RISKS IN FOCUS ⚡
• Trade Tensions: U.S.-China tariffs spark inflation fears 🔍
• Economic Slowdown: Consumer sentiment at 2022 lows 📉
• Policy Shifts: Trump tariffs add uncertainty ❄️
It’s a rocky path—watch the curves! 🛑
(6/9) – SWOT: STRENGTHS 💪
• Blue-Chip Base: 30 industry leaders 🥇
• Sector Gains: Tech, aerospace lift index 📊
• Resilience: Up 12.7% from 52-week low 🔧
Got a sturdy engine under the hood! 🏦
(7/9) – SWOT: WEAKNESSES & OPPORTUNITIES ⚖️
• Weaknesses: Volatility, 5.9% off peak 📉
• Opportunities: Rate cut hopes, tech rebound 📈
Can it climb higher or stall out? 🤔
(8/9) – POLL TIME! 📢
Dow at $42,407.80—your take? 🗳️
• Bullish: $44,000+ soon, rally resumes 🐂
• Neutral: Steady, risks balance out ⚖️
• Bearish: $40,000 looms, correction deepens 🐻
Chime in below! 👇
(9/9) – FINAL TAKEAWAY 🎯
Dow’s $42,407.80 price shows cautious gains 📈, but volatility’s in the air 🌿. Dips are our DCA fuel 💰—buy low, ride high! Gem or bust?

Fri 21st Mar 2025 EUR/USD Daily Forex Chart Sell SetupGood morning fellow traders. On my Daily Forex charts using the High Probability & Divergence trading methods from my books, I have identified a new trade setup this morning. As usual, you can read my notes on the chart for my thoughts on this setup. The trade being a EUR/USD Sell. Enjoy the day all. Cheers. Jim

$NKE: Nike – Sprinting to Gains or Stumbling?(1/9)
Good evening, everyone! 🌙 NYSE:NKE : Nike – Sprinting to Gains or Stumbling?
With NKE at $73 ahead of Q3 earnings, is this sportswear giant ready to run or tripping up? Let’s lace up and find out! 🔍
(2/9) – PRICE PERFORMANCE 📊
• Current Price: $ 73 as of Mar 19, 2025 💰
• Recent Move: Down from $102.49 high, above $68.63 low, per data 📏
• Sector Trend: Footwear sector volatile with trade tensions 🌟
It’s a rocky track—value might be in stride! ⚙️
(3/9) – MARKET POSITION 📈
• Market Cap: Approx $116B (web ID: 15) 🏆
• Operations: Global leader in footwear, apparel ⏰
• Trend: Strong brand, innovation focus, per data 🎯
Firm in sportswear, but facing headwinds! 🏃♂️
(4/9) – KEY DEVELOPMENTS 🔑
• Q3 FY2025 Earnings: Due Mar 20, $11.02B revenue expected, per data 🌍
• Market Sentiment: Bearish short-term, per posts on X 📋
• Price Action: Down 9.78% in 10 days, per data 💡
Racing toward earnings with caution! 🏁
(5/9) – RISKS IN FOCUS ⚡
• Trade Tensions: U.S.-China tariffs hit margins, per data 🔍
• Economic Slowdown: Consumer spending at risk 📉
• Competition: Adidas, Skims gaining ground ❄️
It’s a tough race—watch the pace! 🛑
(6/9) – SWOT: STRENGTHS 💪
• Brand Power: Global sportswear leader 🥇
• Innovation: NikeSKIMS, new products, per data 📊
• Dividend: 2.03% yield draws income fans 🔧
Got the gear to win! 🏀
(7/9) – SWOT: WEAKNESSES & OPPORTUNITIES ⚖️
• Weaknesses: Bearish sentiment, volatility 📉
• Opportunities: Q3 earnings beat, tech rebound 📈
Can it jump the hurdles or stumble? 🤔
(8/9) – POLL TIME! 📢
NKE at $73 your take? 🗳️
• Bullish: $85+ soon, earnings spark 🐂
• Neutral: Steady, risks balance out ⚖️
• Bearish: $65 looms, market slips 🐻
Chime in below! 👇
(9/9) – FINAL TAKEAWAY 🎯
NKE’s $73 price tags a volatile sportswear play 📈, but brand strength keeps it in the race 🌿. Dips are our DCA sweet spot 💰—buy low, run high! Gem or bust?

$BAJAJAUTO: Bajaj Auto – Wheeling to Wealth or Spinning Out?(1/9)
Good afternoon, everyone! ☀️ $BAJAJAUTO: Bajaj Auto – Wheeling to Wealth or Spinning Out?
With BAJAJAUTO at ₹7,711.25 post-CEO nod and ₹1,500 crore boost, is this two-wheeler titan revving up or stalling? Let’s ride into it! 🔍
(2/9) – PRICE PERFORMANCE 📊
• Current Price: $ 7,711.25 as of Mar 19, 2025 💰
• Recent Move: Up 1.64% on news, below $12,774 high, per data 📏
• Sector Trend: Auto sector steady, with two-wheeler demand in focus 🌟
It’s a smooth ride—value might be in gear! ⚙️
(3/9) – MARKET POSITION 📈
• Market Cap: Approx ₹2.12 lakh crore (web ID: 6) 🏆
• Operations: Two-wheelers, financing via subsidiary ⏰
• Trend: Leadership stability, credit growth, per data 🎯
Firm in its lane, with expansion in sight! 🚴♂️
(4/9) – KEY DEVELOPMENTS 🔑
• CEO Re-appointment: Rajiv Bajaj for 5 yrs from Apr 1, per data 🌍
• Investment: ₹1,500 crore into Bajaj Auto Credit Ltd., per data 📋
• Market Reaction: Stock up, signaling confidence 💡
Revving up leadership and capital! 🛵
(5/9) – RISKS IN FOCUS ⚡
• Market Volatility: Trade tensions, economic shifts 🔍
• Competition: Hero MotoCorp, TVS pressure sales 📉
• Rates: Rising costs could hit demand ❄️
It’s a twisty road—watch the turns! 🛑
(6/9) – SWOT: STRENGTHS 💪
• Brand Power: Two-wheeler leader in India 🥇
• Subsidiary Growth: Credit arm expansion, per data 📊
• Dividend: Steady payouts attract income fans 🔧
Got horsepower to spare! 🏍️
(7/9) – SWOT: WEAKNESSES & OPPORTUNITIES ⚖️
• Weaknesses: Below peak, macro risks 📉
• Opportunities: Two-wheeler demand, financing growth 📈
Can it accelerate or hit a bump? 🤔
(8/9) – POLL TIME! 📢
BAJAJAUTO at ₹7,711.25—your take? 🗳️
• Bullish: ₹9,000+ soon, growth kicks in 🐂
• Neutral: Steady, risks balance out ⚖️
• Bearish: ₹7,000 looms, market stalls 🐻
Chime in below! 👇
(9/9) – FINAL TAKEAWAY 🎯
BAJAJAUTO’s ₹7,711.25 price reflects confidence 📈, but volatility’s in the air 🌿. Dips are our DCA fuel 💰—buy low, ride high! Gem or bust?

Behind the DCA Strategy: What It Is and How It WorksWho invented the Dollar Cost Averaging (DCA) investment strategy?
The concept of Dollar Cost Averaging (DCA) was formalized and popularized by economists and investors throughout the 20th century, particularly with the growth of the U.S. stock market. One of the first to promote this strategy was Benjamin Graham , considered the father of value investing and author of the famous book The Intelligent Investor (published in 1949). Graham highlighted how DCA could help reduce the risk of buying assets at excessively high prices and improve investor discipline.
When and How Did Dollar Cost Averaging Originate?
The concept of DCA began to take shape in the early decades of the 20th century when financial institutions introduced automatic purchase programs for savers. However, it gained popularity among retail investors in the 1950s and 1960s with the rise of mutual funds.
Overview
The core principle of DCA involves investing a fixed amount of money at regular intervals (e.g., every month. This approach allows investors to purchase more units when prices are low and fewer units when prices are high, thereby reducing the impact of market volatility.
Why Was DCA Developed?
The strategy was developed to address key challenges faced by investors, including:
1. Reducing Market Timing Risk
Investing a fixed amount periodically eliminates the need to predict the perfect market entry point, reducing the risk of buying at peaks.
2. Discipline and Financial Planning
DCA helps investors maintain financial discipline, making investments more consistent and predictable.
3. Mitigating Volatility
Spreading trades over a long period reduces the impact of market fluctuations and minimizes the risk of experiencing a significant drop immediately after a large investment.
4. Ease of Implementation
The strategy is simple to apply and does not require constant market monitoring, making it accessible to all types of investors.
Types of DCA
Dollar Cost Averaging (DCA) is an investment strategy that can be implemented in two main ways:
Time-Based DCA → Entries occur at regular intervals regardless of price.
Price-Based DCA → Entries occur only when the price meets specific criteria.
1. Time-Based DCA
How It Works: The investor buys a fixed amount of an asset at regular intervals (e.g., weekly, monthly). Entries occur regardless of market price.
Example: An investor decides to buy $200 worth of Bitcoin every month, without worrying whether the price has gone up or down.
2. Price-Based DCA
How It Works: Purchases occur only when the price drops below a predefined threshold. The investor sets price levels at which purchases will be executed (e.g., every -5%). This approach is more selective and allows for buying at a “discount” compared to the market trend.
Example: An investor decides to buy $200 worth of Bitcoin only when the price drops by at least 5% compared to the last entry.
Challenges and Limitations
1. DCA May Reduce Profits in Bull Markets
If the market is in an bullish trend, a single trade may be more profitable than spreading purchases over time or price dips.
2. Does Not Fully Remove Loss Risk
DCA helps mitigate volatility but does not protect against long-term bearish trends. If an asset continues to decline for an extended period, positions will accumulate at lower values with no guarantee of recovery.
3. May Be Inefficient for Active Investors
If an investor has the skills to identify better entry points (e.g., using technical or macroeconomic analysis), DCA might be less effective. Those who can spot market opportunities may achieve a better average entry price than an automatic DCA approach.
4. Does Not Take Full Advantage of Price Drops
DCA does not allow aggressive buying during market dips since purchases are fixed at regular intervals. If the market temporarily crashes, an investor with available funds could benefit more by buying larger amounts at that moment.
5. Higher Transaction Costs
Frequent small investments can lead to higher trading fees, which may reduce net returns. This is especially relevant in markets with fixed commissions or high spreads.
6. Risk of Overconfidence and False Security
DCA is often seen as a “fail-proof” strategy, but it is not always effective. If an asset has weak fundamentals or belongs to a declining sector, DCA may only slow down losses rather than ensure future gains.
7. Requires Discipline and Patience
DCA is only effective if applied consistently over a long period. Some investors may lose patience and leave the strategy at the wrong time, especially during market crashes.

$FMC: FMC Corporation – Crop Cash or Weed Woes?(1/9)
Good morning, everyone! ☀️ NYSE:FMC : FMC Corporation – Crop Cash or Weed Woes?
With FMC at $42.96, is this agro giant sprouting profits or wilting away? Let’s dig into the dirt! 🔍
(2/9) – PRICE PERFORMANCE 📊
• Current Price: $ 42.96 as of Mar 18, 2025 💰
• Recent Move: Up 14.5% from $37.52 on Mar 3, per data 📏
• Sector Trend: Agri sector volatile with commodity swings 🌟
It’s a wild harvest—value might be budding! ⚙️
(3/9) – MARKET POSITION 📈
• Market Cap: Approx $5.36B (124.84M shares) 🏆
• Operations: Crop protection in N. America, LatAm, Asia ⏰
• Trend: Q4 2024 earnings beat, per data 🎯
Firm in agro sciences, weathering the storm! 🚜
(4/9) – KEY DEVELOPMENTS 🔑
• Q4 2024 Earnings: EPS $1.79 beat $1.60 estimate, per data 🌍
• Revenue: Steady despite agri volatility, per reports 📋
• Market Reaction: Price reflects cautious optimism 💡
Growing roots in a tough field! 🌱
(5/9) – RISKS IN FOCUS ⚡
• Commodity Prices: Grain price drops hit demand 🔍
• Economic Slowdown: Reduced grower budgets, per data 📉
• Regulation: Pesticide rules tighten globally ❄️
It’s a risky plot—watch the yield! 🛑
(6/9) – SWOT: STRENGTHS 💪
• Product Portfolio: Insecticides, herbicides, fungicides 🥇
• Global Reach: Ops across continents, per data 📊
• Dividend: ~5% yield draws income seekers 🔧
Got fertile ground to grow! 🏦
(7/9) – SWOT: WEAKNESSES & OPPORTUNITIES ⚖️
• Weaknesses: Volatility, regulatory pressures 📉
• Opportunities: Agri demand rebound, new products 📈
Can it bloom or just mulch? 🤔
(8/9) – POLL TIME! 📢
FMC at $42.96—your take? 🗳️
• Bullish: $50+ soon, agro recovery 🐂
• Neutral: Steady, risks balance out ⚖️
• Bearish: $35 looms, sector woes 🐻
Chime in below! 👇
(9/9) – FINAL TAKEAWAY 🎯
FMC’s $42.96 price hints at value 📈, but agro risks loom 🌿. Dips are our DCA harvest 💰—buy low, ride high! Gem or bust?

Tue 18th Mar 2025 BTC/USD Daily Forex Chart Buy SetupGood morning fellow traders. On my Daily Forex charts using the High Probability & Divergence trading methods from my books, I have identified a new trade setup this morning. As usual, you can read my notes on the chart for my thoughts on this setup. The trade being a BTC/USD Buy. Enjoy the day all. Cheers. Jim

Mon 17th Mar 2025 AUD/CHF Daily Forex Chart Buy SetupGood morning fellow traders. On my Daily Forex charts using the High Probability & Divergence trading methods from my books, I have identified a new trade setup this morning. As usual, you can read my notes on the chart for my thoughts on this setup. The trade being a AUD/CHF Buy. Enjoy the day all. Cheers. Jim

Mon 17th Mar 2025 GBP/CAD Daily Forex Chart Sell SetupGood morning fellow traders. On my Daily Forex charts using the High Probability & Divergence trading methods from my books, I have identified a new trade setup this morning. As usual, you can read my notes on the chart for my thoughts on this setup. The trade being a GBP/CAD Sell. Enjoy the day all. Cheers. Jim

HOW-TO: Optimizing FADS for Traders with Investment MindsetIn this tutorial, we’ll explore how the Fractional Accumulation/Distribution Strategy (FADS) can help traders especially with an investment mindset manage risk and build positions systematically. While FADS doesn’t provide the fundamentals of a company which remain the trader’s responsibility, it offers a robust framework for dividing risk, managing emotions, and scaling into positions strategically.
Importance of Dividing Risk by Period and Fractional Allocation
Periodic Positioning
FADS places entries over time rather than committing the entire position at once. This staggered approach reduces the impact of short-term volatility and minimizes the risk of overexposing the capital.
Fractional Allocation
Fractional allocation ensures that capital is allocated dynamically during building a position. This allows traders to scale into positions as the trade develops while spreading out the risk.
Using a high volatility setting, such as a Weekly with period of 12 , optimizes trend capture by filtering out minor fluctuations.
Increasing Accumulation Factor to 1.5 results in avoiding entries at high price levels, improving overall risk.
Increasing the Accumulation Spread to a higher value, such as 1.5 , expands the distance between buy orders. This leads to fewer trades and a more conservative accumulation strategy. In highly volatile markets, a larger distance between entry positions can significantly improve the average cost of trades and contribute to better capital conservation.
To compensate for the reduced number of trades, increasing the Averaging Power intensifies the position sizing proportionate to price action. This balances the overall risk profile by optimizing the average position cost.
This approach mimics the behavior of successful institutional investors, who rarely enter the market with full exposure in a single move. Instead, they build positions over time to reduce emotional decision-making and enhance long-term consistency.

Why DCA Does Not Work For Short-Term TradersIn this video I go through why DCA (Dollar Cost Averaging) does not work for short-term traders and is more suitable for investors. I go through the pitfalls than come through such techniques, as well as explain how trading should really be approached. Which at it's cost should be based on having a positive edge and using the power of compounding to grow your wealth.
I hope this video was insightful, and gives hope to those trying to make it as a trader. Believe me, it's possible.
- R2F Trading

XAU/USD: Gold – Glittering Gains or Gilded Trap?(1/9)
Good evening, everyone! 🌙 XAU/USD: Gold – Glittering Gains or Gilded Trap?
With gold at $2,984.40, is this safe-haven star shining bright or setting up for a fall? Let’s mine the truth! 🔍
(2/9) – PRICE PERFORMANCE 📊
• Current Price: $ 2,984.40 per ounce as of Mar 14, 2025 💰
• Recent Move: Near $3,000, up from recent trends, per data 📏
• Sector Trend: Precious metals hot with trade tensions, rate cut bets 🌟
It’s a shiny ride—let’s see what’s fueling it! ⚙️
(3/9) – MARKET POSITION 📈
• Global Role: Safe-haven asset, industrial use in electronics ⏰
• Supply Dynamics: Central bank buying, mining output steady 🎯
• Trend: Geopolitical risks pushing demand, per posts on X 🚀
Firm as a rock in uncertain times! 🏦
(4/9) – KEY DEVELOPMENTS 🔑
• Trade Tensions: U.S.-China tariff threats boosting safe-haven appeal 🌍
• Rate Cuts: Fed easing bets supporting prices, per data 📋
• Market Reaction: Near record highs, showing strength 💡
Riding waves of global chaos! 🌊
(5/9) – RISKS IN FOCUS ⚡
• Economic Recovery: Could dampen safe-haven demand 🔍
• Market Sentiment: Sudden risk-on shifts might trigger a sell-off 📉
• Supply Boost: Increased mining could cap gains ❄️
It’s a glittering gamble—watch out! 🛑
(6/9) – SWOT: STRENGTHS 💪
• Safe-Haven Demand: Gold thrives in uncertainty 🥇
• Central Bank Buying: Steady support from global reserves 📊
• Green Energy: Use in renewables adds industrial demand 🔧
Got a golden edge in tough times! 🌟
(7/9) – SWOT: WEAKNESSES & OPPORTUNITIES ⚖️
• Weaknesses: High prices risk a correction if tensions ease 📉
• Opportunities: Escalating trade wars, infrastructure spending 📈
Can it break $3,000 and hold? 🤔
(8/9) – POLL TIME! 📢
Gold at $2,984.40—your take? 🗳️
• Bullish: $3,100+ soon, safe-haven rally continues 🐂
• Neutral: Steady near $3,000, risks balance out ⚖️
• Bearish: $2,800 looms, correction ahead 🐻
Chime in below! 👇
(9/9) – FINAL TAKEAWAY 🎯
Gold’s $2,984.40 price reflects safe-haven strength 📈, but it’s not cheap—volatility’s our ally. DCA-on-dips could catch a dip below $3,000 for a long-term win. Gem or bust?

$ADSK: AutodesK – Designing Profits or Sketching Losses?(1/9)
Good afternoon, everyone! ☀️ NASDAQ:ADSK : AutodesK – Designing Profits or Sketching Losses?
With ADSK at $245 post-Q4 beat and robust guidance, is this design titan a blueprint for profit or a rough draft? Let’s ink out the details! 🔍
(2/9) – PRICE PERFORMANCE 📊
• Current Price: $ 245 as of Mar 13, 2025 💰
• Recent Move: Up after Q4 FY2024 earnings beat, per data 📏
• Sector Trend: Tech sector buoyant, with AI and cloud driving growth 🌟
It’s a tech favorite—let’s see if it’s worth the hype! ⚙️
(3/9) – MARKET POSITION 📈
• Market Cap: Approx $50B (assuming shares outstanding) 🏆
• Operations: Design software for architecture, engineering, manufacturing ⏰
• Trend: Cloud and AI integration boosting future growth, per reports 🎯
Firm in its niche, with digital transformation as tailwind! 🚀
(4/9) – KEY DEVELOPMENTS 🔑
• Q4 FY2024 Earnings: Billings and revenue beat, per data 🌍
• FY2026 Guidance: Revenue growth 8-9%, FCF $2.075B-$2.175B 📋
• Market Reaction: Stock price up post-earnings, indicating confidence 💡
Adapting to new tech trends, looking ahead! 💪
(5/9) – RISKS IN FOCUS ⚡
• Economic Slowdown: Reduced software spending in tough times 🔍
• Tariff Threats: March 10-12, 2025, impacting new business, per data 📉
• Competition: Adobe, Siemens, others in design software market ❄️
It’s a competitive landscape—risks are real! 🛑
(6/9) – SWOT: STRENGTHS 💪
• Market Leader: Dominant in design software, strong brand 🥇
• Subscription Model: Recurring revenue from cloud-based services 📊
• AI Integration: Leveraging AI for enhanced products, per recent announcements 🔧
Got solid foundations and futuristic vision! 🏦
(7/9) – SWOT: WEAKNESSES & OPPORTUNITIES ⚖️
• Weaknesses: High valuation (P/E around 39), macro headwinds 📉
• Opportunities: Expanding into manufacturing, healthcare, per strategy 📈
Can it justify its price and expand further? 🤔
(8/9) – POLL TIME! 📢
ADSK at $245—your take? 🗳️
• Bullish: $260+ soon, growth story continues 🐂
• Neutral: Steady, risks and opportunities balance out ⚖️
• Bearish: $220 looms, overvalued in current market 🐻
Chime in below! 👇
(9/9) – FINAL TAKEAWAY 🎯
ADSK’s $245 price reflects strong performance and guidance 📈, but with a high P/E ratio, it’s not for the faint-hearted. Dips could be golden opportunities for DCA investors. Gem or bust?

Copper (HG): Red Metal Rally or Rusty Bet?(1/9)
Good afternoon, everyone! ☀️ Copper (HG): Red Metal Rally or Rusty Bet?
With copper at $4.88 per pound, is this industrial darling a steal or a trap? Let’s dig into the dirt! 🔍
(2/9) – PRICE PERFORMANCE 📊
• Current Price: $ 4.88 per pound as of Mar 13, 2025 💰
• Recent Move: Up slightly this week (Mar 10-13), per data 📏
• Sector Trend: Industrial metals volatile, with tariff impacts 🌟
It’s a mixed bag—let’s see what’s driving the price! ⚙️
(3/9) – MARKET POSITION 📈
• Global Demand: Key in construction, electronics, renewable energy ⏰
• Supply Dynamics: Major producers in Chile, Peru, China; tariff risks loom 🎯
• Trend: Green energy demand up, but economic slowdowns could dampen growth 🚀
Firm in its industrial roots, but facing new challenges! 🏭
(4/9) – KEY DEVELOPMENTS 🔑
• Trade War Escalation: U.S.-China tensions on Mar 13, 2025, per data, could hit supply chains 🌍
• China’s Response: Uncertain, but likely to affect prices due to its role in copper 📋
• Market Reaction: Prices volatile but up slightly, indicating cautious optimism 💡
Navigating through geopolitical storms! 🛳️
(5/9) – RISKS IN FOCUS ⚡
• Economic Slowdown: Reduced industrial activity could lower demand 🔍
• Supply Disruptions: Tariffs or geopolitical issues could disrupt supply, per data 📉
• Substitution: Other materials or technologies could reduce copper’s importance ❄️
It’s a risky ride, but potential rewards are there! 🛑
(6/9) – SWOT: STRENGTHS 💪
• Increasing Demand from Green Energy: Solar panels, wind turbines, EVs require copper 🥇
• Industrial Staple: Essential in construction and electronics, ensuring steady demand 📊
• Price History: Historically, copper has been a good long-term investment, especially during expansions 🔧
Got solid fundamentals! 🏦
(7/9) – SWOT: WEAKNESSES & OPPORTUNITIES ⚖️
• Weaknesses: Price volatility due to economic cycles and supply disruptions 📉
• Opportunities: Expansion in emerging markets, new applications in tech and infrastructure 📈
Can copper shine through the challenges? 🤔
(8/9) – 📢Copper at $4.88 per pound—your take? 🗳️
• Bullish: $5+ soon, green energy boom drives prices up 🐂
• Neutral: Steady, risks and opportunities balance out ⚖️
• Bearish: $4 looms, economic slowdown hits demand 🐻
Chime in below! 👇
(9/9) – FINAL TAKEAWAY 🎯
Copper’s $4.88 price reflects a mix of optimism and caution 📈. With green energy demand rising but economic and geopolitical risks lingering, it’s a volatile market. DCA-on-dips could be a strategy to average in over time, banking on long-term growth. Gem or bust?

$HRTG: Heritage Insurance – Catastrophe or Opportunity?(1/9)
Good morning, everyone! ☀️ NYSE:HRTG : Heritage Insurance – Catastrophe or Opportunity?
With HRTG at $11.50, is this insurer a risky bet or a hidden gem in the catastrophe-prone market? Let’s dive into the details! 🔍
(2/9) – PRICE PERFORMANCE 📊
• Current Price: $ 11.50 as of Mar 12, 2025 💰
• Recent Move: Slipped 4% post-Q4 earnings, but stabilized 📏
• Sector Trend: Insurance sector steady, with P&C insurers facing claims volatility 🌟
It’s a volatile ride, but potential value lurks! ⚙️
(3/9) – MARKET POSITION 📈
• Market Cap: Approx $200M (assuming 17.39M shares) 🏆
• Operations: Property and casualty insurance in high-risk areas ⏰
• Trend: Niche focus on catastrophe-prone regions like Florida, potential for growth 🎯
Firm in its niche, but risks are high! 🚀
(4/9) – KEY DEVELOPMENTS 🔑
• Q4 2024 Earnings: Net income $0.66 per share, down from $1.15 YoY 🔄
• Revenue: Slightly missed estimates, per reports 🌍
• Market Reaction: Stock slipped 4%, but stabilized post-earnings 📋
Adapting to challenges, looking ahead! 💡
(5/9) – RISKS IN FOCUS ⚡
• Natural Disasters: High exposure to claims from hurricanes, floods, etc. 🔍
• Regulatory Changes: Potential impacts from state regulations in Florida and other areas 📉
• Competition: Increasing competition in high-risk insurance markets ❄️
Tough, but risks are part of the game! 🛑
(6/9) – SWOT: STRENGTHS 💪
• Niche Market: Focus on high-risk areas with potentially higher premiums 🥇
• Established Presence: Strong foothold in Florida and other states 📊
• Growth Potential: Increasing demand due to climate change and urbanization 🔧
Got potential in a challenging market! 🏦
(7/9) – SWOT: WEAKNESSES & OPPORTUNITIES ⚖️
• Weaknesses: Earnings volatility from natural disasters, regulatory risks 📉
• Opportunities: Expansion into new high-risk areas, technological advancements for better risk management 📈
Can it weather the storms and shine? 🤔
(8/9) –📢HRTG at $11.50, with undervaluation signs—your take? 🗳️
• Bullish: $15+ soon, undervalued gem 🐂
• Neutral: Steady, risks balance growth ⚖️
• Bearish: $10 looms, catastrophe ahead 🐻
Chime in below! 👇
(9/9) – FINAL TAKEAWAY 🎯
HRTG’s $11.50 price tags potential value 📈, but catastrophe risks add caution 🌿. Volatility’s our friend—dips are DCA gold 💰. Grab ‘em low, climb like pros! Gem or bust?

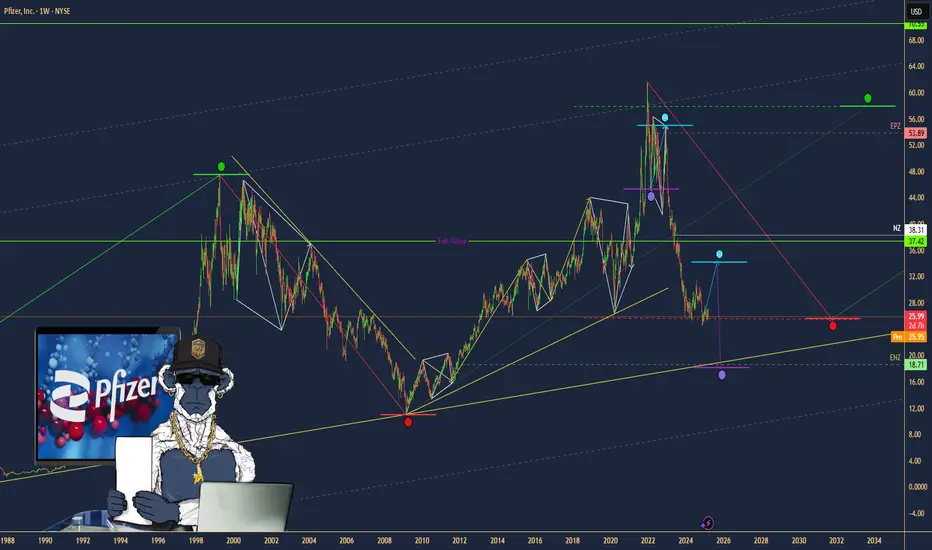
Pfizer ($PFE): Undervalued Pharma Giant with Growth Potential?(1/9)
Good afternoon, everyone! 😊
Pfizer ( NYSE:PFE ): Undervalued Pharma Giant with Growth Potential?
With PFE at $25.90, is this the time to buy into this pharmaceutical powerhouse? Let’s dive in! 😎
(2/9) – PRICE PERFORMANCE
• Current Price: $25.90 as of March 12, 2025 😏
• Recent Moves: Trading within a range of $24 to $28, currently near the middle 😬
• Sector Vibe: Pharma sector remains stable, with new drug approvals driving growth 📈
Short commentary: The stock seems to be consolidating. Is this a good entry point? 🤔
(3/9) – MARKET POSITION
• Market Cap: Approximately $147.2 billion (assuming 5.67 billion shares outstanding) 💰
• Operations: Global pharmaceutical company with a diverse product portfolio 🛡️
• Trend: Strong Q4 2024 earnings and reaffirmed 2025 guidance 🚀
Short commentary: Pfizer’s fundamentals are solid, with consistent revenue and earnings projections. 😉
(4/9) – KEY DEVELOPMENTS
• Reaffirmed 2025 revenue guidance of $61-64 billion and EPS of $2.80-3.00 📈
• Continued focus on new drug developments and expanding into emerging markets 🌐
• Achieved cost savings goals and ongoing optimization programs for improved margins 💡
Short commentary: The company is managing its costs effectively and looking to future growth. Let’s watch closely. 👀
(5/9) – RISKS IN FOCUS
• Legal challenges related to past products ⚙️
• Competition from generic manufacturers and patent expirations 📉
• Economic conditions affecting healthcare spending ⚠️
Short commentary: These risks are known, but Pfizer’s diverse portfolio should help mitigate them. Stay vigilant! 🕵️
(6/9) – SWOT: STRENGTHS
• Diverse product portfolio across multiple therapeutic areas 🏆
• Strong R&D capabilities and pipeline of new drugs 🌈
• Global presence and distribution network 🌟
Short commentary: Pfizer’s strengths position it well for long-term growth. Keep up the good work! 👍
(7/9) – SWOT: WEAKNESSES & OPPORTUNITIES
• Weaknesses: Dependence on key products, legal issues ⚠️
• Opportunities: New drug approvals, expanding into emerging markets 🌐
Short commentary: Opportunities abound, but weaknesses need to be monitored. Let’s hope they nail it! 📈
(8/9) – PFE at $25.90 – what’s your call? 🗳️
• Bullish: Price could rise to $30+ if it breaks above $28 🚀
• Neutral: Price remains between $24 and $28 😐
• Bearish: Price could drop to $22 if it breaks below $24 📉
Drop your pick below! 💬
(9/9) – FINAL TAKEAWAY
Pfizer’s $25.90 stance shows a company with solid fundamentals and a fair valuation at a P/E of approximately 8.93. With a strong pipeline and cost management, it’s an attractive option for value investors. Keep an eye on resistance at $28 for potential upside movement. Snag low, hold long!
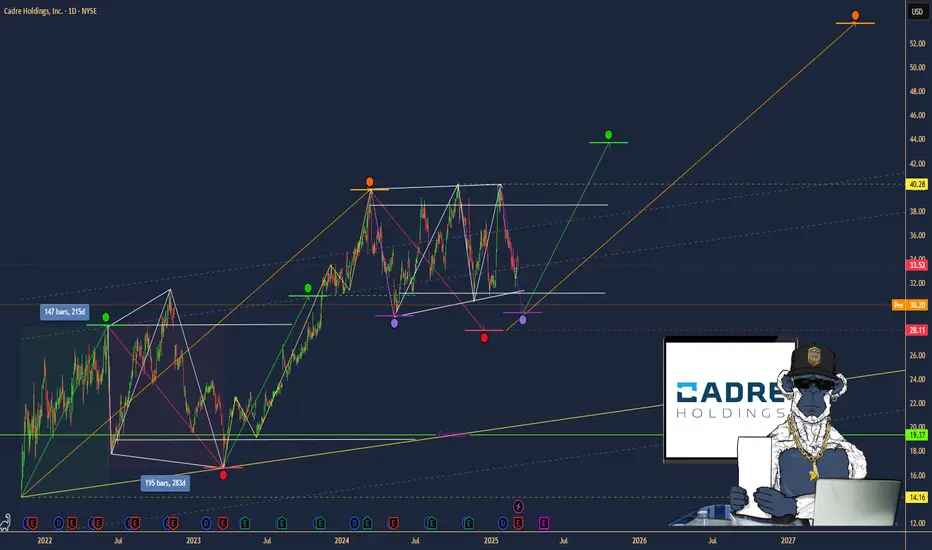
$CDRE: Cadre Holdings – Riding the Safety Wave?(1/9)
Good afternoon, everyone! 😊
NYSE:CDRE : Cadre Holdings – Riding the Safety Wave?
With CDRE at $30.20, is this stock a safe bet or a risky ride? Let's dive into the world of safety gear and see if Cadre's holdings hold up! 😎
(2/9) – PRICE PERFORMANCE
• Current Price: $30.20 as of March 12, 2025 😏
• Recent Moves: Down 11% from $34.02 a week ago 😬
• Sector Vibe: Safety equipment sector is growing, driven by stricter regulations and demand for safer workplaces. 📈
Short commentary: The stock's taken a hit, but the sector's looking good. Maybe it's just a temporary dip? 🤔
(3/9) – MARKET POSITION
• Market Cap: Approximately $1.23 billion 💰
• Operations: Manufacturing and distributing safety and survivability products for law enforcement, first responders, military, and now, the nuclear market. 🛡️
• Trend: Expanding into new markets with the acquisition of nuclear safety brands. 🚀
Short commentary: They're diversifying, which is usually a good sign. More markets mean more opportunities. 😉
(4/9) – KEY DEVELOPMENTS
• Acquisition of Carr's Engineering Limited's Engineering Division for nuclear safety solutions, announced on January 16, 2025. 📈
• Expected to close in the first half of 2025. ⌛
• Market Reaction: The stock has seen a recent dip, possibly reflecting integration concerns or broader market volatility. 😐
Short commentary: This should bring in new revenue streams and expand their international presence. Let's see how it plays out. 🌍
(5/9) – RISKS IN FOCUS
• Integration risks from the acquisition. ⚙️
• Supply chain disruptions. 🚚
• Regulatory changes in the nuclear sector. 📜
Short commentary: These are all things to keep an eye on, but every company has some risks. Stay vigilant! 🕵️
(6/9) – SWOT: STRENGTHS
• Strong reputation in safety equipment. 🏆
• Diverse product portfolio. 🌈
• Recent acquisition expanding into the nuclear market. 🌟
Short commentary: They're well-known and have a broad range of products, which is great. Keep up the good work! 👍
(7/9) – SWOT: WEAKNESSES & OPPORTUNITIES
• Weaknesses: Potential over-reliance on government contracts, integration challenges. ⚠️
• Opportunities: Growth in nuclear safety market, increasing global demand for safety products. 🌐
Short commentary: They need to manage their dependencies and make sure the acquisition goes smoothly, but there's a lot of potential for growth. Let's hope they nail it! 📈
(8/9) – CDRE at $30.20 – what's your call? 🗳️
• Bullish: Price could rise to $35+ soon, due to successful acquisition and sector growth. 🚀
• Neutral: Price remains steady, as the market digests the acquisition news. 😐
• Bearish: Price could drop to $25, due to integration risks and market volatility. 📉
Drop your pick below! 💬
(9/9) – FINAL TAKEAWAY
Cadre Holdings' $30.20 stance shows a robust portfolio and strategic expansion, but recent price dips and integration risks are concerns. Volatility’s our ally—dips are DCA treasure. Snag low, soar high!