$CDRE: Cadre Holdings – Riding the Safety Wave?(1/9)
Good afternoon, everyone! 😊
NYSE:CDRE : Cadre Holdings – Riding the Safety Wave?
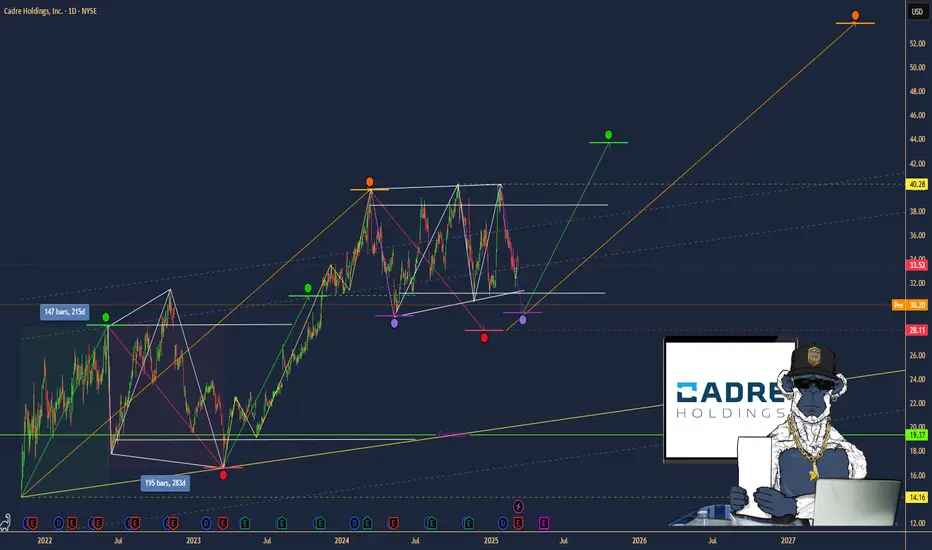
With CDRE at $30.20, is this stock a safe bet or a risky ride? Let's dive into the world of safety gear and see if Cadre's holdings hold up! 😎
(2/9) – PRICE PERFORMANCE
• Current Price: $30.20 as of March 12, 2025 😏
• Recent Moves: Down 11% from $34.02 a week ago 😬
• Sector Vibe: Safety equipment sector is growing, driven by stricter regulations and demand for safer workplaces. 📈
Short commentary: The stock's taken a hit, but the sector's looking good. Maybe it's just a temporary dip? 🤔
(3/9) – MARKET POSITION
• Market Cap: Approximately $1.23 billion 💰
• Operations: Manufacturing and distributing safety and survivability products for law enforcement, first responders, military, and now, the nuclear market. 🛡️
• Trend: Expanding into new markets with the acquisition of nuclear safety brands. 🚀
Short commentary: They're diversifying, which is usually a good sign. More markets mean more opportunities. 😉
(4/9) – KEY DEVELOPMENTS
• Acquisition of Carr's Engineering Limited's Engineering Division for nuclear safety solutions, announced on January 16, 2025. 📈
• Expected to close in the first half of 2025. ⌛
• Market Reaction: The stock has seen a recent dip, possibly reflecting integration concerns or broader market volatility. 😐
Short commentary: This should bring in new revenue streams and expand their international presence. Let's see how it plays out. 🌍
(5/9) – RISKS IN FOCUS
• Integration risks from the acquisition. ⚙️
• Supply chain disruptions. 🚚
• Regulatory changes in the nuclear sector. 📜
Short commentary: These are all things to keep an eye on, but every company has some risks. Stay vigilant! 🕵️
(6/9) – SWOT: STRENGTHS
• Strong reputation in safety equipment. 🏆
• Diverse product portfolio. 🌈
• Recent acquisition expanding into the nuclear market. 🌟
Short commentary: They're well-known and have a broad range of products, which is great. Keep up the good work! 👍
(7/9) – SWOT: WEAKNESSES & OPPORTUNITIES
• Weaknesses: Potential over-reliance on government contracts, integration challenges. ⚠️
• Opportunities: Growth in nuclear safety market, increasing global demand for safety products. 🌐
Short commentary: They need to manage their dependencies and make sure the acquisition goes smoothly, but there's a lot of potential for growth. Let's hope they nail it! 📈
(8/9) – CDRE at $30.20 – what's your call? 🗳️
• Bullish: Price could rise to $35+ soon, due to successful acquisition and sector growth. 🚀
• Neutral: Price remains steady, as the market digests the acquisition news. 😐
• Bearish: Price could drop to $25, due to integration risks and market volatility. 📉
Drop your pick below! 💬
(9/9) – FINAL TAKEAWAY
Cadre Holdings' $30.20 stance shows a robust portfolio and strategic expansion, but recent price dips and integration risks are concerns. Volatility’s our ally—dips are DCA treasure. Snag low, soar high!
DCA
$REVG: REV Group – Riding the Specialty Vehicle Wave?(1/9)
Good morning, everyone! 😄
NYSE:REVG : REV Group – Riding the Specialty Vehicle Wave?
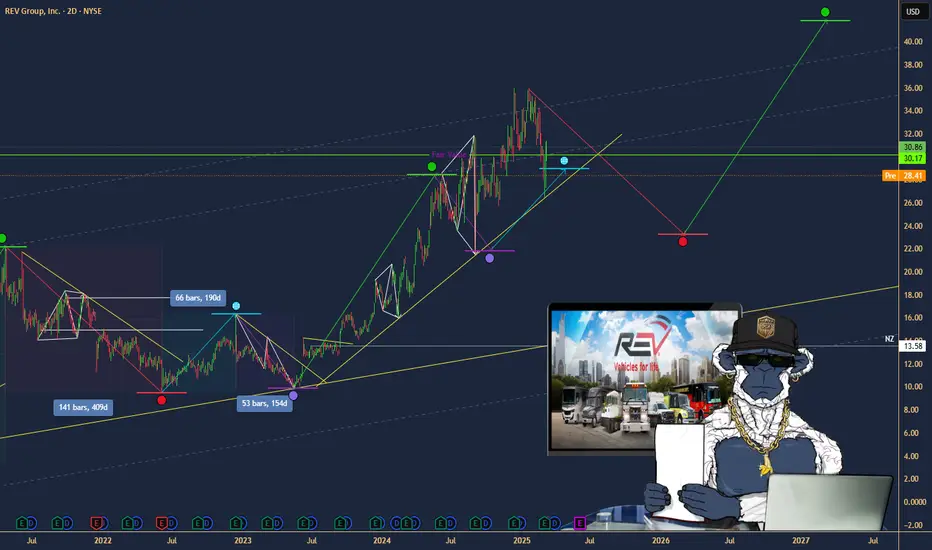
With NYSE:REVG at $31.00, is this stock revving up for growth or hitting a speed bump? Let’s dive into the details! 😎
(2/9) – PRICE PERFORMANCE 📊
• Current Price: $32.00 as of 12-03-2025 😊
• Recent Moves: Up from last month, showing steady growth. 📈
• Sector Vibe: Specialty vehicles sector is stable, with consistent demand from public services and commercial clients. 🚒🚜
Short commentary: REVG’s price is on an upward trajectory, reflecting positive market sentiment. Let’s see what’s driving this! 🚀
(3/9) – MARKET POSITION 📈
• Market Cap: Approximately $1.75B (based on 52.13M shares * $32.00) 💰
• Operations: Designs, manufactures, and distributes specialty vehicles like fire trucks, ambulances, and recreational vehicles. 🚓🏎️
• Trend: Increasing focus on customization and technology integration in vehicles. ⚙️
Short commentary: REVG is a key player in the niche market of specialty vehicles, with a diverse portfolio that caters to various sectors. Their market position seems solid. 🌟
(4/9) – KEY DEVELOPMENTS 🔑
• Exited bus manufacturing business by selling ElDorado National, focusing on core segments. 🚐
• Provided fiscal 2025 guidance, showing confidence in future performance. 📈
• Increased quarterly dividend by 20%, signaling strong cash flow and shareholder value focus. 💸
Market Reaction: Positive, with stock price reflecting these developments. Investors are optimistic about the company’s strategic moves. 😃
Short commentary: These developments suggest that REVG is streamlining its operations and focusing on more profitable areas, which should benefit shareholders. 👏
(5/9) – RISKS IN FOCUS ⚠️
• Economic slowdown could reduce demand for new vehicles, especially in the commercial sector. 🌦️
• Supply chain disruptions might affect production schedules and costs. 🚚
• Increased competition in the recreational vehicles segment. 🏕️
Short commentary: While there are risks, REVG’s diversified portfolio and focus on essential services might mitigate some of these challenges. It’s important to monitor these factors closely. 🕵️
(6/9) – SWOT: STRENGTHS 💪
• Strong brand portfolio with recognized names in the industry. 🏆
• Diverse customer base across public services and commercial clients. 🌐
• Recent strategic decisions to exit less profitable segments. 🚫
Short commentary: REVG’s strengths lie in its well-established brands and broad customer reach, which provide stability and growth opportunities. 💪
(7/9) – SWOT: WEAKNESSES & OPPORTUNITIES ⚖️
• Weaknesses: Dependence on economic conditions and potential regulatory changes. 📜
• Opportunities: Growth in the fire and emergency segment due to increased public safety spending. 🚒
Short commentary: While there are weaknesses tied to external factors, the opportunities in expanding sectors like fire and emergency services could drive future growth. It’s a balancing act! ⚖️
(8/9) – 📢REV Group at $32.00, with recent positive developments—your call?
• Bullish: $40+ soon, due to strategic focus and increased dividend. 🚀
• Neutral: Steady growth, maintaining current trends. 🛴
• Bearish: $25 drop, if economic conditions worsen. ⬇️
Drop your pick below! 😄
(9/9) – FINAL TAKEAWAY 🎯
REV Group’s $31.00 stance shows resilience and strategic planning, but economic risks linger. Volatility’s our ally—dips are DCA treasure. Snag low, soar high! Will it rev up or slow down?
$CRWD: Crowdstrike – Cybersecurity Titan or Overvalued Hype?(1/9)
Good afternoon, investors! ☀️ NASDAQ:CRWD : Crowdstrike – Cybersecurity Titan or Overvalued Hype?
With NASDAQ:CRWD at $322, is this cyber guardian still leading the pack or is it time to cash in? Let's dive into the digital trenches! 🔍
(2/9) – PRICE PERFORMANCE 📊
• Current Price: $ 322 as of Mar 11, 2025 💰
• Recent Moves: Down from $360+ post-Q4, per X posts 📏
• Sector Trend: Cybersecurity demand remains robust, per market insights 🌟
It’s a steady ride with potential for growth! ⚙️
(3/9) – MARKET POSITION 📈
• Market Cap: ~$75B (based on 232.5M shares) 🏆
• Operations: Leader in endpoint security and threat intelligence ⏰
• Trend: Expanding into AI-driven security solutions, per recent developments 🎯
Firm, standing tall in the cyber battlefield! 🚀
(4/9) – KEY DEVELOPMENTS 🔑
• Earnings Win: Q1 FY25 beat estimates, guidance raised, per X posts 🔄
• Cyber Boom: Threats fuel demand, per Mar 6 chatter 🌍
• Market Reaction: Stock jumped, then dipped, per X sentiment 📋
Battling, with innovation driving the narrative! 💡
(5/9) – RISKS IN FOCUS ⚡
• Competition: Intense from Palo Alto Networks, Zscaler, etc. 🔍
• Valuation: High P/E ratio may concern some investors 📉
• Regulatory Shifts: Potential new laws impacting data privacy ❄️
Navigating challenges in a dynamic landscape! 🛑
(6/9) – SWOT: STRENGTHS 💪
• Market Leader: Dominant in endpoint security 🥇
• Innovation: AI and ML-driven solutions keep it ahead 📊
• Financial Health: Strong cash position, no debt 🔧
Built to withstand cyber storms! 🏦
(7/9) – SWOT: WEAKNESSES & OPPORTUNITIES ⚖️
• Weaknesses: High valuation, competitive pressures 📉
• Opportunities: Growing demand for cloud security, new market segments 📈
Can it capitalize on the digital expansion? 🤔
(8/9) –📢Crowdstrike at $322—your investment move? 🗳️
• Bullish: $400+ soon, cyber threats fuel growth 🐂
• Neutral: Holding steady, balancing risks and rewards ⚖️
• Bearish: $280 drop, overvalued in a cooling market 🐻
Cast your vote below! 👇
(9/9) – FINAL TAKEAWAY 🎯
Crowdstrike’s $322 stance shows resilience 📈, but cautious investors eye valuation and competition 🌿. Dips are our DCA playground 💰. Grab ‘em low, ride the wave! Gem or bust?

$SUI: SUI Blockchain’s Token – Poised for Growth or Overhyped?(1/9)
Good morning, crypto enthusiasts! ☀️ CRYPTOCAP:SUI : SUI Blockchain’s Token – Poised for Growth or Overhyped?
With SUI at $2.70 , is this Layer 1 blockchain’s token set to dominate the crypto market or just another flash in the pan? Let’s dive into the digital realm and find out! 🔍
(2/9) – PRICE PERFORMANCE 📊
• Current Price: $ 2.70 as of Mar 7, 2025 💰
• Historical Context: Launched May 3, 2023, with significant growth in 2024 📏
• Sector Trend: Blockchain gaming and NFTs driving demand 🌟
It’s a hot commodity in the crypto space! ⚙️
(3/9) – MARKET POSITION 📈
• Market Cap: Approx $1.2B (based on 1B tokens) 🏆
• Operations: Layer 1 blockchain with focus on speed and scalability ⏰
• Trend: Partnerships with gaming studios, NFT platforms boosting adoption 🎯
Solid, with a clear path to utility and growth! 🚀
(4/9) – KEY DEVELOPMENTS 🔑
• Recent Partnerships: Collaborations with gaming firms like Mythical Games 🔄
• NFT Sales: Robust growth in NFT transactions on SUI blockchain 🌍
• Market Reaction: Positive sentiment post-launch and recent updates 📋
Thriving, with a focus on real-world applications! 💡
(5/9) – RISKS IN FOCUS ⚡
• Competition: Strong rivals like Solana, Avalanche in the L1 space 🔍
• Regulatory Challenges: Crypto regulations could impact growth 📉
• Volatility: Crypto market’s inherent swings affect price ❄️
Navigating these choppy waters is key! 🛑
(6/9) – SWOT: STRENGTHS 💪
• Performance: High-speed transactions, ideal for gaming and more 🥇
• Partnerships: Growing ecosystem with gaming and NFT projects 📊
• Scalability: Designed for mass adoption, per developers’ claims 🔧
Got the goods to stand out in the blockchain race! 🏦
(7/9) – SWOT: WEAKNESSES & OPPORTUNITIES ⚖️
• Weaknesses: New project, unproven in long-term stability 📉
• Opportunities: Expanding into metaverse, AI integration 📈
Can it scale and secure its position or get lost in the noise? 🤔
(8/9) –📢SUI at $2.70—your take? 🗳️
• Bullish: $5+ by end of 2025, gaming boom drives growth 🐂
• Neutral: Steady growth, risks balanced ⚖️
• Bearish: $0.50 by year-end, competition overtakes 🐻
Chime in below! 👇
(9/9) – FINAL TAKEAWAY 🎯
SUI’s at $2.70, with a promising future in blockchain gaming and NFTs. Volatility’s a given, but its strengths could lead to significant gains. DCA on dips, ride the wave! Gem or bust?

$MRNA: Moderna – mRNA Magic or Biotech Bubble?(1/9)
Good afternoon, folks! ☀️ NASDAQ:MRNA : Moderna – mRNA Magic or Biotech Bubble?
CEO drops $5M on shares, sparking a 9% surge—is this a biotech rocket or a hot air balloon ready to pop? Let’s crack the code! 🔍
(2/9) – PRICE PERFORMANCE 📊
• Current Trend: Up 9% after CEO’s $5M buy on Mar 5, 2025 💰
• Context: Biotech’s a rollercoaster—posts on X show optimism 📈
• Sector Vibe: Volatile, but insider faith lifts spirits 🌈
It’s a wild climb—buckle up! ⚡
(3/9) – MARKET POSITION 📈
• Market Cap: Around $12B (based on 384M shares, est.) 🏅
• Operations: mRNA pioneer, vaccines to cancer therapies ⏳
• Trend: CEO’s move signals undervaluation hope 🎯
Solid player in the biotech jungle! 🌋
(4/9) – KEY DEVELOPMENTS 🔑
• Insider Buying: CEO’s $5M grab on Mar 5, 2025 🔄
• Buzz: Posts on X tie surge to leadership confidence 🌐
• Reaction: Market cheers, up 9% in a blink 📣
Risin’ like dough in a warm oven! 🔥
(5/9) – RISKS IN FOCUS ⚠️
• Volatility: Biotech swings wild amid macro uncertainty 🔎
• Policy: Healthcare shifts could sting 📉
• Pipeline: New products unproven, per X chatter 🌬️
High stakes, high drama! 🎭
(6/9) – SWOT: STRENGTHS 💪
• Innovation: mRNA tech reshapes medicine 🏆
• Confidence: CEO’s $5M bet screams belief 📊
• Legacy: COVID vaccine king, still swinging ⚒️
A biotech beast with bite! 🐺
(7/9) – SWOT: WEAKNESSES & OPPORTUNITIES ⚖️
• Weaknesses: Volatility, macro jitters hit hard 📉
• Opportunities: New mRNA goodies, partnerships loom 📈
Can it brew more magic or fizzle out? 🧪
(8/9) – 📢 Stock up 9% after CEO’s $5M buy—your call? 🗳️
#
• Bullish: $50+ soon, biotech boom 🚀
• Neutral: Holding steady, risks weigh ⚖️
• Bearish: $25 looms, bubble bursts 🐻#
Drop your vote below! 👇
(9/9) – FINAL TAKEAWAY 🎯
Moderna’s 9% pop on insider buying hints at hidden gems 📈, but biotech’s a stormy sea 🌊. Dips are our playground—DCA heaven 💸. Snag ‘em cheap, ride the wave! Winner or wild card?

$TGT: Target Corporation – Retail Titan or Fading Star?(1/9)
Good evening, shoppers! 🌙 NYSE:TGT : Target Corporation – Retail Titan or Fading Star?
Target’s at $116 on March 4, 2025—is this a golden ticket or a clearance rack trap? Let’s unpack the cart and find out! 🔧
(2/9) – PRICE PERFORMANCE 📊
• Current Price: $ 116 as of Mar 4, 2025 🤑
• Past Peek: Down 20% from $145.65 earlier this month 📉
• Sector Vibe: Retail’s feeling the squeeze, folks 🎮
It’s a bumpy ride, but deals might be hiding! 🛠️
(3/9) – MARKET POSITION 📈
• Market Cap: Roughly $53.15B (458.21M shares) 🏬
• Footprint: Around 1,950 stores, online sales popping 📡
• Trend: Brand loyalty high, but rivals are circling 🛡️
Still a heavyweight in the retail ring! 🏋️♀️
(4/9) – KEY DEVELOPMENTS 🔑
• Retail Scene: Spending’s tight, consumers picky 📅
• Digital Gains: E-commerce up, per past trends 🖥️
• Market Buzz: $116 hints at cautious buyers 🎤
Pivoting fast, but aisles are jammed! 🧭
(5/9) – RISKS IN FOCUS ⚠️
• Rivals: Walmart, Amazon playing hardball 🚨
• Economy: Inflation biting, tariffs looming 💸
• Swings: Retail stocks dance to a wild beat 🎶
Rough waters, but storms pass! 🌪️
(6/9) – SWOT: STRENGTHS 💥
• Name Value: Trendy goods, solid rep 💎
• Reach: 1,950+ stores, wide net 🗺️
• Online Edge: Digital sales climbing 📱
Loaded with ammo for the retail fight! 🔥
(7/9) – SWOT: WEAKNESSES & OPPORTUNITIES 🧐
• Weaknesses: $116 shows hesitation, margins tight 📋
• Opportunities: Push Target Circle, grow e-sales 🚀
Can it snag the prize or just scrape by? 🤷♂️
(8/9) – 📢Target’s $116, retail’s shaky—your call? 🗳️
• Bullish: $130+ soon, undervalued 🚀
• Neutral: Holding steady 🚬
• Bearish: $100 coming, trouble ahead 🕳️
Drop your vote below! 👇
(9/9) – FINAL TAKEAWAY 🎯
Target’s $116 price paints a shaky picture 📈, but its brand’s a rock 🌎. Swings are our playground—dips turn into DCA wins 💰. Buy low, aim high! Hit or miss?

$ADA: Cardano’s Quiet Climb – Ready to Roar or Still Crawling?(1/9)
Good afternoon, crypto enthusiasts! 🌙 Cardano ( CRYPTOCAP:ADA ): Blockchain’s Steady Eddie – Can It Break Out?
ADA’s chugging along at $0.84, with new dApp launches and partnerships. Is it time to stake or wait for a dip? Let’s dive in! 🔍
(2/9) – PRICE PERFORMANCE 📊
• Recent Trend: Holding at $0.84, up from last month’s peak of $0.82 📉
• 2025 Context: New dApp activity and African expansion driving interest 📏
• Sector Trend: Crypto market recovering from February’s 20.57% crash, but volatility persists 🌟
It’s a steady performer, but can it break out? ⚙️
(3/9) – MARKET POSITION 📈
• Ranking: Top 10 cryptocurrency by market cap, per CoinMarketCap 🏆
• Use Case: Smart contract platform with a focus on scalability and security ⏰
• Trend: Increasing adoption in emerging markets, particularly Africa 🎯
Firm, with a solid foundation and growth potential! 🚀
(4/9) – KEY DEVELOPMENTS 🔑
• Market Reaction: Shares steady, with analysts optimistic about long-term growth 📋
Cookin’ up something big, but the market’s cautious! 💡
(5/9) – RISKS IN FOCUS ⚡
• Competition: Ethereum and Solana offer stiff competition with more established ecosystems 🕳️
• Regulatory: Crypto regulations could impact adoption and growth ⚖️
• Volatility: Crypto market’s unpredictable swings can hit hard ❄️
Tread carefully, but the path looks promising! 🛑
(6/9) – SWOT: STRENGTHS 💪
• Scalability: Hydra and other upgrades promise high throughput and low fees 📊
• Community: Strong, academic-driven community with a focus on long-term development 🥇
• Partnerships: Growing presence in emerging markets, especially Africa 🌍
Got the building blocks for success! 🏦
(7/9) – SWOT: WEAKNESSES & OPPORTUNITIES ⚖️
• Weaknesses: Slower adoption compared to competitors, limited dApp activity 📉
• Opportunities: Expanding into new markets, new dApp developments, and regulatory clarity in some regions 📈
Can it catch up and surpass? 🤔
(8/9) –📢ADA’s at $0.45, with mixed market signals—your take? 🗳️
• Bullish: $1 soon, fundamentals are strong 🐂
• Neutral: Steady, wait for clearer skies ⚖️
• Bearish: Under $0.30, competition’s too fierce 🐻
Vote below! 👇
(9/9) – FINAL TAKEAWAY 🎯
ADA’s holding its ground at $0.83, with promising developments but market headwinds. Volatility’s our friend—dips are DCA gold 💰. Grab ‘em low, ride high! Gem or bust?

$KHC: Kraft Heinz – Sizzling Growth or Cooling Off?(1/9)
Good Morning, snackers! 🌞 NASDAQ:KHC : Kraft Heinz – Sizzling Growth or Cooling Off?
Kraft Heinz dished out $6.58B in Q4 2024 but missed the mark—price hikes are biting back! Can this food giant spice things up again? Let’s dig in! 🔍
(2/9) – PRICE PERFORMANCE 📊
• Q4 2024: Revenue at $6.58B, down 4.1% year-over-year, missed estimates 📉
• Full Year 2024: Free cash flow up 6% to $3.2B, per Yahoo Finance 💰
• Sector Trend: Consumer staples steady but facing thriftier shoppers 🌟
A bit of a sour taste, yet cash keeps flowin’! ⚙️
(3/9) – MARKET POSITION 📈
• Standing: 3rd largest food & bev in North America, per earnings 🏆
• Brands: Heinz, Oscar Mayer, Lunchables—household legends ⏰
• Trend: Pushing “Accelerate” platforms for growth 🎯
Still a pantry king, but gotta woo new eaters! 🚀
(4/9) – KEY DEVELOPMENTS 🔑
• Q4 Results: EPS beat at $0.84, but sales lagged, per Feb 12 Yahoo 🔄
• Strategy: Plans to adjust pricing on key brands, per Reuters 🌍
• Market Reaction: Shares slipped post-earnings, analysts cautious 📋
Cookin’ up fixes, but the stove’s tricky! 💡
(5/9) – RISKS IN FOCUS ⚡
• Demand: High prices deter budget shoppers, per Reuters 🔍
• Volume: Organic sales dropped 3.1%, volume down 4.1% 📉
• Competition: Smaller brands nip at their heels ❄️
Tough bites to chew, but not outta the game! 🛑
(6/9) – SWOT: STRENGTHS 💪
• Cash Flow: $3.2B free cash flow in 2024, up 6% 🥇
• Brand Power: Global reach, iconic products 📊
• Dividends: Steady $0.40/share payout 🔧
Got a solid recipe in the pot! 🏦
(7/9) – SWOT: WEAKNESSES & OPPORTUNITIES ⚖️
• Weaknesses: Sales miss, volume dips, per Q4 earnings 📉
• Opportunities: New products, emerging markets expansion 📈
Can they whip up a tastier comeback? 🤔
(8/9) – 📢Kraft Heinz’s cash flow’s up, but sales took a hit—your take? 🗳️
• Bullish: $40+ soon, staples rebound 🐂
• Neutral: Steady, tweaks needed ⚖️
• Bearish: $25 looms, demand stalls 🐻
Serve your thoughts below! 👇
(9/9) – FINAL TAKEAWAY 🎯
Kraft Heinz’s $3.2B cash flow tastes sweet 📈, but demand dips add a sour note 🌿. Volatility’s our sous-chef—dips are DCA gold 💰. Grab ‘em low, savor the rise! Gem or bust?

$SMCI: Super Micro Computer – AI Server Surge or a Pit Stop?
NASDAQ:SMCI : Super Micro Computer – AI Server Surge or a Pit Stop?
AI infrastructure’s hotter than a July barbecue, with revenue up 110% to $14,989.2 million in 2024! But with internal control concerns, is this tech beast charging up or taking a breather? Let’s dive in!
(1/9)
Good morning, everyone! ☀️ NASDAQ:SMCI : Super Micro Computer – AI Server Surge or a Pit Stop?
AI infrastructure’s hotter than a July barbecue, with revenue up 110% to $14,989.2 million in 2024! But with internal control concerns, is this tech beast charging up or taking a breather? Let’s dive in! 🔍
(2/9) – PRICE PERFORMANCE 📊
• Fiscal 2024: Net sales soared 110.4% to $14,989.2 million 💰
• Server Systems: Up 115.9%, GPU servers leading the charge 📏
• Sector Trend: AI demand’s skyrocketing 🌟
It’s a wild ride, fueled by AI’s hunger! ⚙️
(3/9) – MARKET POSITION 📈
• Market Cap: $2.4B, based on shares outstanding 🏆
• Holdings: Servers, storage, and AI solutions ⏰
• Trend: International sales steady at 32%, showing global appetite 🎯
Firm, carving a niche in AI infrastructure! 🚀
(4/9) – KEY DEVELOPMENTS 🔑
• 10-K Filing: Dropped Feb 25, 20
25, dodged NASDAQ delisting 🔄
• Revenue Driver: GPU servers for AI workloads 🌍
• Market Reaction: Shares jumped 19.8% after-hours 📋
Adapting, with investors cheering the comeback! 💡
(5/9) – RISKS IN FOCUS ⚡
• Internal Controls: Audit flagged issues, per Feb 25 filing 🔍
• Competition: Big players in AI server space 📉
• Volatility: High-growth sectors swing hard ❄️
Tough, but risks loom! 🛑
(6/9) – SWOT: STRENGTHS 💪
• Revenue Boom: 110% growth, $14,989.2 million in sales 🥇
• AI Focus: GPU servers crushing it 📊
• Global Reach: 32% international sales 🔧
Got rocket fuel in the tank! 🏦
(7/9) – SWOT: WEAKNESSES & OPPORTUNITIES ⚖️
• Weaknesses: Internal control concerns, per audit 📉
• Opportunities: AI infrastructure demand keeps soaring 📈
Can it fix the cracks and ride the wave? 🤔
(8/9) – 📢 SMCI’s revenue up 110%, with AI demand exploding, your take? 🗳️
• Bullish: Shares to $50+ soon, AI’s unstoppable 🐂
• Neutral: Steady, risks balance growth ⚖️
• Bearish: $35 looms, controls spook 🐻
Chime in below! 👇
(9/9) – FINAL TAKEAWAY 🎯
SMCI’s revenue surge to $14,989.2 million screams AI potential 📈, but control issues add a pinch of caution 🌿. Volatility’s our friend—dips are DCA gold 💰. Grab ‘em low, climb like pros! Gem or bust?

$LIT: EV's Lithium-Powered ETF – Charging Up or Running on EmptyAMEX:LIT : EV's Lithium-Powered ETF – Charging Up or Running on Empty?
EV demand is up 35% in 2023, and lithium prices are up 8% in 2025 so far. But AMEX:LIT is at $40.82, down from last year. Is it time to buy, hold, or sell? Let's dive in.
(1/9)
Good morning, everyone! ☀️EV demand is up 35% in 2023, and lithium prices are up 8% in 2025 so far. But AMEX:LIT is at $40.82, down from last year. Is it time to buy, hold, or sell? Let's dive in. 🔍
(2/9) – PRICE PERFORMANCE 📊
• Current Price: $ 40.82 💰
• Sector Trend: EV sales globally strong (35% growth in 2023, IEA) 🌟
It’s volatile, with EV growth as a tailwind! ⚙️
(3/9) – MARKET POSITION 📈
• Market Cap: Approximately $ 1.37B (based on $ 40.82 price and 33.5M shares, per Apr 30, 2024, data) 🏆
• Holdings: 40 stocks, top include Albemarle, Tesla (per Global X ETFs) ⏰
• Trend: Lithium demand tied to EV penetration, per IEA data 🎯
Firm, riding the battery wave! 🚀
(4/9) – KEY DEVELOPMENTS 🔑
• EV Demand: Continued rise in 2025, per general expectation and IEA trends 🔄
• Lithium Prices: Mixed, with spot prices varying; ETF at $ 40.82 reflects market conditions 🌍
• Market Reaction: Reflects current market dynamics, no specific Mar 3 data 📋
Adapting, EV surge drives interest! 💡
(5/9) – RISKS IN FOCUS ⚡
• Oversupply: Fears may cap lithium gains, per industry reports 🔍
• Competition: New battery tech could shift demand, per industry reports 📉
• Volatility: Lithium prices historically swing, per Reuters 2023 data ❄️
Tough, but risks loom! 🛑
(6/9) – SWOT: STRENGTHS 💪
• EV Growth: Demand for lithium batteries rising, per IEA 2023 data (35% global sales increase) 🥇
• Diversification: 40 holdings across mining, battery tech, per Global X ETF 📊
• Sector Leader: Exposure to Albemarle, Tesla, per Global X ETF 🔧
Got fuel in the tank! 🏦
(7/9) – SWOT: WEAKNESSES & OPPORTUNITIES ⚖️
• Weaknesses: Price volatility, current price down from last known, oversupply fears 📉
• Opportunities: EV sales growth, potential lithium price recovery based on demand, per IEA trends 📈
Can it capitalize on demand? 🤔
(8/9) – 📢 AMEX:LIT ’s at $ 40.82, EV demand climbing, your take? 🗳️
• Bullish: Price to rise with EV surge 🐂
• Neutral: Steady, risks balance ⚖️
• Bearish: Oversupply or other factors cap gains 🐻
Chime in below! 👇
(9/9) – FINAL TAKEAWAY 🎯
AMEX:LIT ’s EV demand drives potential 📈, but current price at $ 40.82 reflects market caution. Volatility bites, yet dips are our DCA gold 💰. We grab ‘em low, climb like pros! Gem or bust?

Trump Media ($DJT) – Truth Social’s Latest MovesTrump Media ( NASDAQ:DJT ) – Truth Social’s Latest Moves
(1/9)
Good afternoon, TradingView! 🌞 Trump Media ( NASDAQ:DJT ) is trending 📈, last at $ 29.23 per Feb 18, 2025, close (Yahoo Finance), down 3.82% that day. Q4 2024 showed a $ 401M loss, yet cash reserves hit $ 777M 🌿. Let’s dive into this social media play! 🔍
(2/9) – PRICE PERFORMANCE 📊
• Feb 18, 2025: $ 29.23, down 3.82% from $ 30.39 💰
• Q4 2024: Revenue at $ 1M, down from $ 1.1M year prior 📏
• Full Year 2024: $ 3.6M sales, $ 401M net loss 🌟
It’s volatile, with cash as a lifeline! ⚙️
(3/9) – MARKET POSITION 📈
• Market Cap: $ 6.43B as of Feb 18, 2025, per Yahoo 🏆
• User Base: 9M Truth Social sign-ups as of Feb 2024 ⏰
• Trend: Exploring M&A, per Feb 14 filing 🎯
Firm, betting on growth! 🚀
(4/9) – KEY DEVELOPMENTS 🔑
• Q4 Earnings: $ 401M loss reported Feb 14, 2025 🔄
• Expansion: Plans for Truth.Fi ETFs, per Feb 6 Reuters 🌍
• Market Reaction: Flat post-earnings, per CNBC 📋
Adapting, diversification’s key! 💡
(5/9) – RISKS IN FOCUS ⚡
• Losses: $ 401M hit in 2024, per Feb 14 filing 🔍
• Competition: Meta, X pressure social media 📉
• Regulation: Legal woes linger, per Feb 14 SEC ❄️
Tough, but risks loom large! 🛑
(6/9) – SWOT: STRENGTHS 💪
• Cash Reserves: $ 777M buffer, per Feb 14 filing 🥇
• Brand: Trump loyalty drives interest 📊
• Flexibility: M&A plans in motion 🔧
Got resilience in the tank! 🏦
(7/9) – SWOT: WEAKNESSES & OPPORTUNITIES ⚖️
• Weaknesses: Revenue down, losses up 📉
• Opportunities: Crypto ventures, M&A growth 📈
Can NASDAQ:DJT turn cash into wins? 🤔
(8/9) – NASDAQ:DJT ’s $ 23.93 , cash-rich but loss-heavy, your take? 🗳️
• Bullish: $ 35+ soon, M&A pays 🐂
• Neutral: Steady, risks balance ⚖️
• Bearish: $ -20 looms, losses weigh 🐻
Chime in below! 👇
(9/9) – FINAL TAKEAWAY 🎯
NASDAQ:DJT ’s $ 29.23 Feb 18 close masks $ 777M cash stash 📈, but $ 401M losses sting 🌿. Volatility bites, yet dips are our DCA gold 💰. We grab ‘em low, climb like pros! Gem or bust?

SOL emerging head & shoulder providing opportunitiesBYBIT:SOLUSDT has an emerging H&S structure that is providing opportunities described below, which can be utilised based on risk appetite and preference for a swing trade or investment.
Note: The overall chart structure at the moment is highly complex and pattern failure risks, such as that experienced with BYBIT:XRPUSDT remains very high.
Scenario
An H&S structure has emerged since 23 Dec 2024. Neckline support has been confirmed 3 times around: 11 Jan, 07 Feb and 12 Feb. The price is still close to the neckline providing opportunity for entry into trades and/or investment.
DCA entry into a longer term investment - recommended approach
Allocate a percentage of your portfolio's available fund to this as an asset to hold, decide upon how many months or weeks you would like to DCA into the total position (I recommend no less that 3 months and no more than 6) and begin DCA. This approach will safeguard against mistiming the start of the DCA now before the beginning of a bearish cycle, finally ending at an as yet unknown lower support level (of 4 potential candidate price levels stated further down the text below).
The case for beginning the investment approach now
The project remains solid and has established itself as a competitor to ETH. Furthermore, it is the layer 1 of choice for memecoins and has had more new projects use it that ETH recently. Additionally, overall positive market sentiment remains as do utterance (although no formal new policies of note) of the Trump administration and financial institutions towards crypto. Finally, the large gyrations in price recently are making it more difficult to judge appropriate SL levels thereby making trading of any kind less attractive at the moment.
The case against beginning the investment approach now
The future of the project, like most projects is still unknown (crypto is the most volatile and riskiest of assets for a reason!). Although the industry is maturing, it is possible a newer project can come and usurp the place of SOL. There are further support levels (130, 90, 55, 20) that can provide better DCA entry levels, and as market sentiment can change on an utterance of Musk or Trump, patience for a better entry point caused by further bearish moves might be wiser, particularly as on the weekly chart, SOL appears to be printing it's 2nd consecutive doji - implying market indecisiveness and no clear indication that the bulls are about to become incharge again. SOL has also double topped (mid Nov 24 and mid Jan 25), near the ATH (250), indicating either upcoming bearish sentiment or another uncertain attempt at breaking the ATH.
Swing trade
Entry: 200
TP:280 - near the absolute top of the head
SL: 160 - past the dragonfly candle of 13 Jan (this candle has the risk of indicating a new support leval and all traders must be wary of the 160-150 level as that was the support level in mid Oct 24 Additionally, 170 is also near the 200 EMA and crypto daily price gyrations are sometimes very large; therefore a daily low of a dragonfly and a EMA has the potential of being a support level that should be accounted for when setting a SL )
R/R: 1:2
The case for the swing trade
The rate of change indicated is trending upwards. The neckline has proven to be a support level and has been validated 3 times.
The against a swing trade
Other technical indicators like the RSI (middling with little upwards trend) and MACD (likewise) do not provide strong positive support for the trade thesis. Having found support at the 200 EMA and broken out of the downward trend since 20 Jan, there is a possibility that the price will just range between the 50 EMA and 200 EMA (approx. 210 and 180) unless there is further external, fundamental cause for upwards momentum. Previous momentum was driven largely by the optimistic market sentiment for crypto following on from Trump's election win. Finally, a R:R of 1:2 is generally not considered worthy of such a speculative trade.
Note: There is very little justification for a margin trade at the moment - the dragonfly candle on 03 Feb carries too much risk and invalidates a margin trade theses' risk/reward ratios. Margin trading this pair is best left to when a pattern emerges that is not part of a structure that includes the 03 Feb candlestick.

Tue 28th Jan 2025 Daily Forex Charts: 5x New Trade SetupsGood morning fellow traders. On my Daily Forex charts using the High Probability & Divergence trading methods from my books, I have identified 5x new trade setups this morning. As usual, you can read my notes on the charts for my thoughts on these setups. The trades being a BTC/USD Sell, XAG/USD Sell, AUD/CHF Buy, EUR/AUD Buy & a NZD/CHF Sell. I also discuss some trade management. Enjoy the day all. Cheers. Jim

NVDA closes below 200 Day SMANASDAQ:NVDA had a very bad day today with more than 550 billion $ Market Cap destroyed. This is one of the worst days for NVDA since March 2020. The 200 Da SMA price was 122 $. NVDA closed @ 118 $. This makes it a daily close below the 200 Day SMA. There might be some more downside and sideways movement before it starts a bullish upward trend before its earnings release on Feb 26. 6-12 Months down the line this might be one of the best buying opportunities. Long NVDA 110 $ - 120 $.

Dollar-Cost Averaging: The Simple Strategy Every Trader NeedsHello, Traders! 👋🏻
Timing the market is one of the most complicated challenges for any trader. The constant question of “Is this the right time to buy?” or “Should I wait for a better price?” creates hesitation and often leads to missed opportunities – or worse, emotional decisions.
That’s where Dollar Cost Averaging (DCA) comes in. DCA meaning? Rather than trying to predict market movements, DCA takes a disciplined, consistent approach to investing. By committing to regular investments over time, you smooth out the highs and lows, removing the stress of decision-making and allowing you to build your portfolio steadily.
In this article, we’ll dive into how DCA works, why it’s an effective strategy, and how to use it to stay in control. 🧘🏻
Why Is Market Timing So Hard (and How Does DCA Solve It)? What is Dollar Cost Averaging?
The allure of perfectly timing the market is strong. Who wouldn’t want to buy at the absolute bottom and sell at the peak? But the reality is that market timing typically turns into guesswork. Even with technical analysis, factors like sudden news events, regulatory changes, or shifts in market sentiment can make predictions unreliable. This uncertainty is especially true in the crypto industry, where prices can swing dramatically within hours. For many traders, this indecision can lead to two common pitfalls:
⏰Waiting Too Long. Hoping for a better entry point that never comes, missing out on gains.
😬Jumping in Emotionally. Chasing the market during a rally or panicking during a dip, only to see prices reverse shortly after.
Dollar Cost Averaging sidesteps all of this. Instead of trying to outsmart the market, you invest a fixed amount regularly – whether prices are up, down, or sideways. It’s a simple, effective way to participate in the market without letting emotions or second-guessing hold you back. Just strategy. Nothing extra. 🤷🏻
So, What’s the Secret? How DCA Works in Practice? DCA Investing
Commit to a Fixed Amount
With DCA crypto, you decide how much to invest each time – say, $100 weekly or $500 monthly. This amount stays consistent, no matter what the market is doing.
Stick to a Schedule
Regularity is key. By investing in a schedule (e.g., every Friday or the 1st of each month), you eliminate the need to decide when to enter the market.
Take Advantage of Volatility
When prices 📉, your fixed investment buys more of the asset. When prices rise, it buys less. Over time, this helps reduce your average cost, giving you an edge in volatile markets.
Use Auto-Investing Tools
Many crypto exchanges offer auto-investing features , making setting up and sticking to your DCA strategy easier. With these tools, you can automate recurring purchases of your chosen asset at regular intervals (weekly, biweekly, or monthly). All you need to do is select the asset, set the amount, and schedule the frequency. Once configured, the platform handles the rest, eliminating the risk of forgetting or deviating from your plan.
Example:
Imagine you’re investing $200 into Bitcoin (BTC) every 2 weeks.
Bitcoin DCA Example:
After 5 cycles, you’ve invested $1,000 and accumulated approximately 0.05 BTC at an average cost of $20,000—lower than the highest price during this period.
The Key Benefits of DCA
Soooo… Why is DCA a go-to strategy for many traders?
DCA removes the stress of guessing when to buy. You follow a plan and let the strategy do the work.
By investing during both highs and lows, your average cost tends to decrease over time.
Fear and Greed are the biggest enemies of consistent gains. DCA automates your investments, helping you avoid emotional decisions that could harm your portfolio.
Whether you’re buying Bitcoin, Ethereum, or even traditional assets like ETFs, DCA adapts to your goals and market preferences.
Regular investing instills good habits, encouraging you to focus on the long-term growth of your portfolio.
In conclusion, the markets will always have ups and downs, but with DCA, you don’t have to worry about catching every wave 🏄. Instead, you focus on building your portfolio steadily, one step at a time.

$BTC 1W Largest Scale Playing with Long Term Ideas #LongThis idea i made today for long term idea just as it is an idea some basic lines and formations were made but it was pretty simple using same red lines the decline lines are same angle as it states. showing prices and times as estimates i will come look at this and progression when iI m older and know more of this trading and chart mechanics etc!
I am not a Financial advisor or any way good with number.. sorry that's a lie I am very good with math but I haven't had to make financial gains on markets not crypto at least.! I have crypto but earned it all freely over short time last 2 years have over a few band only a couple,, but free earned and mostly passive about 70% passive :) anyway and so that makes it all gains but i do swap stuff at lows and highs and various coin swaps using special maths and tools no one else does a lot and take advantage of the "virtual arbitrage" between trading oone coin for another and then another .... if you get it you get it!
WHAT YOU THINK OF IDEA its one for me to come back to in years and look and go wow we were at 100k moment JUST like the 10k moment. Only I don't remember It so well!
hope you enjoy! let me know your opinion and what could be wrong or different! lets learn from one another and take over the markets!!!!

Mon 30th Dec 2024 AUD/NZD Daily Forex Chart Sell SetupGood morning fellow traders. On my Daily Forex charts using the High Probability & Divergence trading methods from my books, I have identified a new trade setup this morning. As usual, you can read my notes on the chart for my thoughts on this setup. The trade being a AUD/NZD Sell. Enjoy the day all. Cheers. Jim

Mon 16th Dec 2024 NZD/CHF Daily Forex Chart Buy SetupGood morning fellow traders. On my Daily Forex charts using the High Probability & Divergence trading methods from my books, I have identified a new trade setup this morning. As usual, you can read my notes on the chart for my thoughts on this setup. The trade being a NZD/CHF Buy. Enjoy the day all. Cheers. Jim

Mon 16th Dec 2024 EUR/GBP Daily Forex Chart Buy SetupGood morning fellow traders. On my Daily Forex charts using the High Probability & Divergence trading methods from my books, I have identified a new trade setup this morning. As usual, you can read my notes on the chart for my thoughts on this setup. The trade being a EUR/GBP Buy. Enjoy the day all. Cheers. Jim

So the Bull market started you said? :) Long $BTCTechnical and Fundamental look into Bitcoin.
Bitcoin has recently achieved an all-time high (ATH) of around $104,000. The current trading price is slightly below this peak, suggesting a possible consolidation or minor pullback.
The chart here indicated that Bitcoin is currently trading just above a significant resistance level at approximately $102,934.71, which could now act as a new support if the price holds above this level. There's another resistance level higher up, indicating where the price might face selling pressure if it attempts to rise further.
This pattern/idea shows support levels at around $59,022.02, which is quite substantial, suggesting that this was where buyers have historically stepped in. A break below this level could indicate a deeper correction, but as of now, the price is far above this support, indicating STRONG BULLISH SENTIENT.
For this chart's trend it shows clearly that it has been predominantly bullish, with a series of HIGHER HIGHS and HIGHER LOWS! More Bullish Sentiment! The presence of green candlesticks in recent days suggests that the market has been closing higher than it opened , indicating continued buying interest. However, the presence of some red candlesticks near the ATH might signal profit-taking or a short-term bearish sentiment.
The volume on this chart or the indicator at the bottom of the chart shows increased trading volume as Bitcoin approached its ATH, which is typical when prices reach new highs. This could mean that there is significant interest in Bitcoin at these levels, but it also suggests that any move up or down could be volatile.
The Indicators over the chart in red and green arrows indicate the potential buy or sell signals based on various indicators or patterns. If these are based on moving average crossovers, RSI divergence, or other momentum indicators, they could be suggesting entry or exit points for traders.
Conclusion:
If the price can break and close above the higher resistance level with significant volume, it might signal the continuation of the bullish trend, potentially targeting new highs.
Conversely, if the price fails to break this resistance and starts forming lower highs, it might be a sign of a potential reversal or at least a period of consolidation. Watch for any bearish divergence in momentum indicators like the RSI or MACD, which could warn of a potential downturn. For those considering entering a long position, waiting for a pullback to the current resistance-turned-support level could offer a better risk-reward ratio, as this level might now attract buyers. Given the proximity to the ATH, traders should also be cautious of overbought conditions, which might lead to a sharp correction. Setting stop-losses below key support levels would be prudent.
PLEASE REMEMBER: Trading Cryptocurrencies like Bitcoin can be highly volatile, and while technical analysis can provide insights, external factors like regulatory news, macroeconomic conditions, and market sentiment can greatly influence price movements. Always do thorough research and consider your risk tolerance before making trading decisions. THIS IS NOT INTENDED AS FINANCIAL ADVICE. Rather a self help and documentation of my own journey into cryptocurrency! Let's make sure we leave nice comments and leave or talk about what is useful! But random comments are OK! :)

XRP: Accumulation Zone Hello Team,
Ripple XRP has now entered into the 5-year accumulation zone from 0.14-0.35 Cents.
- At this price point and as the price drops more will present long-term buying opportunities for the future in the form of "Dollar Cost Averaging".
XRP has a large potential for future upside movement if the SEC case is dropped and due to a large number of partnerships & use-cases acquired.
Don't expect a miracle overnight.

MA OSCILLATOR RISK METRIC | CYCLE 4 ATH UPDATE The MA OSCILLATOR RISK METRIC is an excellent custom indicator developed to help investors to DCA in and out of underbought / overheated periods of the market. Applying principals with BTC's CYCLE 4 current progress if BTC remains within historic trends then this also supports the time periods discuss in the below post.

Will Bitcoin Repeat History or Continue The Cup N HandleFalse Break Out Or Cup N Handle Continuation
1. Bitcoins most recent price action is looking pretty similar to what we experiened back in 2019-2020.
2. Bitcoin is also showing signs of a large Cup and Handle pattern which you can clearly see on the weekly.
3. If the Cup N Handle patter decides to continue playing out. I will continue my plan to just DCA on a weekly basis.
4. If History does decides to repeat what happened in 2019-2020. I will still continue to DCA weekly on the way down. BUT Wait until price falls into my 62-87.6% Fib Zone or $37,750-$22,500 to start Doubling Down on my DCA
5. My Plan is keep my blood pressure low not to predict the tops or bottoms. But to put myself in a good enough position no matter the market direction. And to continue my simple strategy to DCA.
Thank You and God Bless.
