AAVE Hidden bearish divergence on the daily playing outEURONEXT:AAVE
🎯 The path from last week’s analysis is being followed, so far. Price printed a bullish engulfing candle breaking above the daily pivot, but was ultimately rejected at the R1 pivot, now testing the daily pivot and High Volume Node as support. The downtrend is intact. The first target for continued upside is the daily 200EMA and High Volume Node resistance at $210. Overcoming the daily 200EMA will add confluence to a major bottom being in. Wave (C) of triangle wave (D) appears to be underway.
📈 Daily RSI printed hidden bearish divergence which is playing out.
👉 Analysis is invalidated if we drop below $148, keeping wave (B) alive.
Safe trading
DEFI

I took a speculative position in AAVE on a small amount.CRYPTOCAP:AAVE #AAVE
I took a speculative position in AAVE on a small amount.
Stop loss at $160.59.
Take Profit: $229.00
It's one of the top-5 coins in the DeFi sector:
dropstab.com
Looking at the liquidations, they swept a bunch of important long traders' stops.
Let's see how this trade plays out.
Snapshot:

TradeCityPro | RAY Near Resistance, Watching for Breakout👋 Welcome to TradeCityPro!
In this analysis, I want to review the RAY coin for you — one of the DeFi projects in the Solana ecosystem, which has a market cap of $313 million and is ranked 130th on CoinMarketCap.
🗓 Daily TimeFrame
This coin has a downtrend on the 4-hour timeframe that continued down to the 0.883 area, and it is currently in a corrective phase.
💥 During this correction and price consolidation, a range box between 0.883 and 1.242 has formed, and price has been moving sideways between these two levels.
✔️ After price was supported at 0.883, buying volume increased, and the price gained a strong bullish momentum.
⭐ At the moment, RAY is interacting with the 1.242 resistance, and breaking this level will be the first trigger for a long position.
💡 I personally will open a long position after the break of 1.242. The next resistance area is 1.675.
✨ If price gets rejected from 1.242, it can move downward again, and in this case, breaking the triggers 0.996 or 0.883 will give us short positions.
🧮 Since this coin has been in a downtrend previously, breaking 0.996 and 0.883 can continue the downtrend, and strong bearish momentum will enter the market with the break of these levels.
⛏ But for the market to become bullish, for now we don’t have much bullish momentum, and we need more confirmations.
📝 Final Thoughts
Stay calm, trade wisely, and let's capture the market's best opportunities!
This analysis reflects our opinions and is not financial advice.
Share your thoughts in the comments, and don’t forget to share this analysis with your friends! ❤️

AAVE Short-term analysis | Trading and expectationsCRYPTOCAP:AAVE
🎯 Price printed a bullish engulfing candle from daily RSI bullish divergence and High Volume Node support. It is currently testing the pivot. Overcoming this will add confidence to the bullish move, with a first target of the daily 200EMA and High Volume Node resistance at $220. Overcoming the daily 200EMA will add confluence to a major bottom being in.
📈 Wave (C) of triangle wave (D) appears to be underway. Daily RSI sits at the channel EQ and is crossed bullishly.
👉 Analysis is invalidated if we drop below $148, keeping wave (B) alive.
Safe trading

CELO at a Key Inflection Point | Price OutlookELO has been consolidating since mid-December after a steep 62% decline from November’s highs.
📅 Thursday’s upcoming event could be the catalyst to break this range.
🔼 Bullish Scenario:
Breakout above $0.1318 could target resistance near $0.1401, within December 15’s bearish weekly void.
Further upside may stall at $0.1438–$0.1463, overlapping multiple voids and October’s swing low.
🔽 Bearish Scenario:
First support sits at $0.1227 (Jan 3 daily void), with confluence from:
$0.1215 (Dec 30 rejection),
$0.1197 (Dec 22 weekly rejection), and
$0.1089 (Jan 1 swing low).
These are key zones where accumulation and stop defense may be active.

AAVE - Macro analysis | The bigger picture | Long-term holdersEURONEXT:AAVE
🎯 I am still looking at this multiyear triangle to break out to the upside with a terminal target of $670, the all-time High Volume Node resistance. Price is rangebound between $440 and $130 and appears to have completed triangle wave (C). Wave (D) is next, with a target of the upper boundary trend-line ~$340.
📈 Price is below the weekly 200EMA and pivot, reflecting the recent bearish trend, but finding support with bullish divergence in the RSI, suggesting a major bottom is forming. Wave (A) found terminal support at the golden pocket Fibonacci retracement.
👉 Analysis is invalidated below wave (A) or wave (B). This asset has been one of the best assets for trading signals in the last 3 years, sticking to the rules strictly.
Safe trading

TradeCityPro | AAVE at Key Support, Waiting for Trend Trigger👋 Welcome to TradeCityPro!
In this analysis, I want to review the AAVE coin for you. One of the popular DeFi projects, which with a market cap of $2.52 billion, is ranked 36th on CoinMarketCap.
🗓 Daily timeframe
On the daily timeframe, AAVE started a downtrend after stabilizing below the 261.98 zone, and with the bearish structure it had, it dropped down to the 144.61 level.
🎲 There is a support zone between 144.61 and 157.43, which the coin has currently been supported from, and it could start its upward move from this area.
✨ The main resistance that price is currently dealing with is 202.53, and as long as price does not stabilize above it, a bullish trend will not begin.
🎯 So, for a long position or spot buying, the trigger we have on this coin is 202.53.
↗️ However, if the downtrend continues and a lower high below 202.53 is formed, we can open a short position with the break of 144.61.
⚡️ The next support that AAVE currently has is 124.79, and price could drop to this zone in the next bearish leg.
📝 Final Thoughts
Stay calm, trade wisely, and let's capture the market's best opportunities!
This analysis reflects our opinions and is not financial advice.
Share your thoughts in the comments, and don’t forget to share this analysis with your friends! ❤️

TradeCityPro | ATOM Testing Support as Bears Dominate👋 Welcome to TradeCityPro’s first analysis of 2026!
In this analysis, I want to review the ATOM coin for you. One of the DeFi projects in the Osmosis ecosystem, which with a market cap of $937 million is ranked 63rd on CoinMarketCap.
⏳ 4-hour timeframe
On the 4-hour timeframe, this coin has a bearish trend and has now entered a correction and ranging phase, preparing to start its next move.
✨ The main support level we have on ATOM is 1.834. However, the price has also formed another support at 1.916, which it has previously touched several times and has now reached again.
✔️ After the previous bearish wave ended, the price corrected upward, and after reaching 2.103, bearish momentum entered the market again.
🧮 Currently, the price is sitting on the 1.916 support. Given the bearish momentum and the increasing selling volume, the probability of breaking 1.916 has increased.
⚡️ With the break of 1.916, we can open a short position.The main trigger for confirming ATOM turning bearish is the break of the 1.834 level.
⛏ However, if the price gets supported from this area and moves upward, breaking 2.103 will give us the first confirmation of ATOM turning bullish.
📈 Personally, I prefer to only open short positions on ATOM for now, since it has a strong bearish trend, and for long positions, we can use other coins that have bullish structures.
📝 Final Thoughts
Stay calm, trade wisely, and let's capture the market's best opportunities!
This analysis reflects our opinions and is not financial advice.
Share your thoughts in the comments, and don’t forget to share this analysis with your friends! ❤️

TradeCityPro | XLM Trapped in Range, Awaiting Breakout Trigger👋 Welcome to TradeCity Pro!
In this analysis, I want to review XLM, one of the DeFi and RWA coins, which with a market cap of $7.72 billion is ranked 15th on CoinMarketCap.
⏳ 4-hour timeframe
On the 4-hour timeframe, this coin has formed a large range box, and for several weeks it has been moving inside this range.
✔️ The bottom of this box is at 0.22826, and the top of the box is at 0.25960, and currently the price is moving in the middle of this box.
📊 A smaller range box has also formed inside the main box, which is between the zones 0.23593 and 0.2467.
⛏ If either 0.23593 or 0.2467 breaks, we can open a short-term position with low risk. However, the main triggers are the break of the main box’s support and resistance.
⭐ So for a short position, the main trigger is 0.22826, and the early trigger is 0.23593.
⚖️ For a long position, breaking 0.2596 is the main trigger, and breaking 0.2467 is the early trigger.
📝 Final Thoughts
Stay calm, trade wisely, and let's capture the market's best opportunities!
This analysis reflects our opinions and is not financial advice.
Share your thoughts in the comments, and don’t forget to share this analysis with your friends! ❤️

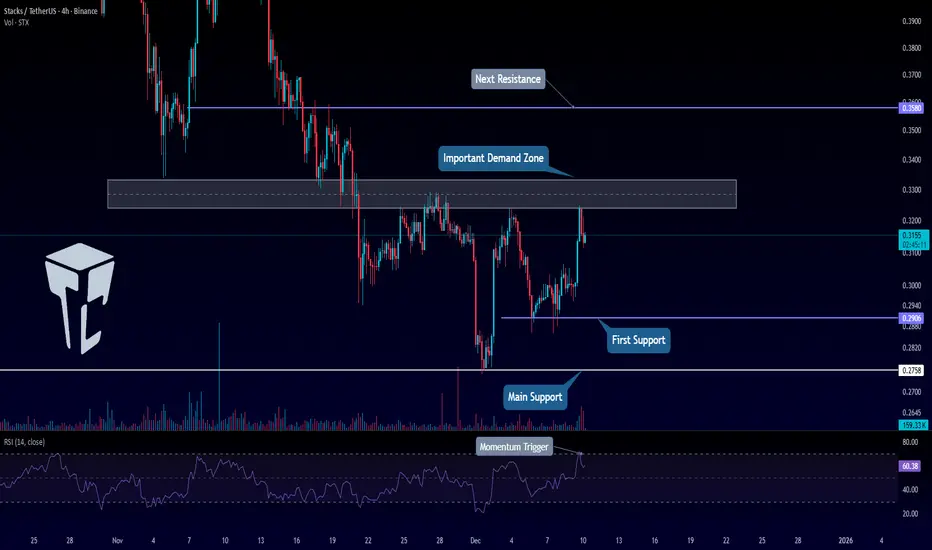
TradeCityPro | STX Facing Key Resistance, Bears in Control👋 Welcome to TradeCity Pro!
In this analysis, I want to review STX, one of the Bitcoin ecosystem projects, currently ranked 87th on CoinMarketCap with a $573 million market cap.
⏳ 4-Hour Timeframe
As you can see, on the 4-hour timeframe, STX is dealing with a resistance zone that it has touched several times before, and now it has reached this zone again.
✔️ After reaching this level, the volume of the red candles rejecting from this zone has been increasing, which shows the weakness of buyers and the strength of sellers at this level.
📊 If selling volume continues to increase, there is a possibility of price moving towards the support zones of 0.2906 and 0.2758.
💡 So, we can open a short position either after breaking the structure in lower timeframes or by breaking these zones 0.2906 and 0.2758.
💥 For a long position, breaking the range will be the first long trigger and the first confirmation for the coin turning bullish.
🎲 The next important resistance zones are 0.3580 and 0.4359, and breaking these levels will give us the main confirmations for a bullish trend.
🎯 On the other hand, if RSI enters the overbought zone, we can confirm the entry of bullish momentum into the market, increasing the likelihood of breaking the resistance zone.
📝 Final Thoughts
Stay calm, trade wisely, and let's capture the market's best opportunities!
This analysis reflects our opinions and is not financial advice.
Share your thoughts in the comments, and don’t forget to share this analysis with your friends! ❤️
TradeCityPro | GRT Testing Key Support in Wide Range Structure👋 Welcome to TradeCity Pro!
In this analysis I want to review the GRT coin for you. One of the DeFi and Solana ecosystem projects that with a market cap of 481 million dollars is ranked 95 on CoinMarketCap.
⏳ 1-hour timeframe
In the 1-hour timeframe, a range box has formed between the zones 0.04491 and 0.4693, and the price has been fluctuating between these two zones for several days.
💥 The zone 0.04491 is a very important support for this coin, and breaking it or being supported from it can start the next movement wave on GRT.
🎯 Since in the higher timeframes like daily and weekly its trend is bearish, then with the break of 0.04491 this trend can continue and we can open a short position with it.
⚡️ If the price is supported from this zone and moves toward the 0.4693 top, we can open a long position by breaking 0.4693.
⚖️ This trigger is the first trigger for a long and is considered a risky trigger. I prefer to wait to get more confirmations for this coin turning bullish.
📊 For now, the main trigger for GRT to turn bullish will be the break of its main resistance at 0.05014.
❌ Disclaimer ❌
Trading futures is highly risky and dangerous. If you're not an expert, these triggers may not be suitable for you. You should first learn risk and capital management. You can also use the educational content from this channel.
Finally, these triggers reflect my personal opinions on price action, and the market may move completely against this analysis. So, do your own research before opening any position.

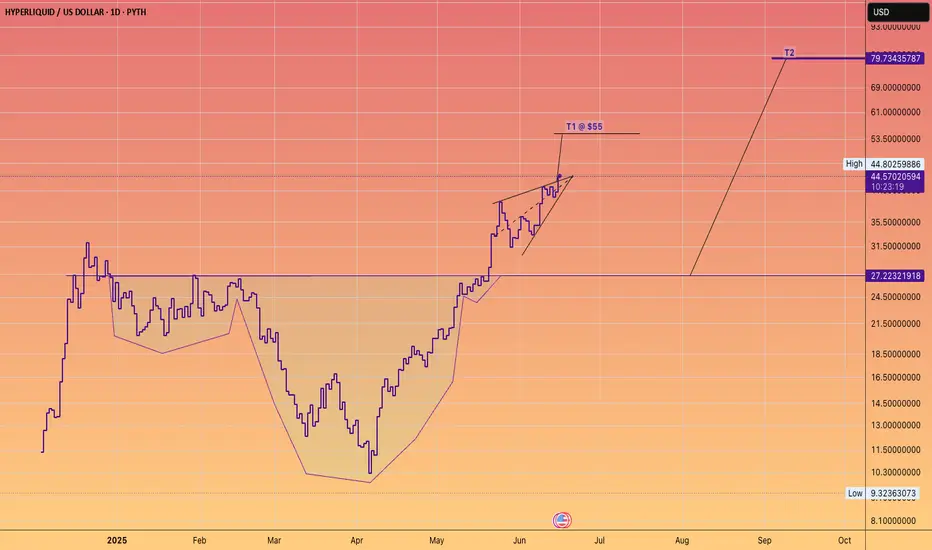
TradeCityPro | HYPE Near Breakdown Zone, Bears Gaining Control👋 Welcome to TradeCityPro!
In this analysis, I want to review HYPE, one of the well-known decentralized exchanges in crypto. The exchange’s native token currently has a $10.46 billion market cap, ranking 11th on CoinMarketCap.
🗓 Daily Timeframe
On the daily timeframe, this coin had been moving inside a rising channel, which was already broken in the previous analysis, and we were waiting for its trigger to activate.
✔️ The trigger for confirming the channel breakdown was 36.682, but since there was a major support zone right beneath it, we needed to wait for the price to stabilize below that support to confirm a bearish trend.
📊 After reacting to 36.682, the price made a deep pullback to the channel, and after getting rejected from the channel again, it continued moving downward.
💥 Following this pullback, the RSI dropped back below the 50 level, signaling a return of bearish momentum, and all that remained was a price confirmation for the downtrend to fully establish.
🧮 After breaking 36.682, the price reached the $30 zone for the first time and reacted to it. Currently, after pulling back to 36.682, the price looks ready to continue its bearish move.
🔔 The confirmation for HYPE turning fully bearish comes with a break of 29.9.
Once this level breaks, we can open a short position.
⚖️ RSI staying below 50 and avoiding any overbought conditions — along with weak buying volume — are strong signs that the bearish trend can continue.
As long as RSI remains under the 50 zone, the market structure remains bearish in my view.
📝 Final Thoughts
Stay calm, trade wisely, and let's capture the market's best opportunities!
This analysis reflects our opinions and is not financial advice.
Share your thoughts in the comments, and don’t forget to share this analysis with your friends! ❤️

#ERAUSDT #1D (Bitget Futures) Descending channel on support LONGCaldera just printed a morning star on daily with good bounce back volume, bottom seems likely.
⚡️⚡️ #ERA/USDT ⚡️⚡️
Exchanges: Bitget Futures
Signal Type: Regular (Long)
Leverage: Isolated (1.3X)
Amount: 4.8%
Current Price:
0.2508
Entry Zone:
0.2503 - 0.2187
Take-Profit Targets:
1) 0.3245
2) 0.3921
3) 0.4598
Stop Targets:
1) 0.1593
Published By: @Zblaba
EURONEXT:ERA BITGET:ERAUSDT.P #1D #Caldera #RaaS #Rollups #DeFi caldera.xyz
Risk/Reward= 1:1.2 | 1:2.1 | 1:3.0
Expected Profit= +49.9% | +87.4% | +124.9%
Possible Loss= -41.7%
Estimated Gaintime= 1-2 months

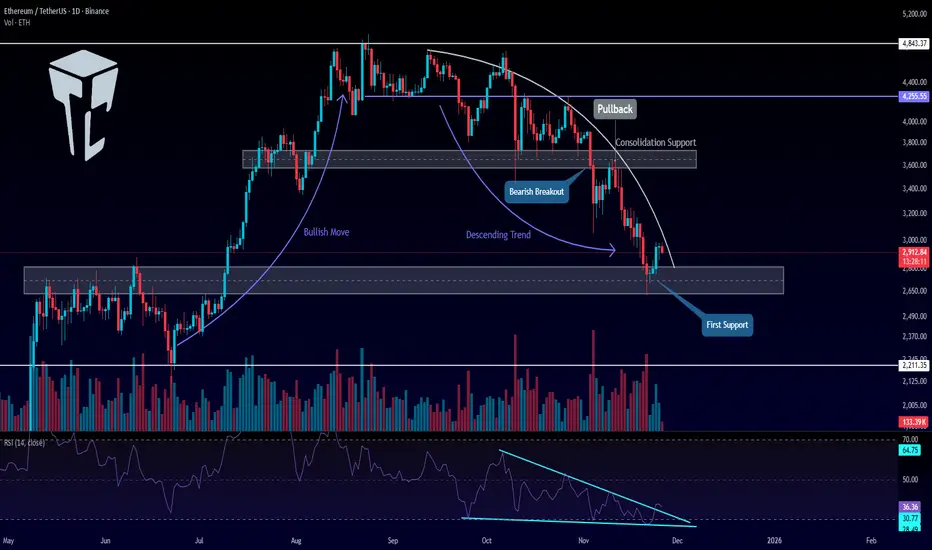
TradeCityPro | Ethereum Eyes Key Levels for Trend Reversal👋 Welcome to TradeCityPro!
Let’s dive into the Ethereum analysis, the queen of the market, ranked 2nd on CoinMarketCap with a $351 billion market cap, right after Bitcoin.
📅 Daily Timeframe
On the daily timeframe, after the upward movement Ethereum made, it reached the 4,843 resistance zone and then entered a consolidation phase.
✅ The bottom of this range was at 3,700, and the middle of the box was at 4,255, which the price reacted to.
🔔 After breaking the lower boundary of the box, the bullish trend Ethereum had came to an end, and a bearish trend with a curved trendline began.
⚖️ After a pullback to the 3,700 zone, a downward move took place, reaching the next support zone at 2,700, and now the price is reacting to the 2,700 zone.
💥 The RSI oscillator formed a descending triangle during this move, which contributed to the increasing bearish momentum in the market.
💡 Now, with the price reaching 2,700, the triangle has broken to the upside, and the bearish momentum has slowed down for now.
🎲 The confirmation of the new bullish momentum will come after breaking the curved trendline and forming a higher high and higher low above the 2,700 level.
📈 The main trigger for Ethereum's bullish trend will be stabilization above 3,700.
⚡️ If the 2,700 level breaks, the next support zone will be at 2,211.
💫 Personally, I’ll try to open a short position on Ethereum if the 2,700 level breaks.
🔼 For a long position, triggers can be found on lower timeframes, but for the main positions, we should wait for the price to form a higher high and higher low.
📝 Final Thoughts
Stay calm, trade wisely, and let's capture the market's best opportunities!
This analysis reflects our opinions and is not financial advice.
Share your thoughts in the comments, and don’t forget to share this analysis with your friends! ❤️
AAVE Local, bottoming soon?Locally, price continues bearish after falling out of the wedge, completing wave (B) of the macro triangle. Price action looks ready to reverse
Wave © appears complete after the big drop, black swan event- Oct 10th. I was looking for a dip back into the long lower wick, which we have and price is finding support. This suggests we grind higher from here, but we must get through the daily 200EMA, just above the High Volume Node resistance and daily pivot. This area will be tough to crack and was rejected on the first attempt.
📈 Daily RSI has printed bullish divergence from the oversold threshold- a bottoming signal.
👉 Continued downside has a next target of $114.
Safe trading

TradeCityPro | LDO Support Zone: Is a Trend Reversal Coming?👋 Welcome to TradeCityPro!
In this analysis, I want to review the LDO coin for you, one of the DeFi projects with a $634 million market cap, currently ranked 87th on CoinMarketCap.
⏳ 4-Hour Timeframe
On the 4-hour timeframe, this coin is sitting on a very important support level, which has already been tested twice.
✔️ Overall, a downtrend is visible on the LDO chart, and breaking this support zone could allow the price to continue moving within this bearish structure.
⭐ If this support breaks, we can open a short position.The next support zone the price may head toward is 0.6229.
💥 If the coin gets supported at this level instead, the first long trigger will be the 0.7840 level.A stabilization above this level will be the first sign of bullish momentum returning.
💡 The main trend-reversal triggers are 0.8962 and 1.0209.For spot buying, we can wait for a breakout of these levels.
🛒 However, for spot entries, besides these triggers, I also wait for confirmation from macro indicators such as Others.D and BTC.D.I do not enter based solely on price confirmation.
📝 Final Thoughts
Stay calm, trade wisely, and let's capture the market's best opportunities!
This analysis reflects our opinions and is not financial advice.
Share your thoughts in the comments, and don’t forget to share this analysis with your friends! ❤️

(TOSHI) toshi Is Toshi a fluke this year? So far, the price of the meme has not left the price of the origin starting price. 10 months and no change in price for long term holders, not great. Meme stability not a fluke? The price is not lower than the starting price and that is not always a bad thing because keeping money is better then losing money.

TradeCityPro | CRV in a Key Zone: Watch for Breakouts or Drops👋 Welcome to TradeCity Pro!
Let’s dive into the CRV coin analysis. It's one of the popular DeFi projects, with a market cap of $608 million, currently ranked 89th on CoinMarketCap.
⏳ 4-Hour Timeframe
On the 4-hour timeframe, this coin is currently sitting on a very important support level and has just bounced up from it.
✔️ In this recent bearish leg, as Bitcoin’s dominance dropped, most altcoins declined less than Bitcoin.
One of these altcoins is CRV, which, as you can see, hasn’t yet lost its support zone.
🔽 For a short position, we can enter if the support level breaks. For an early entry, considering the bearish trend of this coin, we can use momentum triggers like candlestick setups.
🧩 On the other hand, if the price can stabilize above 0.4496, it will be the first sign of a trend reversal to the upside, and we can use this trigger to open a long position.
💡 Personally, I prefer to wait until the price forms a higher high and higher low above 0.4496 before entering. The main confirmation of the trend change will come after breaking 0.5240.
📝 Final Thoughts
Stay calm, trade wisely, and let's capture the market's best opportunities!
This analysis reflects our opinions and is not financial advice.
Share your thoughts in the comments, and don’t forget to share this analysis with your friends! ❤️

#UNI --- Uniswap to soar back into the 20'sAs a brand
how do u compete with a leader
Uniswap being the leader of on-chain exchange
Coke is the brand to invest in
(what stock did Buffet buy?)
not Pepsi
not RC cola
Do you get where I'm coming from
And I am not getting into to who, what or how
they have been infiltrated
but clearly they have
As an investor
you MUST pick the best of breed
That has historically been the best route to success.
UNI to rip is my prediction

FIL - Momentum Shift Confirmed!📈After months of trading within a bearish descending channel, FIL has finally broken out with a strong bullish impulse, signaling a clear shift in market momentum. This breakout marks a potential end to the prolonged downtrend and the beginning of a new bullish phase.
🏹From here, I’ll be looking for trend-following long setups on every healthy correction, ideally after retesting the broken structure zone. The next key target lies around the $5 round number, which also aligns with a major resistance area on the higher timeframe.
⚔️As long as FIL holds above the previous breakout zone, the bulls remain in control.
⚠️ Disclaimer: This is not financial advice. Always do your own research and manage risk properly.
📊All Strategies Are Good; If Managed Properly!
~Richard Nasr

#ARPAUSDT #1D (ByBit) Chuvashov's fork breakoutARPA did a V-shaped recovery with great increase in volume and about to regain 200MA support.
Golden cross seems around the corner, looks very likely to rally mid-term.
⚡️⚡️ #ARPA/USDT ⚡️⚡️
Exchanges: ByBit USDT
Signal Type: Regular (Long)
Leverage: Isolated (2.0X)
Amount: 4.6%
Entry Targets:
1) 0.02233
Take-Profit Targets:
1) 0.03456
Stop Targets:
1) 0.01743
Published By: @Zblaba
$ARPA BYBIT:ARPAUSDT.P #1D #DeFi arpanetwork.io
Risk/Reward= 1:2.5
Expected Profit= +109.5%
Possible Loss= -43.9%
Estimated Gaintime= 1-2 months

Don't fight the HYPE train!The James Wynn saga was wonderful advertising for the platform.
(Maybe it was staged).
Either way #Hyperliquid goes higher.
HOME/USDT | $HOME Rebounds Strongly – Bulls Aiming for More GainBy analyzing the #HOME chart on the 1-hour timeframe, we can see that after a pullback to $0.02050, the price started to rise again and successfully hit all three targets — $0.02350, $0.02375, and $0.02410 — delivering over 18% profit.
Currently, #HOME is trading around $0.022, and as long as it holds above $0.0215, we can expect further bullish movement. Hope you made the most out of this setup!
Please support me with your likes and comments to motivate me to share more analysis with you and share your opinion about the possible trend of this chart with me !
Best Regards , Arman Shaban
