TradeCityPro | LDO Support Zone: Is a Trend Reversal Coming?👋 Welcome to TradeCityPro!
In this analysis, I want to review the LDO coin for you, one of the DeFi projects with a $634 million market cap, currently ranked 87th on CoinMarketCap.
⏳ 4-Hour Timeframe
On the 4-hour timeframe, this coin is sitting on a very important support level, which has already been tested twice.
✔️ Overall, a downtrend is visible on the LDO chart, and breaking this support zone could allow the price to continue moving within this bearish structure.
⭐ If this support breaks, we can open a short position.The next support zone the price may head toward is 0.6229.
💥 If the coin gets supported at this level instead, the first long trigger will be the 0.7840 level.A stabilization above this level will be the first sign of bullish momentum returning.
💡 The main trend-reversal triggers are 0.8962 and 1.0209.For spot buying, we can wait for a breakout of these levels.
🛒 However, for spot entries, besides these triggers, I also wait for confirmation from macro indicators such as Others.D and BTC.D.I do not enter based solely on price confirmation.
📝 Final Thoughts
Stay calm, trade wisely, and let's capture the market's best opportunities!
This analysis reflects our opinions and is not financial advice.
Share your thoughts in the comments, and don’t forget to share this analysis with your friends! ❤️
DEFI

(TOSHI) toshi Is Toshi a fluke this year? So far, the price of the meme has not left the price of the origin starting price. 10 months and no change in price for long term holders, not great. Meme stability not a fluke? The price is not lower than the starting price and that is not always a bad thing because keeping money is better then losing money.

TradeCityPro | CRV in a Key Zone: Watch for Breakouts or Drops👋 Welcome to TradeCity Pro!
Let’s dive into the CRV coin analysis. It's one of the popular DeFi projects, with a market cap of $608 million, currently ranked 89th on CoinMarketCap.
⏳ 4-Hour Timeframe
On the 4-hour timeframe, this coin is currently sitting on a very important support level and has just bounced up from it.
✔️ In this recent bearish leg, as Bitcoin’s dominance dropped, most altcoins declined less than Bitcoin.
One of these altcoins is CRV, which, as you can see, hasn’t yet lost its support zone.
🔽 For a short position, we can enter if the support level breaks. For an early entry, considering the bearish trend of this coin, we can use momentum triggers like candlestick setups.
🧩 On the other hand, if the price can stabilize above 0.4496, it will be the first sign of a trend reversal to the upside, and we can use this trigger to open a long position.
💡 Personally, I prefer to wait until the price forms a higher high and higher low above 0.4496 before entering. The main confirmation of the trend change will come after breaking 0.5240.
📝 Final Thoughts
Stay calm, trade wisely, and let's capture the market's best opportunities!
This analysis reflects our opinions and is not financial advice.
Share your thoughts in the comments, and don’t forget to share this analysis with your friends! ❤️

#UNI --- Uniswap to soar back into the 20'sAs a brand
how do u compete with a leader
Uniswap being the leader of on-chain exchange
Coke is the brand to invest in
(what stock did Buffet buy?)
not Pepsi
not RC cola
Do you get where I'm coming from
And I am not getting into to who, what or how
they have been infiltrated
but clearly they have
As an investor
you MUST pick the best of breed
That has historically been the best route to success.
UNI to rip is my prediction

FIL - Momentum Shift Confirmed!📈After months of trading within a bearish descending channel, FIL has finally broken out with a strong bullish impulse, signaling a clear shift in market momentum. This breakout marks a potential end to the prolonged downtrend and the beginning of a new bullish phase.
🏹From here, I’ll be looking for trend-following long setups on every healthy correction, ideally after retesting the broken structure zone. The next key target lies around the $5 round number, which also aligns with a major resistance area on the higher timeframe.
⚔️As long as FIL holds above the previous breakout zone, the bulls remain in control.
⚠️ Disclaimer: This is not financial advice. Always do your own research and manage risk properly.
📊All Strategies Are Good; If Managed Properly!
~Richard Nasr

#ERAUSDT #1D (Bitget Futures) Descending channel on support LONGCaldera just printed a morning star on daily with good bounce back volume, bottom seems likely.
⚡️⚡️ #ERA/USDT ⚡️⚡️
Exchanges: Bitget Futures
Signal Type: Regular (Long)
Leverage: Isolated (1.3X)
Amount: 4.8%
Current Price:
0.2508
Entry Zone:
0.2503 - 0.2187
Take-Profit Targets:
1) 0.3245
2) 0.3921
3) 0.4598
Stop Targets:
1) 0.1593
Published By: @Zblaba
EURONEXT:ERA BITGET:ERAUSDT.P #1D #Caldera #RaaS #Rollups #DeFi caldera.xyz
Risk/Reward= 1:1.2 | 1:2.1 | 1:3.0
Expected Profit= +49.9% | +87.4% | +124.9%
Possible Loss= -41.7%
Estimated Gaintime= 1-2 months

#ARPAUSDT #1D (ByBit) Chuvashov's fork breakoutARPA did a V-shaped recovery with great increase in volume and about to regain 200MA support.
Golden cross seems around the corner, looks very likely to rally mid-term.
⚡️⚡️ #ARPA/USDT ⚡️⚡️
Exchanges: ByBit USDT
Signal Type: Regular (Long)
Leverage: Isolated (2.0X)
Amount: 4.6%
Entry Targets:
1) 0.02233
Take-Profit Targets:
1) 0.03456
Stop Targets:
1) 0.01743
Published By: @Zblaba
$ARPA BYBIT:ARPAUSDT.P #1D #DeFi arpanetwork.io
Risk/Reward= 1:2.5
Expected Profit= +109.5%
Possible Loss= -43.9%
Estimated Gaintime= 1-2 months

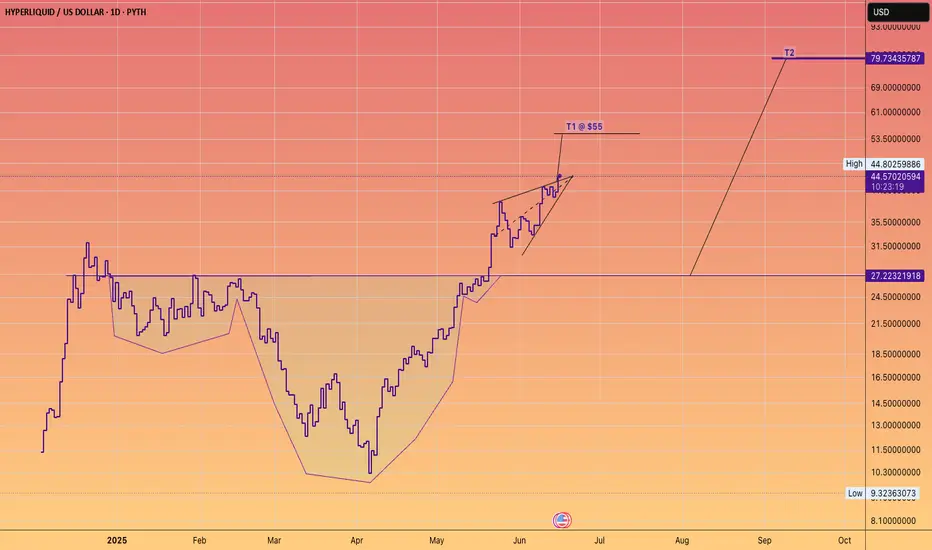
Don't fight the HYPE train!The James Wynn saga was wonderful advertising for the platform.
(Maybe it was staged).
Either way #Hyperliquid goes higher.
HOME/USDT | $HOME Rebounds Strongly – Bulls Aiming for More GainBy analyzing the #HOME chart on the 1-hour timeframe, we can see that after a pullback to $0.02050, the price started to rise again and successfully hit all three targets — $0.02350, $0.02375, and $0.02410 — delivering over 18% profit.
Currently, #HOME is trading around $0.022, and as long as it holds above $0.0215, we can expect further bullish movement. Hope you made the most out of this setup!
Please support me with your likes and comments to motivate me to share more analysis with you and share your opinion about the possible trend of this chart with me !
Best Regards , Arman Shaban

ETH/USDT | Ethereum Rebounds Strongly – Eyes on $5K Next!By analyzing the #Ethereum chart on the weekly timeframe, we can see that after our previous analysis, price continued to rise and reached as high as $4,200. It is currently trading around $3,800, and if it can hold above this level, we could expect further upside movement.
The next potential bullish targets are $4,300, $4,500, $5,000, and $5,500.
Please support me with your likes and comments to motivate me to share more analysis with you and share your opinion about the possible trend of this chart with me !
Best Regards , Arman Shaban

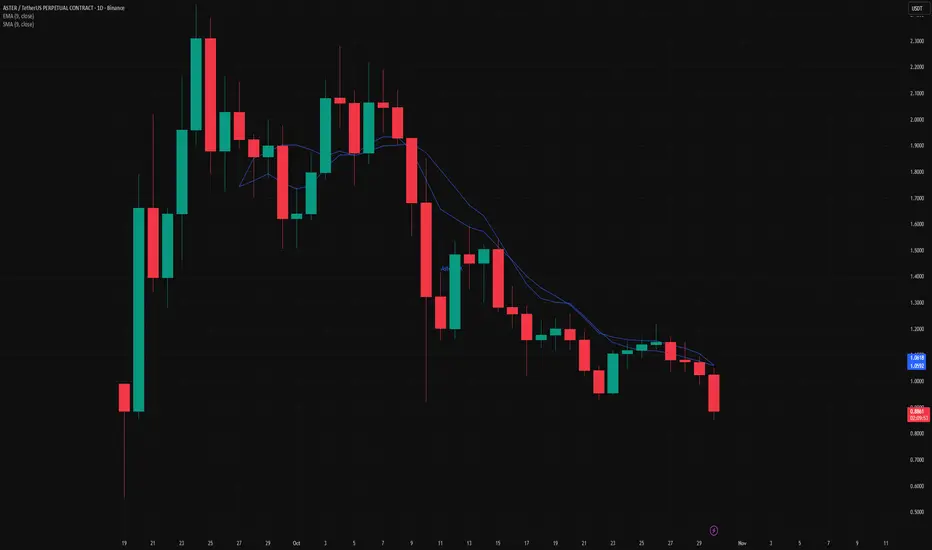
Why you should actually be bullish on ASTERASTER price action has people confused.
Short-term thinking always blinds investors.
ASTER went from $0 to $4B market cap in one week while the market dumped. It is six weeks old, already top 45, and still above $2B market cap.
The Dex has done 2.85T in trading volume with over 5M users. The team announced that 70–80% of all trading fees go to buybacks of $ASTER. This changes the math. Strong volume. Strong user base. Strong tokenomics.
ASTER is the Perp DEX of Binance, backed by CZ and YZILabs. HYPE reached a $20B market cap in under a year. ASTER is following the same pattern with better fundamentals.
Key points: $4B+ market cap in week one 2.85T total trading volume 5M+ users 70–80% fee buybacks Binance ecosystem backing DEX will outlast CEX.
Hold this long term.
ADA/USDT | ADA Setting Up for 10% to 100% Gains, Don’t Miss ThisBy analyzing the Cardano (ADA) chart on the 3-day timeframe, we can see that price is currently trading around $0.67.
Based on the current structure, I expect ADA to start a strong bullish move after a short period of consolidation.
The expected potential returns are around +10% short-term, +40% mid-term, and over +100% long-term. This analysis will be updated soon!
Please support me with your likes and comments to motivate me to share more analysis with you and share your opinion about the possible trend of this chart with me !
Best Regards , Arman Shaban

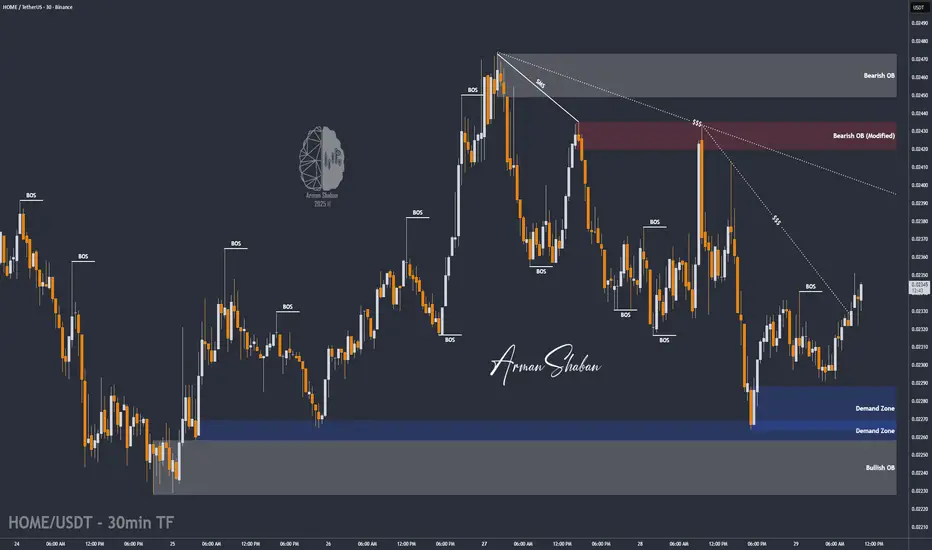
HOME/USDT | $HOME Ready to Pump – Watch $0.0232 Breakout!By analyzing the BME:HOME chart on the 30-minute timeframe, we can see that after a correction down to $0.02265, the price found strong buying interest and is now trading around $0.02338.
If the price manages to hold above $0.02320, we can expect a strong bullish move from this token.
The key demand zone lies between $0.02265–$0.02288, and the next targets for this potential rally are $0.02350, $0.02375, $0.02410, $0.02435, and $0.02450.
Please support me with your likes and comments to motivate me to share more analysis with you and share your opinion about the possible trend of this chart with me !
Best Regards , Arman Shaban
TradeCityPro | CAKE: Range Squeeze, Breakout Imminent👋 Welcome to TradeCity Pro!
In this analysis, I want to review the CAKE coin, one of the DeFi projects active on the BNB network with a market cap of 916 million USD, ranked 74th on CoinMarketCap.
⏳ 1-Hour Timeframe
This coin is currently in a small range box on the 1-hour timeframe, and this tight range has reduced its price fluctuation.
✨ This compression indicates that, if the box is broken, price could make a sharp move.
⭐ Currently, price is at the bottom of this compression and has entered a key support zone.
✔️ If the support zone breaks, the downward move for CAKE will resume, so we can open a short position if the level is broken.
📊 However, if price finds support at this level and moves upward, we can open a long position once 2.785 is broken.
💥 Both triggers for long and short are highly risky. For more reliable triggers, for a long position, we should wait for the break of 3.017, and for a short, we would look for a lower high and low below the support zone.
📝 Final Thoughts
Stay calm, trade wisely, and let's capture the market's best opportunities!
This analysis reflects our opinions and is not financial advice.
Share your thoughts in the comments, and don’t forget to share this analysis with your friends! ❤️

MET (Meteora) - TGE 15m FA/TA, Levels & RiskBias: short-term neutral>bullish if 0.581 holds; mid-term neutral.
Market read:
BTC ≈ $110.6k, ETH ≈ $3.88k, SOL ≈ $193.1. Risk tone modestly positive.
DXY ≈ 99.0; USD/JPY ≈ 152.6; SPY ≈ 671.8; UST 10Y ≈ 4.00%. Liquidity backdrop acceptable.
MET status (T+~13h)
Price ≈ 0.58 with intraday reclaim attempts. Day-one range ~0.516–0.687. Fib from H→L: 0.552 (0.236 up from L), 0.577–0.581 cluster, 0.601, 0.621, 0.646. Your 5–15m charts show RSI>70, MACD crossing up, TRIX rising, DEMA≈0.581 acting as pivot. Expect supply near 0.581/0.597 and heavy inventory 0.55–0.58.
Levels:
Support: 0.566 → 0.559 → 0.545 → 0.515.
Resistance: 0.581 pivot → 0.597–0.601 → 0.621 → 0.646.
Setups and risk (1m/5m/15m/30m)
• Break-retest long: Confirm a 5–15m close ≥0.581, then entry on retest 0.573–0.581. SL 0.566. TP1 0.597–0.601, TP2 0.621, TP3 0.646.
• Fail-reclaim short: If rejection at 0.581 with RSI>75 and waning volume, short perps only; SL 0.586; TP 0.565 then 0.559.
• 30m bias flip: Two consecutive closes ≥0.581 with rising volume/OBV shift bias to constructive; below 0.566 momentum stalls back to 0.559–0.545.
• Execution: post-only limits on Jupiter/Meteora, slippage ≤0.5%. Risk ≤1R per attempt.
FA + flow:
Day-one unlock and broad venue access create two-sided flow; watch Solana beta and CEX listings for impulse. MET’s microcap relative to SOL/JUP/ME/GRASS implies higher variance; treat 0.581 as line-in-the-sand for continuation.
Plan:
If you are flat: only engage on 0.581 hold. If long from lower: trim 25–50% into 0.597–0.601, trail to 0.569, run remainder for 0.621/0.646. If 0.566 breaks on volume, step aside and reassess near 0.559/0.545.
Outlook:
bullish above 0.581 and strengthening into 0.601; neutral-to-bearish on failures back under 0.566.
For educational purposes; not financial advice.

TradeCityPro | AAVE: Trendline Squeeze, Breakout Loading👋 Welcome to TradeCity Pro!
In this analysis, I want to review the AAVE coin for you—one of the lending projects in the Ethereum ecosystem, currently ranked 32 on CoinMarketCap with a market cap of $3.36 billion.
⏳ 4H Timeframe
On the 4-hour timeframe, this coin started a downtrend after being rejected from the 301.39 zone and, together with a descending trendline, has been moving downward.
✔️ Price has now reached it again, faked it once, and is still ranging around this trendline.
✨ If the trendline is broken and price holds above its trigger, it can begin an upward move.
⚡️ The trigger we have to confirm the start of this move is the 234.24 zone. With the break of this trigger, we can also use it to open a long position.
📊 The next resistance levels this coin has are 261.25 and 302.18, each of which can be used as the next trigger for a long position.
💥 For a short position, the main floor that has formed is 202.86. A break of this level will be a very good trigger for a short position.
📝 Final Thoughts
Stay calm, trade wisely, and let's capture the market's best opportunities!
This analysis reflects our opinions and is not financial advice.
Share your thoughts in the comments, and don’t forget to share this analysis with your friends! ❤️

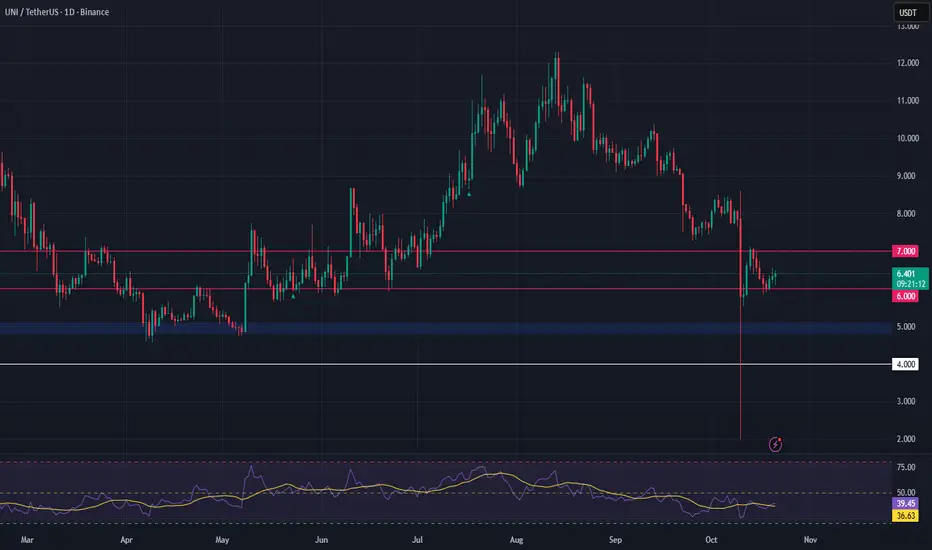
UNI/USDT – Bullish Setup as Uniswap Expands Cross-Chain AccessUniswap just integrated Solana into its Web App, enabling swaps across Ethereum and 13+ other networks. This move significantly expands Uniswap’s ecosystem and could drive a surge in DEX volumes, adding fundamental strength to UNI.
Technically, UNI is trading near a key accumulation zone between $4.80–$5.10. A sustained hold within this range offers a potential long opportunity, especially as momentum picks up with this major protocol update.
🔹 Entry Zone: $4.80–$5.10
🔹 Targets: $6.00, $7.09
🔹 Stop Loss: Below $4.00
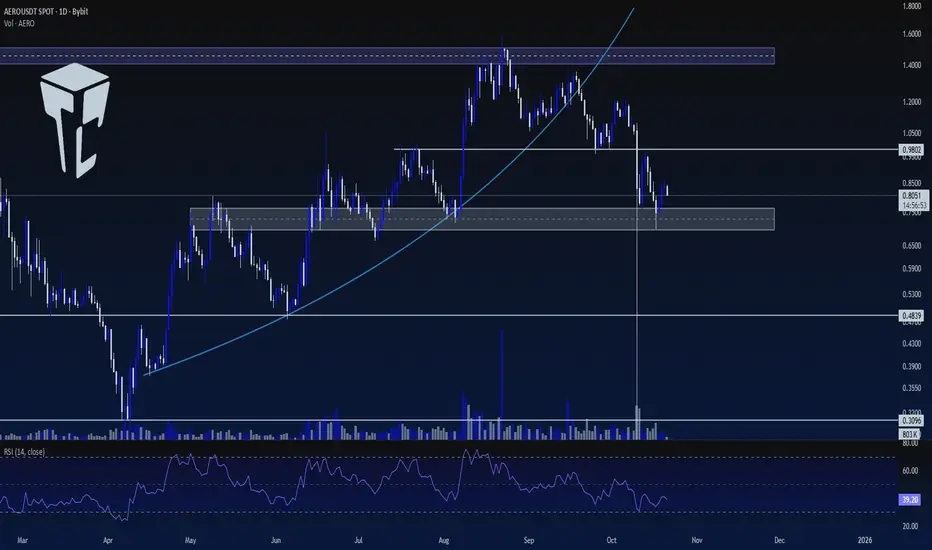
TradeCityPro | AERO: Testing Support After Trendline Break👋 Welcome to TradeCity Pro!
In this analysis, I want to review the AERO coin for you. This project is one of the well-known DEXs, ranked 84th on CoinMarketCap with a market cap of $727 million.
📅 Daily Timeframe
In the daily timeframe, since the last time I analyzed it for you, the coin has been rejected from its resistance zone and has broken its curved trendline.
✨ With the break of this trendline and the activation of the 0.9802 trigger, the bearish move of this coin has continued, and the price has dropped to around $0.7.
💥 Currently, the price is still sitting on this support zone and has penetrated it twice so far. If this level breaks, the trend of this coin will turn bearish.
🧮 In that case, we can open a short position on the break of this zone. The next support levels are 0.4839 and 0.3096.
📊 For a long position, we can act after the price stabilizes above 0.9802. The main trigger for the bullish trend will be breaking the 1.5$ zone.
📝 Final Thoughts
Stay calm, trade wisely, and let's capture the market's best opportunities!
This analysis reflects our opinions and is not financial advice.
Share your thoughts in the comments, and don’t forget to share this analysis with your friends! ❤️
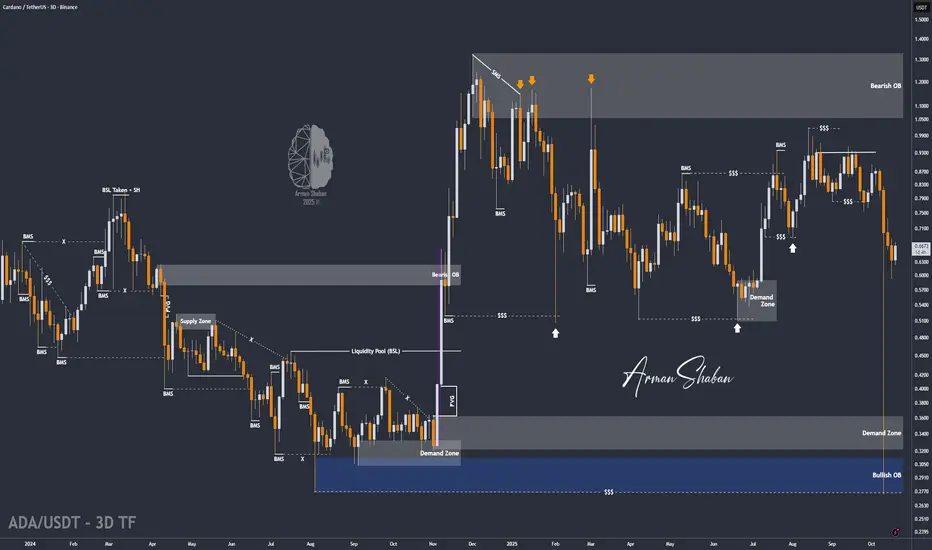
ADA/USDT | Demand Zone Holds, Bulls Gaining MomentumBy analyzing the #Cardano chart on the 3-day timeframe, we can see that after dropping to around $0.59 , ADA once again reacted strongly to demand, rebounding to the $0.66 area. This confirms that buyers are still defending lower levels and that the $0.58–$0.63 zone remains a key support range.
The overall structure is still bullish within accumulation, and this latest bounce could mark the beginning of a gradual recovery phase. As long as ADA holds above $0.63 , the next upside targets remain $0.75, $0.85, and $1.00 — with momentum likely to build if Bitcoin maintains stability above $112K .
This recovery reinforces the idea that ADA is quietly preparing for its next major move upward after weeks of consolidation.
Please support me with your likes and comments to motivate me to share more analysis with you and share your opinion about the possible trend of this chart with me !
Best Regards , Arman Shaban
Defi , lifetime chance .As I said in the previous TA I brought you a hot delicious chart , total defi showing us exactly everything with the previous accumulation but stronger this time , we have a spike in the volume, RSI pretty much resembling, shows big boys are packing their pockets while we moan about our sh!tcoin bags , patience will pay .
Again it’s all my ideas not financial advice.

TradeCityPro | AVAX: Downtrend Persists Near Key Support👋 Welcome to TradeCity Pro!
In this analysis, I want to review the AVAX coin. One of the older crypto projects active in RWA, it has a market cap of $8.48 billion, ranking 18th on CoinMarketCap.
⏳ 1-Hour Timeframe
On the 1-hour chart, we see a downtrend in this coin, which has continued after last week’s decline.
✨ After the 23.06 level was faked, bearish momentum entered the market, and a new downwave began. After breaking the 20.68 support, the price dropped to 19.10 and is now in a correction and pullback phase.
📊 Volume has significantly decreased during this correction, indicating the strength of the downtrend. Although today is Saturday and the overall market volume is low, if the price moves back toward 19.10 with increasing volume, we can confirm the volume for the bearish trend.
💥 The RSI oscillator is correcting alongside the price and, after exiting Oversold, is currently around 50.
⭐ If the 50 level breaks, it signals that bearish momentum in the market has decreased, and AVAX could enter a range-bound or corrective structure.
✔️ On the other hand, if selling volume returns and RSI moves toward 30, breaking this level would bring bearish momentum back into the market. In this case, breaking the 19.10 trigger allows us to open a short position.
🔍 For now, there are better coins for long positions that have recovered more. On AVAX, as long as it stays below 20.68, long positions don’t make much sense.
📝 Final Thoughts
Stay calm, trade wisely, and let's capture the market's best opportunities!
This analysis reflects our opinions and is not financial advice.
Share your thoughts in the comments, and don’t forget to share this analysis with your friends! ❤️

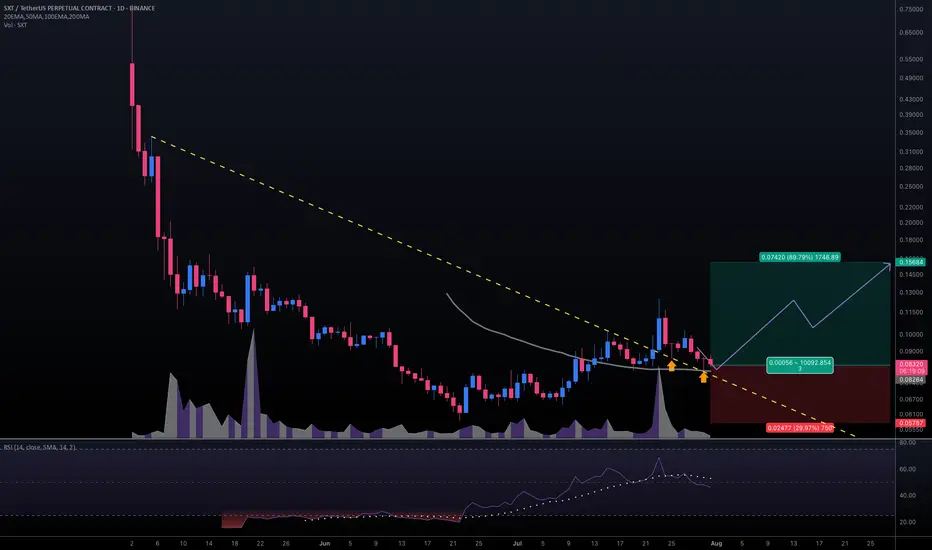
#SXTUSDT #1D (Binance Futures) Descending trendline break retestSpace and Time (SXT) pulled back to 50MA daily support, looks ready for mid-term recovery after those two dragonfly dojis in a row.
⚡️⚡️ #SXT/USDT ⚡️⚡️
Exchanges: Binance Futures
Signal Type: Regular (Long)
Leverage: Isolated (2.0X)
Amount: 5.0%
Entry Targets:
1) 0.08264
Take-Profit Targets:
1) 0.15684
Stop Targets:
1) 0.05787
Published By: @Zblaba
NYSE:SXT BINANCE:SXTUSDT.P #1D #SpaceAndTime #ZK #AI #DPoS spaceandtime.io
Risk/Reward= 1:3.0
Expected Profit= +179.6%
Possible Loss= -59.9%
Estimated Gaintime= 1 month
TradeCityPro | Ethereum: Break Key Levels for Bullish Momentum👋 Welcome to TradeCity Pro!
In this analysis, I want to examine Ethereum for you. The queen of the crypto market, with a $497 billion market cap, is ranked 2nd on CoinMarketCap.
⏳ 4-Hour Timeframe
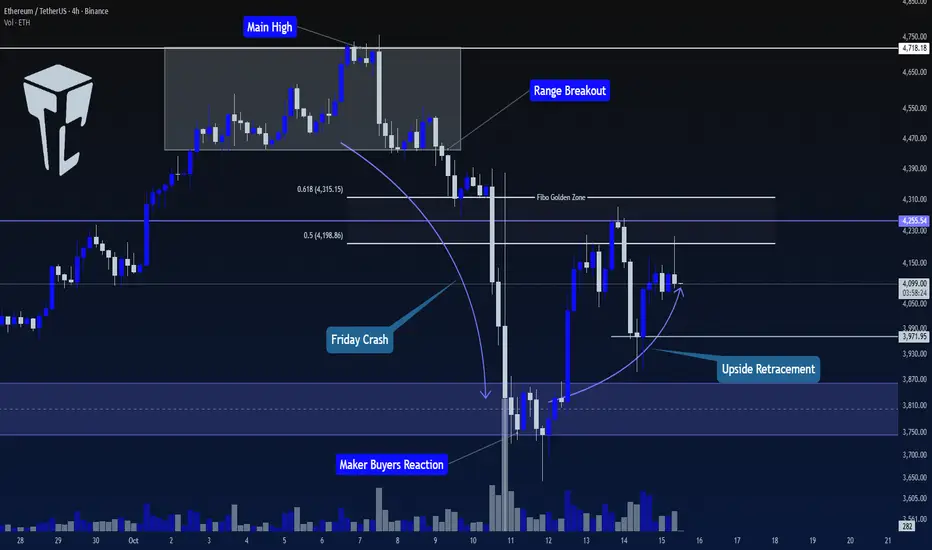
This coin, in the 4-hour timeframe, after breaking the range box at the ceiling and moving towards the $3800 level, is now in a corrective phase and has made an upward movement.
⭐ The $3800 range is a very important level for Ethereum, and this zone was not broken even during the Flash Crash that occurred on Friday, and it managed to hold the price.
🚀 Now, the price has moved towards the range between 0.5 and 0.618 Fibonacci, and has been rejected once from this zone.
📊 The volume has not increased significantly during this move and has mostly been range-bound, but since the price has created a higher low at the $3971 level, if the buying volume increases, we can get a bullish confirmation with a break of the $4255 level.
💥 Since this coin is bullish on higher timeframes and is currently undergoing a correction on lower timeframes, if the price gives us a small bullish confirmation, we can take advantage of it and open a long position.
💡 The main resistance for Ethereum is the $4718 level. Breaking this level will initiate the next wave for Ethereum on higher timeframes, such as weekly charts. Therefore, I will try to open a long position on Ethereum before this level is broken.
📈 The suitable trigger right now seems to be a break of $4255. With this break, the price can move towards $4718, and if this level is broken, we will have a very good and attractive entry point for a long position on Ethereum.
📝 Final Thoughts
Stay calm, trade wisely, and let's capture the market's best opportunities!
This analysis reflects our opinions and is not financial advice.
Share your thoughts in the comments, and don’t forget to share this analysis with your friends! ❤️