Very rare diamond patternThis very rare pattern usually indicates a change of trend. Is doing it in the weekly timeframe and setting up for a massive breakout of the descending channel. Also, oil is setting up an inverse HS and many of the big oil companies show bullish patterns. SL and TP are shown on the charts.
Good luck.
Diamondpattern

JUBLFOOD: Diamond Pattern Forming on Key SupportThis is the daily timeframe chart of Jubilant FoodWorks (JUBLFOOD).
The stock is trading within a well-defined parallel channel, with a key support zone around ₹590–₹570.
The price structure is also forming a Diamond Pattern:
Support Zone: ₹580–₹590
Pattern Resistance: ₹615
A breakout above ₹615 may trigger fresh momentum, with the first target near ₹645 and a pattern target around ₹670.
Thank you.

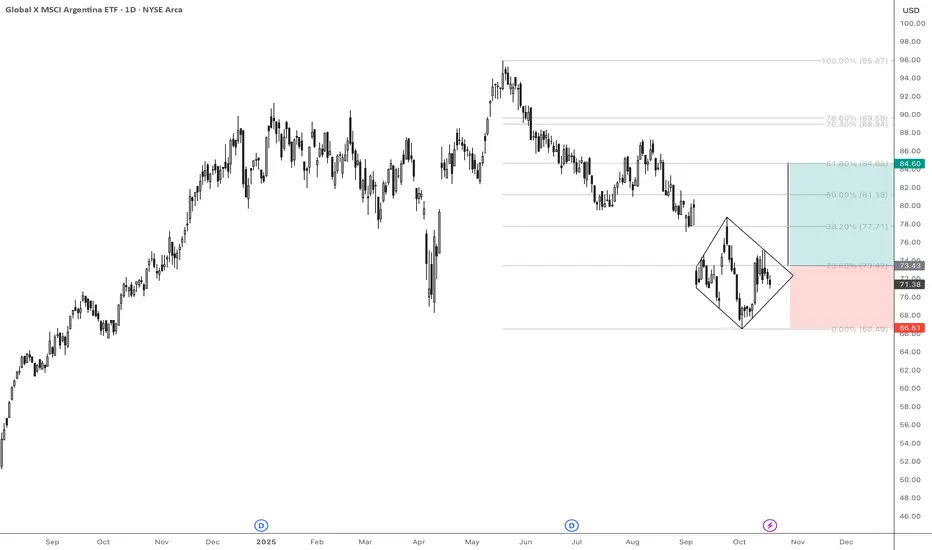
Potential Diamond Formation in PlayNot yet confirmed, but a potential diamond formation seems to be developing on ARGT. Forget the noise — focus on the chart.
A trigger above 73.42 could confirm the breakout, with an upside target equal to the pattern’s height — which, interestingly, aligns with the 61.8% Fibonacci retracement level.
The invalidation level is clearly marked on the chart. If the pattern fails, that itself would signal weakness and could open the way for a deeper decline.
We have a diamond.When a megaphone and a symmetrical triangle intersect, a diamond is formed — a 100% bullish pattern that completes the previous setup and should take us above 130K.

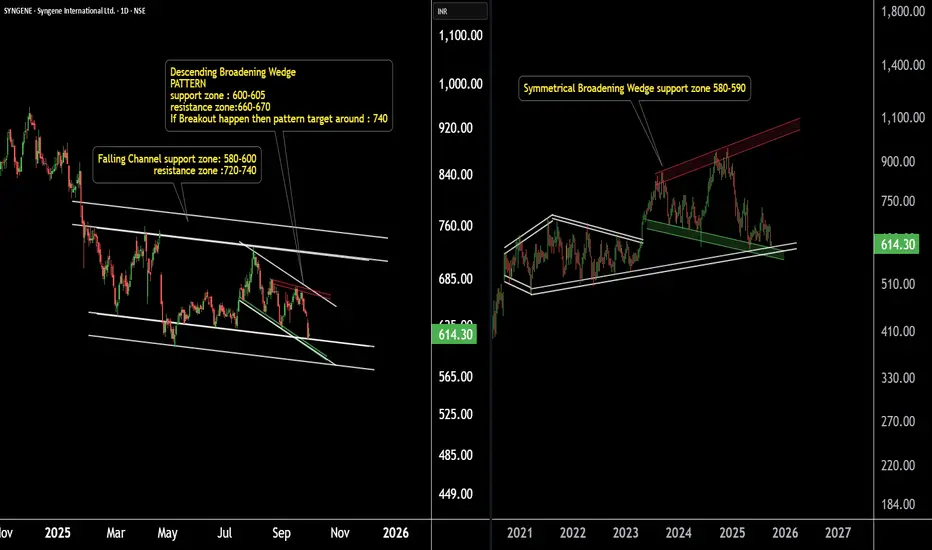
Big Move Loading in Syngene International.Pattern on Support.Syngene International – Daily & Weekly Chart Analysis
Syngene International is exhibiting a confluence of patterns across multiple timeframes, all aligning near a strong support zone.
On the weekly chart, the stock is forming a broadening wedge pattern, with a key support zone around ₹580–590.
On the daily chart, Syngene is trading within a well-defined falling channel, with support again placed near ₹580–590.
Additionally, the price structure is also shaping into a descending broadening wedge, with support around ₹590–600.
Key Insight:
The presence of multiple patterns converging near the same support zone highlights the significance of this level. Sustaining above ₹580–600 could pave the way for a strong reversal move in the coming sessions.
HDFC Life Insurance – A Big Pattern Unfolding!This is the daily timeframe chart of HDFC Life Insurance.
The stock is currently forming a Diamond Pattern with a support zone around 760–770.
In the short term, the price action indicates a potential move toward the pattern resistance zone at 800–810.
A confirmed breakout above this level could unlock a larger upside, with a pattern target projected near 915.
Thank you

Diamond Shift, Channel in Play!Price action recently formed a diamond pattern right at the intersection of two channels, a high-probability area for a shift in direction.
The diamond acted as a turning point, and from there, price shifted into a new phase: the creation of an ascending channel.
Within this structure, we can clearly see consistent higher highs and higher lows, confirming that momentum is now with the buyers.
The market transitioned smoothly into this new ascending channel.
What’s important here is that the channel is not random: it’s an orderly climb, respecting both the upper and lower boundaries. That shows controlled buyer pressure rather than chaotic volatility.
As long as price continues to respect the lower boundary, the bias remains bullish, with the target being the top of the channel.
So, the sequence is clear:
Diamond pattern at the intersection → transition into an ascending channel → target at the channel high.

ICICIBANK: Support Zone & Hidden Setup UnfoldingICICI Bank – Technical Outlook
On the daily and 1-hour charts, ICICI Bank is showing strength near a key support zone of 1370–1390.
On the 1-hour timeframe, the stock is forming a diamond pattern around the 1380–1400 range.
A sustained move above this support zone may trigger upside momentum and lead to higher price levels in the coming sessions.
Conclusion: ICICI Bank is currently at a crucial support area with a developing bullish structure. Traders and investors should monitor these levels closely for potential opportunities.

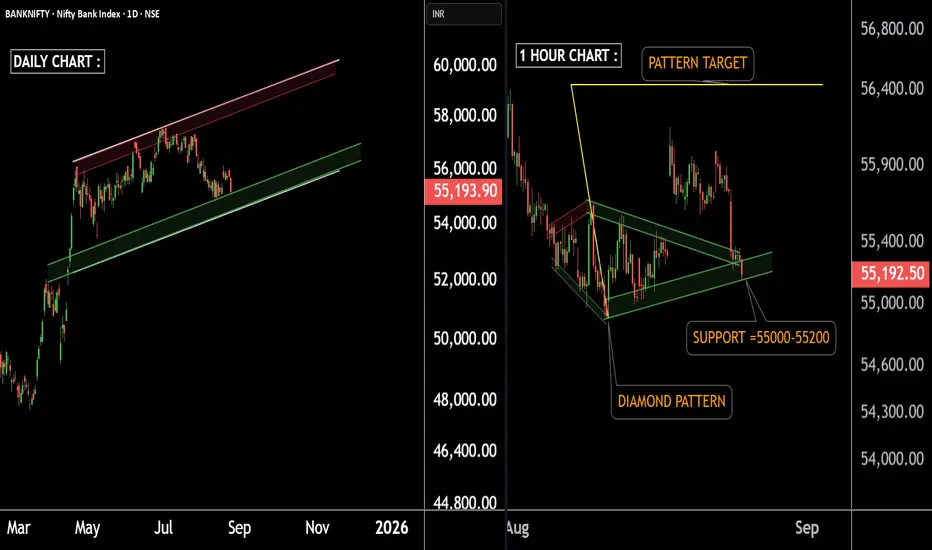
Bullish setup spotted in Bank Nifty – Time to go long.There are two charts of Bank Nifty – one on the Daily timeframe and the other on the 1-Hour timeframe.
On the Daily timeframe, Bank Nifty is taking support on a parallel channel with a support zone around 55,000–55,200 and if makret then support is near 54500 in extreme case.
On the 1-Hour timeframe, Bank Nifty has formed a Diamond Pattern and, after the breakout, is also taking support near 55,000–55,200.
If Bank Nifty sustains this level, we may see higher prices with the pattern target projected around 56,200–56,500.
Thank You !!
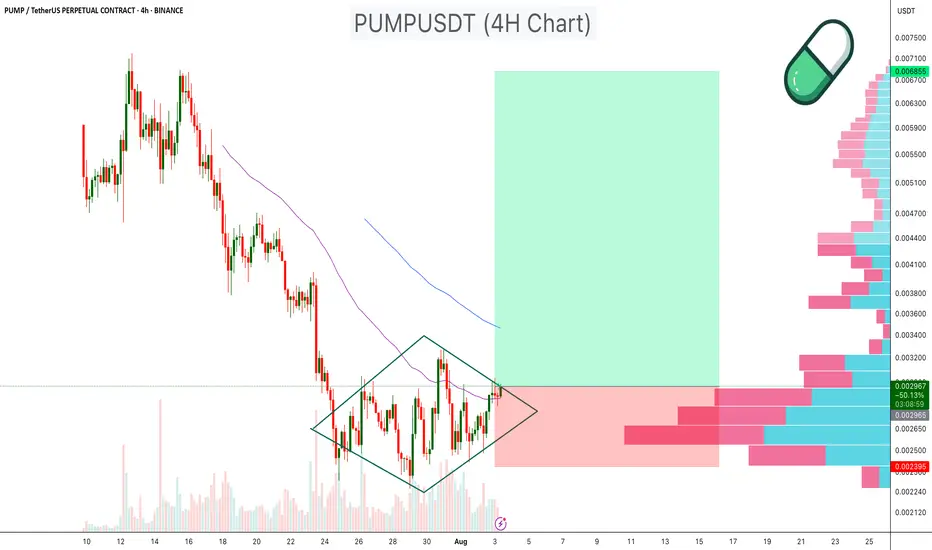
PUMPUSDT Diamond Pattern PUMPUSDT has been consolidating within a diamond chart pattern on the 4 hour timeframe, following a prolonged downtrend. This type of structure signals potential reversal when occurring after a decline.
Diamond Formation: Price is compressing inside converging and diverging trendlines, creating a symmetrical diamond pattern.
Volume Profile Support: Significant volume support is visible in the $0.00240–$0.00250 range, which may act as a strong demand zone.
EMA Resistance: 50 EMA is currently positioned above the price, serving as dynamic resistance.
Breakout Potential: A breakout above the diamond resistance, especially with increased volume, could target the $0.005 –$0.007 zone, representing a major upside move.
Cheers
Hexa
NYSE:PUMP BYBIT:PUMPUSDT
Diamond Reversal Forming On Tesla ($TSLA)This pattern on TSLA fits the outline for a diamond reversal that is referenced on Investopedia.
It has all the "classical" facets of a diamond reversal which is a high (A), a low (C) a higher-high.
Furthermore, this is happening alongside a very similar pattern on NFLX and some bearish patterns on many other stocks.
Similar forms also occurred on SPX in 2021-2222 and Bitcoin in 2021.
The move up from the 2023 lows has the form of an ABC up... which suggests another 5 wave downmove on-par with or even exceeding the previous downmove is on the way.
The move off the highs was a whole 75% so even presuming a moderate 1:1 ratio, the next wave down could be very aggressive which means that an excellent short could be lining up.
Trade safe and be careful out there.

Bitcoin: Precision Breakout in MotionBitcoin is moving steadily toward its next major target—step by step.
A breakout from a rare double inside Wyckoff structure, confirmed by a diamond continuation pattern, has put the bulls back in control. The technical roadmap points us toward the next key level at $108,600.
Let's meet there!

Diamond Pattern Trading: How to Spot and TradeSome patterns scream for attention, while others sneak up on traders who aren’t looking closely. The diamond pattern is one of those sneaky ones — a formation that hints at a brewing reversal but requires a sharp eye to catch.
Let’s dive into this pattern, how it forms, and the best strategies for effectively trading diamond top and bottom patterns.
What Is a Diamond Pattern?
The diamond pattern is a reversal chart pattern that occurs after a strong trend, indicating a potential shift in market direction. It forms when price action expands and then contracts, creating a diamond-shaped contour. This pattern is rare compared to triangles or head-and-shoulders formations, but it often signals significant price moves when it appears.
There Are Two Types of Diamond Patterns:
Diamond Top Pattern – A 🐻 Reversal Pattern That Appears After an Uptrend.
Diamond Bottom Pattern – A 🐂 Reversal Pattern That Forms After a Downtrend.
These patterns can help traders identify potential turning points and prepare for a change in trend.
How Can You Identify a Diamond Pattern in Trading?
To spot a diamond pattern trading setup, look for the following characteristics:
Broadening Formation: The price action initially expands, creating higher highs and lower lows.
Narrowing Structure: After the expansion, the price contracts, creating lower highs and higher lows.
Symmetrical Shape: When trendlines are drawn connecting the highs and lows, they create a diamond shape.
Breakout Point: The pattern is confirmed when the price breaks out of the structure, either to the upside or downside.
While it might resemble a diamond quilt pattern or a diamond tile pattern on the chart, the key difference is its role as a market reversal signal.
Diamond Top Pattern: Bearish Reversal
A diamond top pattern forms at the peak of an uptrend and signals that bullish momentum is weakening. Traders often look for a downside breakout to confirm the reversal.
What Does a Diamond Top Pattern Typically Involve?
Identify the diamond formation after a strong uptrend.
Wait for a breakout below the lower trendline with increased volume.
Enter a short position once the breakout is confirmed.
Set a stop-loss above the recent high.
Target price: Measure the height of the pattern and project it downward.
This pattern suggests buyers are losing control, and a downtrend will likely follow.
📊 Diamond Top in Action
Between late 2024 and early 2025, Bitcoin surged toward $105,000. Following this uptrend, price action began to shift: the candles first spread wider, then started to tighten — ultimately forming what resembled a diamond top on the daily chart.
The pattern formed over several weeks, showing the hallmark structure: broad on the left,
symmetrical tightening on the right, with support and resistance lines converging.
Shortly after the narrowing phase was completed, Bitcoin broke downward — a typical outcome of a diamond top pattern. The price declined sharply over several days, validating the pattern and suggesting a broader correction.
Analysts watching the pattern noted that while it wasn’t perfectly symmetrical (as real-world patterns rarely are), the structure was clear enough to support the reversal thesis. The breakout marked a momentum shift as bullish pressure faded and sellers gained temporary control.
Following the initial drop, Bitcoin stabilized and began consolidating. This sideways movement is common after strong breakouts — reflecting indecision and market recalibration.
Diamond Bottom Pattern: Bullish Reversal
A diamond bottom pattern appears at the end of a downtrend, indicating a potential shift to bullish momentum.
How a Diamond Bottom Pattern Is Typically Interpreted
Identify the diamond shape forming after a downtrend.
Wait for an upside breakout above the upper trendline with substantial volume.
Enter a long position once the breakout is confirmed.
Set a stop-loss below the recent low.
Target price: Measure the pattern’s height and project it upward.
This pattern signals that selling pressure decreases, and buyers may take control.
Why the Diamond Pattern Is Important for Traders
Reliable Reversal Signal. The diamond pattern trading setup strongly indicates trend reversals.
Clear Entry and Exit Points. Well-defined breakout levels make risk management easier.
Works in Different Markets. The diamond pattern remains effective when trading stocks, forex, or crypto.
Final Thoughts
The diamond pattern is a rare but powerful tool that can help traders confidently spot trend reversals. Whether you’re trading a diamond top pattern for bearish setups or a diamond bottom pattern for bullish breakouts, understanding this formation can give you an edge in the market.
So, traders, have you spotted a diamond pattern trading setup recently? Share your experiences and strategies in the comments!
This analysis is performed on historical data, does not relate to current market conditions, is for educational purposes only, and is not a trading recommendation.

Diamond Pattern Trading: How to Spot and Trade This SignalSome patterns scream for attention, while others sneak up on traders who aren’t looking closely. The diamond pattern is one of those sneaky ones—a formation that hints at a brewing reversal but requires a sharp eye to catch. Let’s dive into what this pattern looks like, how it forms, and the best strategies for effectively trading diamond top patterns and diamond bottom patterns.
What Is a Diamond Pattern?
The diamond pattern is a reversal chart pattern that occurs after a strong trend, indicating a potential shift in market direction. It forms when price action expands and then contracts, creating a shape that resembles a diamond.
This pattern is rare compared to triangles or head and shoulders formations, but it often signals significant price moves when it appears. There are two types of diamond patterns:
Diamond Top Pattern – A 🐻 Reversal Pattern That Appears After an Uptrend.
Diamond Bottom Pattern – A 🐂 Reversal Pattern That Forms After a Downtrend.
These patterns can help traders identify potential turning points and prepare for a change in trend.
How to Identify a Diamond Pattern in Trading?
To spot a diamond pattern trading setup, look for the following characteristics:
Broadening Formation: The price action initially expands, creating higher highs and lower lows.
Narrowing Structure: After the expansion, the price contracts, forming lower highs and higher lows.
Symmetrical Shape: When trendlines are drawn connecting the highs and lows, they create a diamond shape.
Breakout Point: The pattern is confirmed when the price breaks out of the structure, either to the upside or downside.
While it might resemble a diamond quilt pattern or diamond tile pattern on the chart, the key difference is its role as a market reversal signal.
Diamond Top Pattern: Bearish Reversal
A diamond top pattern forms at the peak of an uptrend and signals that bullish momentum is weakening. Traders often look for a downside breakout to confirm the reversal.
How to Trade a Diamond Top Pattern:
Identify the diamond formation after a strong uptrend.
Wait for a breakout below the lower trendline with increased volume.
Enter a short position once the breakout is confirmed.
Set a stop-loss above the recent high.
Target price: Measure the height of the pattern and project it downward.
This pattern suggests buyers are losing control, and a downtrend will likely follow.
Diamond Bottom Pattern: Bullish Reversal
A diamond bottom pattern appears at the end of a downtrend, indicating a potential shift to bullish momentum.
How to Trade a Diamond Bottom Pattern:
Identify the diamond shape forming after a downtrend.
Wait for an upside breakout above the upper trendline with strong volume.
Enter a long position once the breakout is confirmed.
Set a stop-loss below the recent low.
Target price: Measure the pattern’s height and project it upward.
This pattern signals that selling pressure decreases, and buyers may take control.
Why the Diamond Pattern Is Important for Traders
Reliable Reversal Signal. The diamond pattern trading setup strongly indicates trend reversals.
Clear Entry and Exit Points. Well-defined breakout levels make risk management easier.
Works in Different Markets. Whether trading stocks, forex, or crypto, the diamond pattern remains effective.
Final Thoughts
The diamond pattern is a rare but powerful tool that can help traders confidently spot trend reversals. Whether you’re trading a diamond top pattern for bearish setups or a diamond bottom pattern for bullish breakouts, understanding this formation can give you an edge in the market.
So, traders, have you spotted a diamond pattern trading setup recently? Share your experiences and strategies in the comments!

GBPAUD new bearish expecting here
OANDA:GBPAUD strong bearish in last periods, currently price in zone, its bounce 4-5 times on SUP zone, looks like DIAMOND pattern here is created, based on past for me still here having enough bearish volumen gathered for one more push.
SUP zone:1.97800
RES zone: 1.95000, 1.94500, 1.93900

BTC structure is getting weaker in LTF#bitcoin #btc price has been forming a bearish diamond pattern and if CRYPTOCAP:BTC does not manage to breakout this zone upside, then the correction awaits #btcusd .Not financial advice.

Alikze »» BTC | Bullish angle pattern | bullish channel - 8H🔍 Technical analysis: Bullish angle pattern in the bullish channel And the pullback is broken into the swing
- According to the movement scenario predicted in the previous analysis , by forming an ascending diamond pattern, it managed to break the dynamic trigger and move towards the supply areas.
- It is currently moving in an ascending channel in the 8H time frame.
- With the formation of an ascending corner pattern, it is undergoing a temporary correction to the green box.
- Therefore, it can encounter support after correction in the green box area and continue its growth up to the supply range.
💎 In addition, if the correction is sharp, there will be a possibility of breaking the green box, up to the range of 62500.
💎 So, in case of zigzag correction in the green box area, it can meet the demand and touch the target of the supply area.
⚠️ In addition, if below the area of 62500 candles, the bullish scenario will be invalidated and should be re-examined and updated.⚠️
»»»«««»»»«««»»»«««
Please support this idea with a LIKE and COMMENT if you find it useful and Click "Follow" on our profile if you'd like these trade ideas delivered straight to your email in the future.
Thanks for your continued support.
Best Regards,❤️
Alikze.
»»»«««»»»«««»»»«««
MEXC:BTCUSDT

Market Indecision 2024! (Diamond Reversal)It has been an interesting few years in the markets. One of the hottest bull runs coming off the Pandemic lows to a 7 month bear market in 2022, followed by another epic bull run! We are now at a major decision point for markets. Up or Down! Recession fears abound while small caps are ready to pop waiting on rate cuts. The S&P as lopsided as ever with Mag 7 carrying the entire index for 2 years. Where are we going next?
At every "potential" market top, the convergence between an ascending channel meets a potential descending channel forming a diamond shaped pattern. This pattern is the indecision point of any given market, but don't get bearish yet. A diamond reversal pattern can break in either direction, reversal or continuation .
I have documented both the historical moves and the future potential paths. Remember that markets are not pre-ordained to do anything. They have to make decisions, and while you may have already decided your personal view, you can let the market confirm your biases one step at a time.
React! Don't predict!
1) Halfway mark from 10/23 run to $6000 target
-4/19 bottom starts 2nd leg
-Bull Flag Consolidation
2) Diamond Reversal (Minor)
-Rate cuts? Yes/No
-And Why? Economy vs Inflation
**Upside Breakout on 9/13
3) Rate cuts hinted for Sep FOMC
-Halted 38% run from 10/23
-Halted 62% run from 10/22
4) Required drop to form minor/major diamond of indecision.
-Blamed on Japanese Carry Trade*
-Note the drop is perfect 78.6% retrace from 4/19 Run
*Japanese Carry Trade margin collapse was instead caused by formation.
**This was also opportunistic early rotation into treasuries.
5) Bullish rejection of minor diamond
-Resilient CPI and Jobs provide cover for soft landing narrative.
-Note the rejection confirms on diamond neutral line @ 38.2% 4/19 fib and healthy 20WMA bounce
6) Rate Cuts!!!
-Rate cut odds are near equal between .25 vs .50
-Note a rejection confirms Double Top
-Breakout confirms $6000
7) Blow off top!!!
-Note the identical pattern to 2022 top
*The Ancient Trendline is based on a back-dated creation of the S&P 500 by Standard & Poors as the index was founded in 1957
8) Bullish Ascending Channel starts in Jun-Oct 2022
-A short break here confirms new bearish descending channel and major diamond reversal.
-This will be your bearish hint towards bearish 2025 but don't short yet!!
-No break confirms ascending channel but EOY will give one more opportunity for a break.
9) End of Year typical Tax Loss Harvesting, Santa Rally, etc.
-Unlikely to see a bullish breakout here
-If Continuation occurs, it will be Jan into Feb
10) Last chance for Bears!
-Need bearish breakdown to confirm both diamond and descending channel
11) Descension confirmation marks several opportunities on path down for bullish break outs
-Initial Support @ $4800 (20% drop from top)
-Secondary Support @ $4450 (25% drop from top)
-Massive Support @ $4144 (30% drop from top)
Best of luck in 2025 whatever you decide! Game on!

SUI Diamond Pattern Formation will Break to Downside (SHORT)I am Seeing a price crash and "V-Shape" recovery in the cards for the SUI price chart. Diamond pattern formation will break to the downside for a measured move down to the 1.618 fib extension. Fed emergency rate cut will reverse the markets back upwards into the US Elections.
Lower buy target @ or around 0.272

XDefi Wallet Second DiamondGATEIO:XDEFIUSDT
⏰ TimeFrame 1Day
👉 💎 Diamond reversal❓ or continuation❓
👉0,031-0,044
✔️Logarithmic (Log) Chart

THEORIS : EURUSD Elliott wave chartsLeft chart: Weekly Timeframe
Leg B ends around 0.9532
invalid if the price is below 0.9532
Right chart: 4H
chart try to form an ABCDE pattern.
now heading up to the green dashline
It should drop this zone and form leg c
yes, it can break up if strong bullish trend too
we can see a Diamond pattern in this chart too

EUR/USD Diamond Pattern Breakout ScenariosIn this short video, I dive into the potential EUR/USD breakout directions and why a massive move may be upon us.

A EUR/USD breakout is imminent (Weekly)I've been closely observing the EUR/USD price action on both the daily and weekly charts, and it looks like a major move is imminent.
Price is getting squeezed within that diamond pattern, and the best strategy right now is to stay flat and keep observing.
Once I can identify the direction, I'll be on the lookout for divergence at key support and resistance areas to start initiating positions in the direction of the price trend.
