HDFC LIFE - BUYNSE:HDFCLIFE Outperforming whole insurance sector, but as of now this stock is near life time high and consolidate from last 3 months. Will continue bullish next 6 to 12 months.
Next report date
—
Report period
—
EPS estimate
—
Revenue estimate
—
7.85INR
15.74 BINR
888.47 BINR
944.91 M
About HDFC LIFE INS CO LTD
Sector
Industry
CEO
Vibha U. Padalkar
Website
Headquarters
Mumbai
Founded
2000
ISIN
INE795G01014
FIGI
BBG00CRG21Q5
HDFC Life Insurance Co. Ltd. engages in the provision of life insurance services. It operates through the India and Middle East geographical segments. The company was founded on August 14, 2000 and is headquartered in Mumbai, India.

Bullish on HDFCLIFE - A resilent stock in the midst of the crashHDFC Life is showing good bullish traction.
Stock has been consolidating since Sep-'24.
It has give a breakout this week, did a re-test of the zone and has held it which shows good strength.
RSI is super Bullish on all High time frames which indicates momentum.
I have taken a Long position and maint

HDFC Life Insurance view for Intraday 17th October #HDFCLIFE HDFC Life Insurance view for Intraday 17th October #HDFCLIFE
Resistance 730. Watching above 731 for upside movement...
Support area 720. Below ignoring upside momentum for intraday
Support 720..Watching below 719 for downside movement...
Resistance area 730....
Above ignoring downside move for in

SWING IDEA - HDFC LIFE INSURANCE HDFC Life Insurance , one of India's leading life insurance companies, is showing strong technical signals for a swing trade.
Reasons are listed below :
750 Zone Breakout : This level has been tested several times and the stock is now poised to break out, indicating potential upward momentum.
B

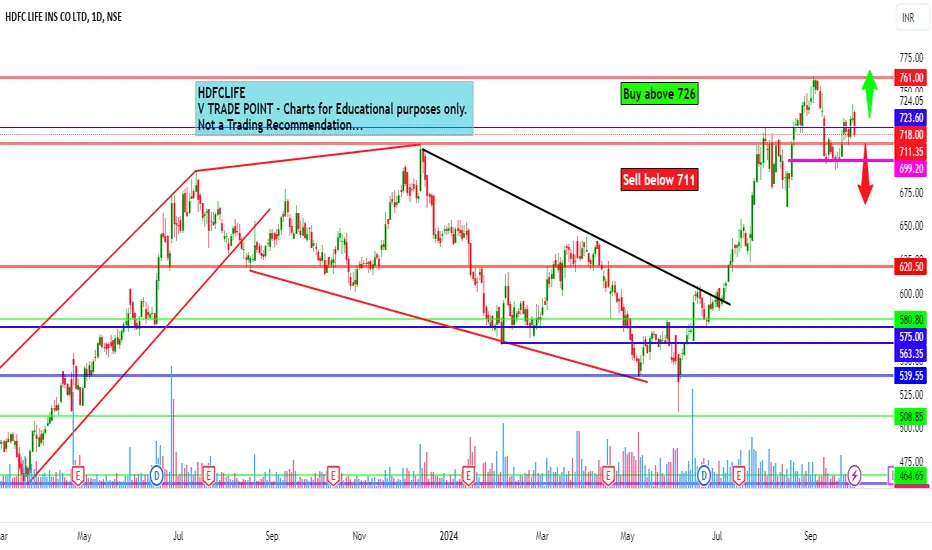
HDFC Life Insurance Company Ltd view for Intraday 1st October #HHDFC Life Insurance Company Ltd view for Intraday 1st October #HDFCLIFE
Buying may witness above 726
Support area 720. Below ignoring buying momentum for intraday
Selling may witness below 711
Resistance area 720
Above ignoring selling momentum for intraday
Charts for Educational purposes only.
HDFC Life Insurance Company LtdHDFC Life Insurance Company Ltd is up for a third straight session today. The stock is quoting at Rs 723.5, up 1.74% on the day as on 12:49 IST on the NSE. The benchmark NIFTY is up around 0.3% on the day, quoting at 25867.5. The Sensex is at 84684.03, up 0.17%. HDFC Life Insurance Company Ltd has s

HDFC Life Insurance Company Ltd view for Intraday 20th SeptemberHDFC Life Insurance Company Ltd view for Intraday 20th September #HDFCLIFE
Buying may witness above 708
Support area 696-700. Below ignoring buying momentum for intraday
Selling may witness below 696
Resistance area 705-708
Above ignoring selling momentum for intraday
Charts for Educational purp

HDFC Life Insurance Company Ltd view for Intraday 17th SeptemberHDFC Life Insurance Company Ltd view for Intraday 17th September #HDFCLIFE
Buying may witness above 708
Support area 695. Below ignoring buying momentum for intraday
Selling may witness below 695
Resistance area 705-708
Above ignoring selling momentum for intraday
Charts for Educational purposes

HDFC Life Insurance view for Intraday 9th September #HDFCLIFE HDFC Life Insurance view for Intraday 9th September #HDFCLIFE
Buying may witness above 745
Support area 732. Below ignoring buying momentum for intraday
Selling may witness below 732
Resistance area 745
Above ignoring selling momentum for intraday
Charts for Educational purposes only.
Please fo

HDFC LIFE Insurance Company Ltd view for Intraday 5th September HDFC LIFE Insurance Company Ltd view for Intraday 5th September #HDFCLIFE
Buying may witness above 762
Support area 749-750. Below ignoring buying momentum for intraday
Selling may witness below 749
Resistance area 760-762
Above ignoring selling momentum for intraday
Charts for Educational purpo

See all ideas
An aggregate view of professional's ratings.
Displays a symbol's price movements over previous years to identify recurring trends.
Frequently Asked Questions
The current price of HDFCLIFE is 709.45 INR — it has decreased by −0.76% in the past 24 hours. Watch HDFC LIFE INS CO LTD stock price performance more closely on the chart.
Depending on the exchange, the stock ticker may vary. For instance, on NSE exchange HDFC LIFE INS CO LTD stocks are traded under the ticker HDFCLIFE.
HDFCLIFE stock has fallen by −2.28% compared to the previous week, the month change is a −1.74% fall, over the last year HDFC LIFE INS CO LTD has showed a 15.95% increase.
We've gathered analysts' opinions on HDFC LIFE INS CO LTD future price: according to them, HDFCLIFE price has a max estimate of 900.00 INR and a min estimate of 585.00 INR. Watch HDFCLIFE chart and read a more detailed HDFC LIFE INS CO LTD stock forecast: see what analysts think of HDFC LIFE INS CO LTD and suggest that you do with its stocks.
HDFCLIFE reached its all-time high on Sep 2, 2021 with the price of 775.65 INR, and its all-time low was 307.00 INR and was reached on Nov 17, 2017. View more price dynamics on HDFCLIFE chart.
See other stocks reaching their highest and lowest prices.
See other stocks reaching their highest and lowest prices.
HDFCLIFE stock is 2.81% volatile and has beta coefficient of 0.80. Track HDFC LIFE INS CO LTD stock price on the chart and check out the list of the most volatile stocks — is HDFC LIFE INS CO LTD there?
Today HDFC LIFE INS CO LTD has the market capitalization of 1.53 T, it has increased by 0.21% over the last week.
Yes, you can track HDFC LIFE INS CO LTD financials in yearly and quarterly reports right on TradingView.
HDFC LIFE INS CO LTD is going to release the next earnings report on Jan 17, 2025. Keep track of upcoming events with our Earnings Calendar.
HDFCLIFE earnings for the last quarter are 2.04 INR per share, whereas the estimation was 2.75 INR resulting in a −25.89% surprise. The estimated earnings for the next quarter are 2.89 INR per share. See more details about HDFC LIFE INS CO LTD earnings.
HDFC LIFE INS CO LTD revenue for the last quarter amounts to 167.55 B INR, despite the estimated figure of 181.26 B INR. In the next quarter, revenue is expected to reach 186.15 B INR.
HDFCLIFE net income for the last quarter is 4.35 B INR, while the quarter before that showed 4.79 B INR of net income which accounts for −9.14% change. Track more HDFC LIFE INS CO LTD financial stats to get the full picture.
Yes, HDFCLIFE dividends are paid annually. The last dividend per share was 2.00 INR. As of today, Dividend Yield (TTM)% is 0.28%. Tracking HDFC LIFE INS CO LTD dividends might help you take more informed decisions.
HDFC LIFE INS CO LTD dividend yield was 0.32% in 2023, and payout ratio reached 27.32%. The year before the numbers were 0.38% and 29.62% correspondingly. See high-dividend stocks and find more opportunities for your portfolio.
As of Oct 27, 2024, the company has 32.49 K employees. See our rating of the largest employees — is HDFC LIFE INS CO LTD on this list?
Like other stocks, HDFCLIFE shares are traded on stock exchanges, e.g. Nasdaq, Nyse, Euronext, and the easiest way to buy them is through an online stock broker. To do this, you need to open an account and follow a broker's procedures, then start trading. You can trade HDFC LIFE INS CO LTD stock right from TradingView charts — choose your broker and connect to your account.
Investing in stocks requires a comprehensive research: you should carefully study all the available data, e.g. company's financials, related news, and its technical analysis. So HDFC LIFE INS CO LTD technincal analysis shows the sell today, and its 1 week rating is buy. Since market conditions are prone to changes, it's worth looking a bit further into the future — according to the 1 month rating HDFC LIFE INS CO LTD stock shows the buy signal. See more of HDFC LIFE INS CO LTD technicals for a more comprehensive analysis.
If you're still not sure, try looking for inspiration in our curated watchlists.
If you're still not sure, try looking for inspiration in our curated watchlists.