XAUUSD- Will price continue its move to the upside?Gold prices fell on Tuesday on the back of a firmer dollar, but fears of a global economic slowdown fuelled by an intensifying U.S.-China trade war kept prices near multi-year highs.
Meanwhile, Asian stocks on Tuesday were dented by U.S.-China trade frictions. Overall risk sentiment was poor and the trade war was likely to create more volatility, benefiting gold, Lu said. China has lodged a complaint against the United States at the World Trade Organization over U.S. import duties, trashing the latest tariff actions as violating the consensus reached by leaders of China and the United States in a meeting in Osaka.
A new round of tit-for-tat tariffs came in effect on Sunday and although U.S. President Donald Trump has said both sides would still meet for talks later this month, tensions have shown little sign of abating. Also keeping investors on edge were uncertainties over Brexit with Prime Minister Boris Johnson indicating he could call an election to block lawmakers’ efforts to avert a no-deal Brexit.
The long consolidation gives a signal for a bullish reversal back to the upside only when price breaks the diagonal resistance.
The bullish reversal chart pattern spotted on the 1hour time frame is called the Diamond bottom chart pattern.
A diamond bottom is a bullish, trend reversal, chart pattern.
A diamond bottom is formed by two juxtaposed symmetrical triangles, so forming a diamond.
A diamond bottom has to be preceded by a bearish trend. This pattern marks the exhaustion of the selling current and investor indecision.
Volatility and oscillations increase in the first half of the pattern (i.e. in the symmetric broadening wedge pattern); then decrease in the second half of the pattern (i.e. in the symmetric triangle). A diamond bottom’s price objective is calculated by plotting the maximum height of the diamond at the exit point.
- In 82% of cases, the output of a diamond bottom is bullish.
- In 79% of cases, the price objective of a diamond bottom is reached.
- After exit, in 43% of cases, the price makes a pullback in support on the resistance line of the symmetrical triangle (2nd half of the diamond).
Breakout price- $1529.560
Resistance 1- $1532.072
Resistance 2- $1534.853
Resistance 3- $1539.339
Resistance 4- $1543.197
Good luck to everyone! Click the follow button to stay tuned for more trading ideas! Like the idea? Hit the like button!
Ideas published should not be referred to as an investment advice
Diamondpattern

Diamond Top followed by smaller continuation diamondlookin' like we have hit our smaller continuation diamond target but not yet reached the 10.6k range to hit our larger diamond top target yet. We can see price is currently finding support exactly on the 2hr 200ma. Recently had a 1hr deathcross and that coupled with the ETF delay FUD is probably just enough of an excuse to send prices back down...our 3 day 50ma is currently sitting right around 8k and climbing fast so if gapboys are gonna hav their drams of he 8.5k gap getting filled this is one of the last time windows to pull i off considering that the 3 day 50ma tends to be massively reliable support during bull markets and price is highly unlikely to close a candle below it. Only way I could see bc closing a candle below the 3 day 50ma a his point and/or flipping it to solidified resistance is if the bull market is already over which is highly highly unlikely but not impossible, if that's he case then all the elliot wave doomboys may actually be right but for now I doubt it

Is there an Diamond Formation Which Is Ready to Break Soon? After first diamond bitcoin dropped nearly 300 point. Is there a second diamond? Please share your opinion.

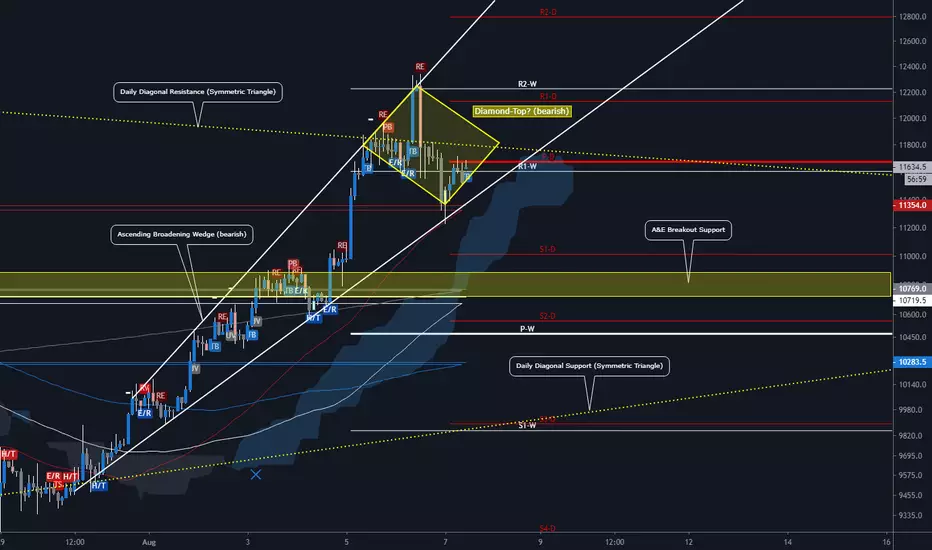
#bitcoin - Possible bearish diamond top "H2"During the day a new pattern, that is considered bearish has come into play and possibly marking a high, a diamond-top. Also taking into consideration, that we have developed a bearish ascending wedge, it becomes more likely that we have seen a local high now. Possible targets for this are not $8k .... those are $10.7 and $10k, where we would have to look at the possibility of making a symmetric triangle which can go both ways, instead of the former mentioned ascending triangle which is rather bullish nature.
This is only H2 interval, so nothing that is going to have an intense influence on the further longterm development. Keep an eye out.
_____________________________
Warm regards,
Neru

BTC - 30 Minute Diamond BottomWe may see a small pump as price action formed a diamond bottom pattern with bullish divergence


DogeBTC- Diamond PatternTechnical analysis is a subjective area, when a person point of view can be different with the others .No traders are wrong when they opened (a) position(S) based on their analysis until the market proves em wrong
However based on what i spotted in DogeBTC weekly and monthly chart , i am assuming DOGE/BTC is forming a "Bottom" Diamond pattern , which can be intrepeted there is a possibility this is a Bullish Reversal pattern , which has good probability to hit maybe 200 sats are a
Or this is maybe a bearish continue pattern which has probability to hit under 1 sats area ) depend on breakout direction.
Well, under 1 sats area , and i will be happy to hear if doge delisted from their current exchangers.
Lets us wait with patience to see a clear confirmation which directions doge will move
DLong

SHORT BAI was wrong about the Diamond on my other idea. This was a continuation diamond, and not a bottom diamond. Bombs away on BA


Bitcoin DIAMOND BOTTOM IN?Hello - a quick update on Bitcoin.
This can be wishful thinking, but it does seem like, that as of today (28.01.2019) Bitcoin broke the diamond formation and can strive lower. This means that it will be possible to short it after the breakout is confirmed.
Nevertheless, this market is manipulated and there can be short squeezes, which, in my opinion, can happen sooner rather than later (a pullback after a drop of that magnitude is normal). Touch of the trendline (now resistance) could give an potential entry
to short.
Best of luck.

EURJPY DiamondDiamond pattern found on EURJPY along with minor break of trend, retest and resistance with a quarter point level. Look for possible sell here.

Main chartist patterns and resistances on BitcoinWe are reaching the end of the indecision zone and is a good moment to post a reminder of the actual situation and potential outcomes so we can build a strategy on top of it.
Red circles: Sell areas
Green circles: Buy areas
The actual point concealed inside a diamond shape has statistically speaking more chances to go up, though, we are at 3.43% from a main resistance comming from ATH and below it we have a sell area. By following a 2 minimum risk/reward ratio, our SL would be at 3530$, which is too close... so I will stay out at stable coin for now.
If we drop, we have an harmonic pattern at +/- 3300$ with a bullish hidden divergence and potentially a strong buying action as we could create a double bottom with the lowest price of 2018-2019.
I expect at that point a potential reversal of the trend, either significant or one that smash the diagonal resistance, in both cases we have an interesting % to trade in.
If we go up from the actual price (3600$) until the diagonal and break it, ignoring the bearish divergence that will probably form at that point, we have chances to keep going up from there.

BTC Bearish signBTC formed a Diamond Top which is an overall bearish sign.
Added to that the Volume is decreasing with time which is also a bad sign.
RSI on 1D timeframe is eerily similar to the 6k$ period where we were moving sideways for a long while. It is also generally stuck on 50 or below which doesn't give much strength to the Bulls.
People in the space seems to be holding their breath and waiting for the next move to happen.
BTC will probably fall to previous support line and have a rebound but will be testing the support line multiple time for a final break.
Unlike many others, i do not consider the present forming ascending triangle, as it is a smaller frame and larger frames should be considered as more important to smaller ones. But yes the small ascending triangle is there which gives a small percentage of possible upside move. But keep in mind that we've already rebounded so many times on the triangle slope that the chances of an upside break gets smaller.

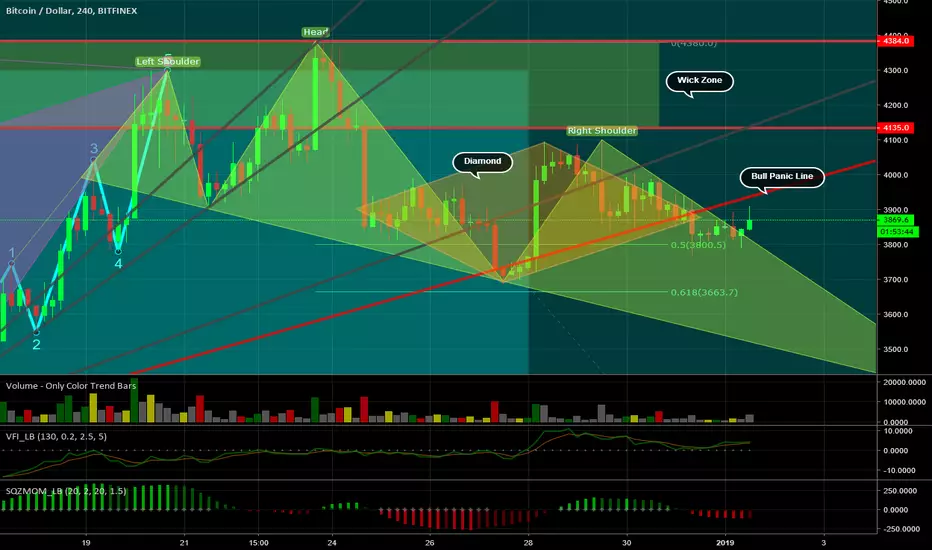
Symmetrical diamond patternNot totally sure what to make of this.
It's a slightly bullish pattern here I think. It might mean a 2nd chance to get short from higher prices in the wick zone.
I'm going to hold off on scaling in more short until it gives a few more candles of data.
USOIL - D1-Diamond Bottom ReversalTrading Diamond Pattern
The chart above shows a "Diamond bottom reversal" from the TVC:USOIL
tick chart.
1. Wait for a clear breakout from the "Diamond pattern.
2. Enter a "long" trade at 54.35.
3. Place a "stop" order bellow the low of the "Diamond at @ 49.44.
4. Target the range of AB from C to @ 74.35.


DAX: Weekly overview! WIll we restest the 12.000? ***19.11.18***Hey tradomaniacs,
since we`ve created the Diamond-Pattern after the high in Mai @ 13.206, we`ve seen a huge Sell-Off down to 11.040,5 this october!
It was as crazy and volatile as expected! But what now?
There were many different fundamental aspects causing this nervous market.
Italy`s budget and it`s bond yields
Failing Brexit
Weak wallstreet which is concerned about the tradewar
Strong US-Dollar
Supply-deficits in the tech-sector (apple) which totally destroyed the Dow&Jones and SPX500,
Saudi-Arabia and so on.
However, we know the market is irrational and won`t give up that quick. The scent of profit is too strong and the market might see good chances to buy during the Years-End causing a rally.
Will we retest 12.000?
The Chart is currently still bearish. But break through the imortant 12.000 could be like a heart-warming hot chocolate during cold winter days giving the market hope to see a rally up to a new ATH.
I expect at least a retest of it. :-)
Peace and good trades
Irasor

PATRÓN DIAMANTE EN USDJPY SELL STOPFormación de patron Diamante , poner un sell stop en el punto de quiebre 113.727 .
Take Profit: 113.199
Stop Loss: 113.959


SOXL start buying, save some money for 80s if they comeSome levels of interest. Caught this falling out of the diamond pattern.

BTC Diamond Bottom (13.7%)$BTCUSD diamond bottom in play at the moment.
Details below from thepatternsite, and satisfying many of the required conditions.
First target: 7020
Second target: 7260
"Touches:
Prices will touch each trendline once or twice. Don't worry if your lines cross some of the price outliers."
"Volume trend:
Downward trend 67% of the time."
"Breakout:
Upward 72% of the time, when price closes outside one of the trendline boundaries."
"Price trend:
Diamonds with short-term (less than three months) or intermediate-term (three to six months) price trends leading to the diamond perform best, depending on market condition and breakout direction."
"Price velocity:
High velocity moves after the pattern often follow high velocity moves leading to the pattern."
"Yearly low:
For best performance, diamonds with breakouts within a third of the yearly low perform best."
