#LINK, #ChainLink, Who likes #Diamonds?A quick look at #ChainLink (LINKUSDT , 4HR, Binance):
LINK is consolidating after a dip that brought its price from $53 to $15 in two weeks, in what looks like a diamond bottom.
If the price confirms a breakout, we can see higher prices.
Strategy:
Hit the TP1 target, or
Exit after 50 candles, or Stop loss
If you want to read more about ChainLink on CoinMarketCap, click here .
What do you think?
Still learning here, so any constructive feedback and positive vibes to improve my analysis are welcome.
But if you enjoy my chart, please like, comment or follow me. :)
Thank you and Happy trading!
------------------------------------------------------
Some of my charts represent actual trades, and some are just paper trading.
Needless to say, this is not financial advice!
Diamondpattern

VETUSDT diamond pattern$VET broke down from parallel channel , and confirm the support as resistance. now price can make a diamond pattern here that is a reversal pattern, so start a new rally.

BTTUSDT diamond patternBTT broke down from parallel channel, and confirm the support as resistance. now price can make a diamond pattern here that is a reversal pattern, so start a new rally.
BLong

Gold. A bit "tricky" on the triangle/diamond pattern. 24 May 21Gold. with clearest pic now on its " triangle or diamond pattern now".Gold..still possible to resuming its uptrend till around 1905-1910.. Where two upper trend line "meet up" with supply zone.
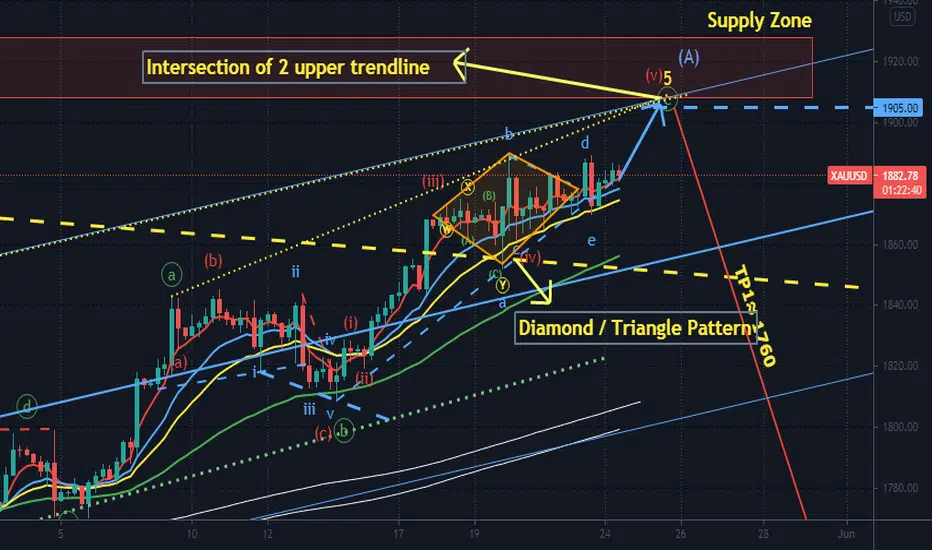
Gold - "Like Diamond in The Sky" -Rihanna. Updated 21 May 21Gold is forming a "bullish diamond / triangle " pattern. SL @ 1852, Tp @ 1905, A risk : reward of about 0.75 : 1 ( not good )( min 1 : 3)

BITCOIN - SHORT TERM DIAMOND - SYMETRICAL TRIANGLE Dear traders,
Here is a quick update for Bitcoin.
We are looking at the 30 minute chart of Bitcoin and see an inverted Head shoulder formation after which a symmetrical triangle has formed. It is in fact also a DIAMOND pattern.
This Diamond comes after a sharp rise and may indicate a possible short term top but the triangle will make it clear with an breakout above or below the triangle.
My last analysis showed big profits with the Diamond pattern but as you know nothing works always for 100%. It is always adopting redrawing the picture to have the most updated charts.
Gyu's on a breakout downwards we may see lower prices and vice versa if the price breaks out upwards.
We see that volume increases in the decline and decreases in the rise. That is a bearish sign. Volume is always very important to validate breakouts as is the same with re-testing trendlines .
Target at breakout upwards 49562 and downwards possibly again USD 30000.
A breakout upwards will also further validate the Inverted head and shoulder pattern form my previous analysis. Target around 50000 USD.
Stops at an upward breakout need to be placed below the last swinglows and vice versa at an upward triangle breakout.
----->> Traders please follow me for updates and if you give me support with a like👍 then that will motivates me a lot to continue💚 - Thanks guy's! <<---
Safe and happy trading!
Disclaimer Traders this is my view no advice to buy or sell. Also always do your own research before taking positions!

ETH CorrectionDiamond pattern at the Top of ETH after strong bullish impulse.
Bearish MACD divergence at double top.
We could see a healthy retracement on ETH.
Let me know what do you think. And thumb up if you find this is good content.
Peace and Joy!
Crypto SolArb

Diamond pattern forming for EthereumThere's a diamond pattern in play for Ethereum which could resolve in a huge breakout.
the RSI Indicator shows an underbought market, which means that the chance is higher to see an upside breakout of this diamond pattern.
This is no financial advice.

Ethereum ETH bearish diamond pattern is forming.Diamond patterns are notorious reversal patterns. When in a downtrend, a forming diamond could mean the start of an uptrend. Viceversa, when in an uptrend, a forming diamond could mean the start of a downtrend.
In this chart i’m identyfing the upper trend line from the previous channel as a new bottom for ETH. I could obviously be wrong and this keeps climbing, or the trend line that i’m identyfing as bottom could be wrong too.
Good luck, and stay safe!
Not financial advice.

Potential Diamond 💎 Top on ETHAfter this amazing eth run last days we consolidating between this fib lvls and now we set up a potential Diamond top watch out there is sum 2.8k-3k potential

Ethereum ready for a pullbackIt looks like we have a diamond top formation playing out for Ethereum at the moment, and as such, can expect to see a correction. A pullback to the EMAs, whether that means pinning them or pulling them all tightly together, seems like a probable outcome to me. I'm leaning towards a tightening of the EMAs being the most probable outcome, followed by a new set of surges to the upside.
Short-term
Short if comfortable shorting anything in a strong uptrend, but beware of fakeouts before the actual pullback. Better to enter on confirmation of support having turned resistance, or at the very least scale into the position with the lowest possible leverage from the get go. Adjust on having seen a solid confirmation of the correction.
Medium-term
Build longs on the way down: small position sizes and low leverage. Up the stakes after only after a reversal pattern and a continuation to the upside stands out as the most probable outcome, meaning confirmed on multiple timeframes and backed by price action.

ETH.USDT (Y21.P3.E1).Diamond formationHi All,
Diamond formations are reversals and at times continuation patterns.
What do you think it is?
If you do your count on this structure, you will have your answer. ABCDE.
All the best,
S.SAri

Diamond Breakdown With TargetsI'm expecting a brief 25-30 percent correction before continued upside. Bearish Profit taking targets will be at around the $6.90 area with Stoplosses above $10.24
I expect that after GEL retraces back down to the $6.90-$6.40 Levels that it will continue it's uptrend:
For bullish Targets on GEL refer back to my original Bullish idea on the Related Ideas tab

BTC could be playing baseball with this diamondThis diamond pattern could be playing out in the short term for bitcoin! Keep an eye out for a breakout and possible retest! GOOD LUCK!

SPX - Bear Diamond Break ConfirmedNice recovery in the early AM as the .618 of the Blue Dashed Channel Held. Looking to break .786 resistance.

BTC Bearish Diamond Top Pattern Forming???Bearish Diamond Top Pattern possibly forming from ATH to test several support levels below.
It may be a good time to short and accumulate more.
The weekend is here and you know how it goes with Bitcoin! You just never know.
Have a good one!

Quick Daily Dow Decision DiamondWhile the interwoven diamond pattern is a strong bearish signal, it does not actually provide strong guidance as to the very local direction of the next miny-swing in the DJI.
It seems that we will either test that upper trendline once more (as would be consistent with the past year of whipsaws), or, we do not.
I have a strange feeling it will not and the red path displayed will set fourth the new Dow trend lower.
The difference is sort of semantic - but it does highlight the "rigging" type nature that markets exude during market "crashes."
-4-D Pig
DJCFD:DJI
GLOBALPRIME:US30
DJCFD:DJT
NASDAQ:NDX
SPCFD:SPX

BTC : Diamond on the horizonThis Diamond formation in H1 will likely surge the price violently weather up or down, bets are open I go long personnally.
Safe trade, don't bet like me and wait for breakout for confirmation.
Cheers !


$FETUSD - Diamond and Head and ShouldersHello everyone!
Another diamond pattern spotted here. This time for fetusd.
Short here or wait for a breakout from the dynamic support (pink).

BTC - H1 - DIAMOND PATTERN IN PROGRESSH1 : A very rare pattern (diamond) is in progress.
It could be to some extend assimilated at an Head and Shoulder pattern too.
Watch carefully price action over the coming hours and also watch price action
on M15 as clouds support zone is currently under attack

Nio - Working out of a Diamondsolid bull pressure out of the iH&S this morning. Turned over with the market, with purpose, as the bull flag failed.