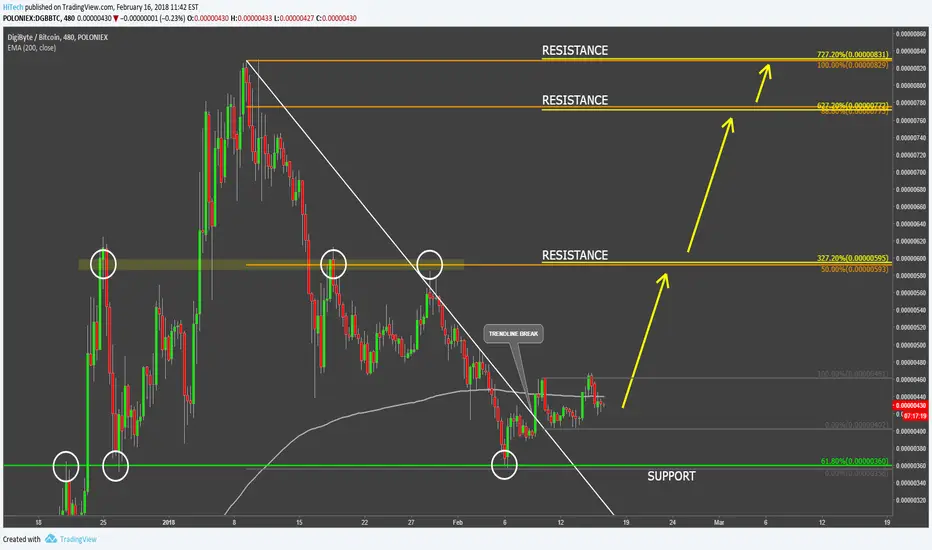
DigiByte VS Bitcoin Signs of ReversalDidiByte found the resistance at 830 satoshi and corrective wave down started, resulting in a 56% loss to the Bitcoin. The decline of the DGB/BTC price was stopped by the 61.8% Fibonacci retracement level applied to the 07.12.17-10.01.2018 wave up.
After the clean rejection of the Fibonacci support, the price went up and broke the 200 Moving Average and the downtrend trendline, suggesting the potential change in the medium term trend. Although range trading could be extended a little longer the growth potential remains. DigiByte is expected to rise towards one of the 3 resistance levels confirmed by two Fibs.
First resistance: 600 Satoshi
Second resistance: 770 Satoshi
Third resistance: 830 Satoshi.
If price will break above first resistance is will become very likely that DigiByte will produce a double top, hitting the area between 770 and 830 sats. Daily break and close above the 830 sats resistance should confirm a long-term uptrend. On a downside. Daily break and close 360 could invalidate bullish outlook.
Digibyte
What do You think? Verge VS DGBHello Traders!
I have found a suitable comparison. Generally speaking, history repeats itself and the price always comes back. To be honest, we all love something new, for example, we need to change cars once a year or fly to different countries, in the case of DGB and XVG, I can safely assume that we are dealing with one major player in the market who likes to change things once a year.
Let's start the analysis. In the last few weeks XVG showed a weak downward trend. The RSI was below 50, bears in the market, the same trend is confirmed by the MACD which is now below zero. In the next few weeks, I expect that the Verge will be traded at 750-700 Sats, and then smoothly reach its fair price the same as DGB did. I will follow the daily schedule closely, because I'm very interested in whether the coin price can break through the center line (MACD) and how strong the trend will be, how rapidly will the market move within this trend.


DGB/BTC Closed Above Resistance. (4H Chart)DGB is looking strong. Candle close above resistance line on 4h as well as daily chart. MACD cross on Daily.
Small write up I know, but a pretty straightforward chart. Last time when the chart had a profile like this it went parabolic up to 2500 sats very quickly, but I'm just shooting for 1200-1400 sats for my target for now. Keep in mind BTC could still fall back after hitting the upper resistance of the channel which could mess this up.

dgp usd long idea title. Based off technical and fundamental data. Price has already reach 1B market cap, nothing stopping is from reaching 10B. After 10B has been hit then the news and hip will take over including new exchanges accepting dab transactions.
To sum up, please do your own research... But a picture speaks a thousand words - steemit-production-imageproxy-upload.s3.amazonaws.com


DGB fails to maintain supportDGB fails to recover back above the previous Trendline Support (B).
Also, failed to stay above Trendline Support (A) forming new Trendline Support (C).
If DGB fails to stay above Trendline Support (C), expect to see further downtrends.
DGB has yet again disappointed many investors.
Sorry guys. This one doesn't look like it's going anywhere, anytime soon.


Be carefull with DGB, however upside potential is present! Currently DGB is trading on the support zone of the Ichimoku cloud. The same situation occured end of january / beginning of february. This resulted in a steep drop. If it Holds and does not break out on the bottom there is a good chance it will prepare itself to break out of the cloud in the coming days or at least test the resistance.
If the resistance gets broken first target will be around 750-800

DigiByte DGB on 500% Profit Trajectory (MEDIUM RISK)Digibyte is on a med - long term trajectory path to 5x it's current levels. If you have patience, enter this trade until target is reached or comfort target is achieved.
Do not invest what you can't afford to lose. We are not your financial advisors.


Watchlist update 01 | DGB, BTC, SUB (Expecting pullbacks)Hey guys, this is a quick overview of a few of my watchlist items. Keeping to the Tradingview 10 minute limit until I get something on Youtube sorted out, I decided to start doing updates on what I'm looking at in the markets. I'll try to quickly work up toward publishing one of these daily with regular updates of all of my main ideas as well as updates on future projects if they arise.
This update quickly skims over SUB and BTC with a shoutout to the fella who recommended that I begin doing some T.A. on the USD pairs against the BTC pairs for comparison. The differences are quite telling and so he has a point, I completely agree!
Here are some cool articles to chew on for today regarding the state of the market.
Here's the link to that awesome Substratum (SUB) review mentioned in the previous idea:
youtu.be
A link to Clif High's website:
www.halfpasthuman.com
Digibyte: www.digibyte.co
Substratum: substratum.net
By the way, apologies for the microphone blowing...I'll take the mic out of my mouth next time :D

DGB/BTC PoloniexI have a love and hate relationship with DGB.
Currently, I hate it.
Why did you have to fall & stay below Trendline Support (B)???
Falling below Trendline Support (A) will be worst and worst news.
It needs to smash through both Trendline Resistance and Trendline Support (B) or there to be any reason to buy in.
No recommended buys for this coin.
Sorry HODLERS.

DGB/BTC PoloniexDGB fails to maintains support from both Trendline Support (A) & (B). This looks bad for DGB. Downtrend! Not a good night for DGB.

DGB/BTC PoloniexDGB manages to stay above Trendline Support (B), forming a new Trendline Support (A).
If it breaks above the Trendline Resistance, expect to see a continued upward movement.

DGB/BTC POLONIEXIf DGB finding support at Trendline Support (A).
A fall below Trendline Support (B) is bad news for DGB/BTC and will signal a further downtrend.
Needs to break above Trendline Resistance for a buy recommendation to be established.
Will update again as the days progress throughout the week.

$DGB Buy This is a coin that will provide very nice returns over the next few months.
Will be Holding this for the next little while :)

New Paradigm Chart Vs BitcoinBitcoin seems to be following the New Paradigm Chart very well. I'm not a Bitcoin hater, I want Bitcoin and the Alt coins to succeed, but we can't wear rose colored glasses we have to be realistic. Bitcoin looks bearish still. It would seem a correction to $4500-5000 then back up to around $7500, then back down again to $3000 where we fall under the 'mean'.
I still have I hopes for Bitcoin and Alts coins and believe they are here to stay, but as far as right now Bitcoin going back to $20,000 and beyond doesn't seem likely.


Where is Bitcoin going to find it's bottom?Bitcoin was in an ascending channel (green channel) for a long time then broke out above it. If Bitcoin continues to drop I believe will see it find support on the top of the green channel which places it around $4500-5000 . If it fall's further I can see it playing in the green channel for some time at round $2500-3000. When play time is over we could see it break out of the channel once again and makes it's way back up.
If your on Poloniex I made a similar chart of Bitcoin

Digibyte Trade Idea 8 February 2018 (100%+ gains possible)Digibyte Trade Idea 8 February 2018
The coin I've started with mid 2017 (at least, becoming more active in this market, fascinated by the big swings from coins).
What do we see on this chart? A lot of things!
- Retraced all the way down to even 70 sats from the big jump earlier in 2017.
- Climbing back up, breaking the green zone --> red zone became resistance (big one) and currently retracing back.
Combining this with the following things:
- RSI getting close to the 30 zone --> oversold
- Volume spikes during the accumulation fase, we've seen that before.
- Lying on the 0.618 fib retracement level from the first run up.
- Lying on the 200 EMA too.
- Facing resistance pretty soon.
Expecting this one to jump to the red resistance zone pretty soon. So I'm definitely buying in this area and holding for a while.
First target: 600 sats
Second target: 800 sats
Depending on the patterns then + maybe some FA coming in to play + potentially breaking that level, could induce that we will see another big run up.
Will keep you posted about this one weekly.

