DJI H4 HTF Pullback and Bearish Continuation Setup📝 Description
CAPITALCOM:US30 on the H4 timeframe is reacting after a strong impulsive bullish leg into premium pricing. Recent price action shows loss of upside momentum and a corrective distribution phase near HTF resistance, suggesting a potential bearish continuation toward lower PD arrays.
________________________________________
📈 Signal / Analysis
Primary Bias: Bearish while price remains below the recent H4 lower high and supply reaction zone
Preferred Setup:
• Entry: 48,514
• Stop Loss: Above 48,640
• TP1: 48,422
• TP2: 48,304
• TP3: 48,062 (HTF draw / deeper liquidity)
________________________________________
🎯 ICT & SMC Notes
• Rejection from HTF premium and structural resistance
• Current move classified as a corrective pullback within a bearish leg
• H4 FVG and OB below act as natural draw targets
________________________________________
🧩 Summary
As long as price fails to reclaim the recent H4 supply zone, the expectation remains a continuation to the downside toward stacked HTF liquidity levels and unmitigated PD arrays.
________________________________________
🌍 Fundamental Notes / Sentiment
Ongoing global policy uncertainty, resurfacing trade-tariff risks, and rising bond yields are tightening financial conditions and weighing on equities. With risk appetite fragile and macro headlines driving volatility, Dow Jones faces downside pressure, and rallies are likely corrective rather than trend-changing.
________________________________________
⚠️ Risk Disclosure
Trading involves substantial risk and may result in capital loss. This analysis is for educational purposes only and does not constitute financial advice. Always apply proper risk management, predefined stop-loss levels, and disciplined position sizing aligned with your trading plan.
DJI

DOW JONES in synch with the USD to start a massive correction.Dow Jones (DJI) has been trading within a 17-year Channel Up ever since the bottom of the 2008 U.S. Housing Crisis. This is not the first time we give you this pattern, so I won't be getting into too much detail on its specifics.
What we do combine it with for the first time though, is the DXY (black trend-line), which has also been trading within a Channel Up since 2008, a direct consequence of the monetary policies that were applied globally by central banks to save the system following that credit-shock event.
What this cross symbol comparison offers, is give a clear unbiased illustration of the patterns and correlation involved between the stock market and DXY (U.S. Dollar Index). Most times that the DXY bottoms (green circles), Dow peaks its Bull Cycle and starts a correction (Bear Cycle, as shown in red). All of Dow's Bear Cycles have either pulled back to the 0.382 Fibonacci retracement level or the 1W MA200 (orange trend-line) or even both.
As a result, we estimate Dow to target 40000 by the time one of the above takes place, which can coincide with the DXY hitting the top of its inner Channel Down, similar to what it did during the previous two such smaller patterns within the main 17-year Channel Up.
---
** Please LIKE 👍, FOLLOW ✅, SHARE 🙌 and COMMENT ✍ if you enjoy this idea! Also share your ideas and charts in the comments section below! This is best way to keep it relevant, support us, keep the content here free and allow the idea to reach as many people as possible. **
---
💸💸💸💸💸💸
👇 👇 👇 👇 👇 👇

Potential reversal ahead?US30 showed a retracement of the former bullish impulse.
Opening today shows some bullish demand at opening bell.
One conclusion could be, that the retracement may have come to an end....

DJI - Ascending Channel Rejection at 49,000 | Trump Policy
Executive Summary
Dow Jones Industrial Average (DJI) trading at 48,996.08 after a sharp 466-point drop (-0.94%) on January 7, 2026. Price rejected from the upper ascending channel resistance near 49,600 and is now consolidating within a key support zone between 48,500-49,000. Despite the pullback, the Dow just triggered a rare Dow Theory buy signal on January 6 when both the Dow Industrials and Dow Transports hit record highs simultaneously - the first such signal in over a year. Trump policy headlines creating volatility, but the secular bull market remains intact.
BIAS: CAUTIOUSLY BULLISH - Support Zone Test
The trend remains bullish on higher timeframes. Current pullback is a healthy consolidation within the ascending channel. Watch the 48,500-49,000 support zone for bounce or breakdown.
Current Market Data - January 8, 2026
Current Price: 48,996.08 (-466.00 / -0.94%)
Day's Range: 48,951.99 - 49,621.43
52-Week Range: 36,611.78 - 49,621.43
Market Status: Closed (Last update Jan 7, 17:00 GMT-5)
Index Type: CFD
Performance Metrics:
1 Week: +1.29%
1 Month: +2.14%
3 Months: +5.09%
6 Months: +10.15%
YTD: +1.85%
1 Year: +14.45%
All timeframes positive. Best 4-day start to a year since 2018 (+1.9% through first 4 trading days).
THE BIG STORY - Dow Theory Buy Signal + Trump Policy Chaos
Historic Dow Theory Signal
On January 6, 2026, the Dow Theory flashed a bullish signal for the first time in more than a year. Both the Dow Jones Industrial Average and Dow Jones Transportation Average tallied record closing highs on the same day - a classic confirmation that the secular bull market remains alive and well.
Key points:
Dow Industrials hit record high of 49,462.08 on Jan 6
Dow Transports hit first record since Nov 25, 2024
100-year-old indicator confirms bull market intact
Rotation trade benefiting cyclicals and value stocks
Transportation stocks big beneficiaries of rotation
Trump Policy Headlines Creating Volatility
We're only one week into 2026 and the market is already dealing with a flood of geopolitical headlines:
Trump called for 50%+ increase in U.S. defense budget to $1.5 trillion by 2027
Executive order blocking defense contractors from dividends/buybacks until they speed up production
Plans to ban Wall Street firms from buying single-family homes
U.S. intervention in Venezuela - deal to import $2B of Venezuelan crude
"Donroe Doctrine" drama targeting Greenland, Colombia, Cuba
European defense stocks hitting record highs on spending expectations
MACRO DRIVERS - What's Moving the Dow
1. Defense Sector Turmoil
Trump's executive order sent defense stocks tumbling:
Lockheed Martin (LMT): -4.8%
Northrop Grumman: -5.5%
General Dynamics: -3.6%
RTX (Raytheon): -2.5%
European defense stocks at record highs (BAE +5.8%, Leonardo +4.4%)
Stocks bounced in afterhours trading
2. Financial Sector Weakness
JPMorgan Chase (JPM): -2.3% after Wolfe Research downgrade
Blackstone: -5.6% on housing ban news
Invitation Homes: -6% on single-family home ban
Banks expected to report higher Q4 profits next week
Investment banking revenue accelerating
3. Labor Market Data Mixed
JOLTS: Job openings fell to 14-month low in November
ADP: Private payrolls +41,000 in December (weak)
Initial jobless claims: 214,000 (better than expected)
Friday's NFP report is the key data point
Unemployment expected to drop to 4.5% from 4.6%
4. Fed Policy Outlook
83% odds Fed pauses at Jan 27-28 meeting
Hot economy could mean fewer rate cuts
Need unemployment near 5% for significant easing
Few economists expect that in near term
Rate cut expectations fading
5. Venezuela Oil Deal
Trump deal to import up to 50 million barrels of Venezuelan crude
U.S. "selectively rolling back sanctions" on Venezuelan oil
Revenue to stabilize Venezuela economy
Repay Exxon and ConocoPhillips for nationalized assets
Oil prices fell sharply on supply expectations
Brent: $59.96 | WTI: $55.99
Technical Structure Analysis - 45 Minute Timeframe
Ascending Channel Pattern
The chart shows a well-defined ascending channel (blue shaded area):
Lower trendline support connecting higher lows
Upper trendline resistance connecting higher highs
Channel intact since mid-December
Price rejected from upper channel resistance near 49,600
Currently testing mid-channel support zone
Dashed midline providing dynamic support/resistance
Key Price Action
Jan 6: Hit record high 49,462.08 (Dow Theory confirmation)
Jan 7: Rejected from 49,621.43 intraday high
Sharp 466-point drop (-0.94%)
Now consolidating at 48,996.08
Testing critical support zone
Key Levels
Resistance:
49,621.43 - 52-WEEK HIGH / Day's high (red line)
49,462.08 - Jan 6 record close
49,300-49,400 - Upper channel resistance zone (pink box)
50,000 - Psychological round number
Support:
48,951.99 - Day's low / immediate support
48,500-49,000 - Current support zone (pink box on chart)
48,300 - Channel midline support (dashed line)
47,600 - Lower channel support (red line)
47,300 - Major support level
SCENARIO ANALYSIS
BULLISH SCENARIO - Bounce from Support Zone
Trigger Conditions:
Price holds 48,500-49,000 support zone
Bullish rejection candle on 45min/1H
Volume confirmation on bounce
Defense stocks stabilize
Friday NFP comes in strong
Price Targets if Bullish:
Target 1: 49,300-49,400 (upper channel)
Target 2: 49,621 (52-week high retest)
Target 3: 50,000 (psychological)
Extended: 50,500+ (new ATH territory)
BEARISH SCENARIO - Channel Breakdown
Trigger Conditions:
Price breaks below 48,500 support
Volume confirmation on breakdown
Defense sector continues selling
Weak NFP data Friday
Fed hawkish signals
Price Targets if Bearish:
Target 1: 48,300 (channel midline)
Target 2: 47,600 (lower channel support)
Target 3: 47,300 (major support)
Extended: 46,500 (deeper correction)
NEUTRAL SCENARIO - Range Consolidation
Most likely short-term outcome:
Price consolidates between 48,500-49,300
Wait for Friday NFP for direction
Digest Trump policy headlines
Healthy consolidation before next leg
Dow Theory signal provides floor
MY ASSESSMENT - CAUTIOUSLY BULLISH
Bullish Factors (Dominant):
Dow Theory buy signal (first in over a year)
Best 4-day start since 2018
All performance metrics positive
Secular bull market intact since Oct 2022
Ascending channel structure holding
Rotation into cyclicals/value continuing
Strong Q3 GDP (4.3%)
Banks expected to report strong Q4
M&A activity surging
Bearish Factors (Caution):
Sharp rejection from 52-week high
Defense sector turmoil (Dow components)
Trump policy uncertainty
Fed rate cut expectations fading
Friday NFP risk event
Elevated valuations (98th percentile)
My Stance: CAUTIOUSLY BULLISH - Buy Support Zone
The Dow Theory signal is significant - this 100-year-old indicator just confirmed the bull market is alive. The pullback from 49,621 to 48,996 is a healthy 1.3% correction within the ascending channel. The 48,500-49,000 support zone is the key level to watch.
Strategy:
Watch for bounce at 48,500-49,000 support zone
Long on bullish rejection candle with volume
Target 49,300-49,400 (upper channel)
Extended target 49,621 (52-week high)
Stop below 48,300 (channel midline)
Wait for Friday NFP before large positions
Trade Framework
Scenario 1: Support Zone Bounce
Entry Conditions:
Price tests 48,500-48,800 zone
Bullish rejection candle (hammer, engulfing)
Volume spike on bounce
RSI oversold on lower timeframes
Trade Parameters:
Entry: 48,500-48,800 at support
Stop Loss: 48,200 below support zone
Target 1: 49,300 (upper channel)
Target 2: 49,621 (52-week high)
Risk-Reward: ~1:2.5
Scenario 2: Breakout Above 52-Week High
Entry Conditions:
Price breaks above 49,621 with volume
Momentum indicators confirming
Strong NFP data Friday
Trade Parameters:
Entry: 49,650-49,700 on confirmed breakout
Stop Loss: 49,200 below recent support
Target 1: 50,000 (psychological)
Target 2: 50,500 (new ATH territory)
Risk-Reward: ~1:2
Scenario 3: Channel Breakdown
Entry Conditions:
Price breaks below 48,300 channel midline
Volume confirmation
Defense stocks continue selling
Trade Parameters:
Entry: 48,200-48,300 on confirmed breakdown
Stop Loss: 48,700 above breakdown level
Target 1: 47,600 (lower channel)
Target 2: 47,300 (major support)
Risk-Reward: ~1:1.5
Risk Management Guidelines
Position sizing: 1-2% max risk per trade
Friday NFP is major risk event - reduce size before
Trump headlines can move markets suddenly
Defense stocks are Dow components - watch sector
Scale out at targets
Don't fight the trend - it's still bullish
Key Events to Watch
Thursday Jan 8: Initial jobless claims, trade deficit, Q3 productivity
Friday Jan 9: December Non-Farm Payrolls (KEY EVENT)
Next Week: Bank earnings begin (JPM, BAC, WFC, C)
Jan 27-28: FOMC Meeting (83% odds of pause)
Invalidation Levels
Bullish thesis invalidated if:
Price closes below 47,600 (lower channel)
Dow Transports break down significantly
VIX spikes above 20
Major geopolitical escalation
Bearish thesis invalidated if:
Price closes above 49,621 (new ATH)
Strong NFP data Friday
Defense stocks recover
Fed signals more rate cuts
Conclusion
The Dow Jones Industrial Average is at a critical juncture after rejecting from the 52-week high. The Dow Theory buy signal confirms the secular bull market is intact, but Trump policy headlines are creating short-term volatility.
The Numbers:
Current Price: 48,996.08
52-Week High: 49,621.43
YTD Performance: +1.85%
1-Year Performance: +14.45%
Best 4-day start since 2018
Key Levels:
49,621 - 52-WEEK HIGH (bullish target)
49,300-49,400 - Upper channel resistance
48,996 - Current price
48,500-49,000 - Support zone (WATCH THIS)
47,600 - Lower channel support
The Setup:
Dow Theory just flashed a buy signal for the first time in over a year. The ascending channel is intact. The pullback is healthy. Watch the 48,500-49,000 support zone for the next move.
Strategy:
Buy support zone (48,500-49,000)
Target 49,300-49,400 (upper channel)
Extended target 49,621 (52-week high)
Stop below 48,300
Wait for Friday NFP for confirmation
The Dow Theory signal says the bull market is alive. Trade accordingly.
List your thoughts below!

DJI M30 RSI Reset and Bullish Mean Reversion Setup📝 Description
Dow Jones on M30 is still trading inside a bullish HTF context. After the recent corrective drop, RSI has fully reset and is now sitting in a zone that historically aligns with price reversals to the upside. This tells us downside momentum is exhausted and the market is getting ready for a bounce.
________________________________________
📈 Signal / Analysis
Primary Bias: Bullish while holding above 48,800
Long Setup (Preferred):
• Entry (Buy): 48,820 (HTF FVG)
• Stop Loss: Below 48,750
• TP1: 48,930
• TP2: 49,075
• TP3: 49,230
________________________________________
🎯 ICT & SMC Notes
• RSI in reset / reversal zone
• Corrective move, not impulsive selling
• Price holding near HTF FVG support
________________________________________
🧩 Summary
With RSI showing exhaustion of sellers, the market looks ready for an upside rotation. As long as price remains above the current support, the probability favors a bullish continuation toward higher liquidity levels.
________________________________________
🌍 Fundamental Notes / Sentiment
Strong ISM Services supports economic strength and favors upside in the Dow. Softer JOLTS does not challenge the bullish trend, with pullbacks likely offering continuation opportunities.
________________________________________
⚠️ Risk Disclosure
Trading involves substantial risk and may result in capital loss. This analysis is for educational purposes only and does not constitute financial advice. Always apply proper risk management, predefined stop-loss levels, and disciplined position sizing aligned with your trading plan.

S&P500 Index Guess for 2026 Using Wall Street Ests
S&P 500 Index
19 hours ago
S&P500 Index Guess for 2026 Using Wall Street Ests
1
1
Grab this chart
256
19 hours ago
Wall Street each January makes an estimate for the year ahead S&P500 Index, the largest index used for indexing returns and for managing capital. It's a fascinating practice to take a 'snapshot' of the mentality of the collective wisdom of Wall Street brokerage firms. These are the top 12 brokers in the US which guide portfolio managers globally.
I included the long term average of 9%-10% as a reference so you can see that in 2025 Wall Street was bullish and clustered right around the average return as shown by the cluster of black rectangles. Oddly, the previous year estimates seem to have a "value support" function too where the market held on the pullback in the first quarter of 2025 at the level of the 2024 guesses. See for yourself how this worked in 2025.
You can also see that the cluster of guesses around 6600 in the SPX created multiple rounds of volatility in the fall of 2025 as the market ran into selling at the "common guess level". This turbulence could have been the result of people either raising cash or rotating from growth to value stocks in the 3rd-4th quarter.
So, on initial glance for 2026, I think the mid-term elections will have the most impact on the market and the uncertainty will cause sideways action through the year and finish with a sub-average, but positive year. IF we go under 6400, then I could see the market head down to 6200-6000 where I had seen it for last year.
Either way, stay tuned as I update this "guess" along the way as I have done in years past. Overall, the batting average is quite good, but decide for yourself.
Wishing you all a healthy and successful 2026!
Tim West
January 6, 2026 2:16PM EST
(hidden since yesterday due to additional scripts accidentally left on the chart hidden)

DOW JONES Strongest sell signal in 2 months.Last week (see chart below) we gave a buy signal on Dow Jones (DJI), which easily hit our 48650 short-term Target, as the price found support inside a tight Triangle pattern:
This time, a strong sell opportunity is emerging (in fact strongest in two months) as we move to the longer 1D time-frame, where Dow has been trading within an 8-month Channel Up that is very close to its top (Higher Highs trend-line).
The 1D RSI however is already touching its multi-month Resistance Zone, which makes it a prime Sell Signal already as the last time it was there was almost 2 months ago (November 12 2025). What followed this was a strong -5.59% technical pull-back that found support exactly on the 1D MA100 (green trend-line) at the bottom of the Channel Up.
Basically, the current Bullish Leg has also just completed a +8.59 rise, which is the most a Bullish Leg has grown within this pattern. And since a -4.00% correction has been the usual decline on all corrections also, we expect Dow to hit the 47900 - 47600 Target Zone, consisting of the 1D MA50 (blue trend-line) and 1D MA100 respectively, with Support 1 in between.
Keep an eye also on the 1D RSI Support Zone. If it gets hit before any of those targets, it will be a good idea to take the profit on the shorts then, regardless of the price.
---
** Please LIKE 👍, FOLLOW ✅, SHARE 🙌 and COMMENT ✍ if you enjoy this idea! Also share your ideas and charts in the comments section below! This is best way to keep it relevant, support us, keep the content here free and allow the idea to reach as many people as possible. **
---
💸💸💸💸💸💸
👇 👇 👇 👇 👇 👇

DJIA: Major Formation About to Breakout!Hello There,
welcome to my new analysis about the Dow Jones Industrial Average Index (DJIA). The index recently came through with some important developments that caught my attention. Especially, the bullish build-up should not be underestimated here. Currently, the index has already completed a main formation, which is setting up the path for further price action upcoming. In my analysis I detected the most important signs to consider for the upcoming price action.
As when looking at my chart, we can see there that the DJIA is trading within this major ascending channel formation. Within this formation, the Dow Jones already bounced several times within the lower boundary. These signs are really bullish and point to a continuation of the bullishness and a major breakout just about to set up. Currently the index is already penetrating the upper boundary of the ascending channel, marking a structure from which a breakout is likely.
The most important part within this whole structure is the inverse head and shoulder formation. Within this formation, the left shoulder and the head were already formed. Now the index is about to complete the right shoulder of the whole formation. Once the breakout happens and the index stabilizes above the neckline, the whole formation will be completed. Once this major breakout happens, the target zones as seen in my chart will be activated.
What should not be underestimated here also is that a majority of analyst recommendations point in the bullish buy direction. Therefore, the index is currently considered as a strong buy candidate. Also, there are many major industry developments that support further bullish price action within the next times. Especially when the index attracts more industry leverage from major firms moving into the market, this will also confirm the breakout from a fundamental perspective.
Right now, we will watch out for the major confirmational price actions to set up within the upcoming times. Especially when a strong breakout happens, this will confirm the next steps within the structure. Currently, there are not many signs of invalidation. However, when the index falls below the 48600 level, this will firstly invalidate the bullish continuation. If this happens, further assumptions need to be made.
With this being said, it is great to consider the important trades upcoming.
We will watch out for the main market evolutions.
Thank you very much for watching!

DOW JONES Triangle started a Bullish Leg.Dow Jones (DJI) has been trading within a Triangle pattern on the short-term, with the price making a Higher Low on Wednesday on its bottom. With the 4H RSI rebounding just after it breached below the 30.00 oversold barrier, we expect the pattern to start its new Bullish Leg now.
A +1.30% rise to test its top (Lower Highs trend-line), would still be a minimum based on all the Bullish Legs that preceded. As a result, our short-term Target (unless the 4H MA50 rejects the uptrend) is 48650.
---
** Please LIKE 👍, FOLLOW ✅, SHARE 🙌 and COMMENT ✍ if you enjoy this idea! Also share your ideas and charts in the comments section below! This is best way to keep it relevant, support us, keep the content here free and allow the idea to reach as many people as possible. **
---
💸💸💸💸💸💸
👇 👇 👇 👇 👇 👇

Stocks Fall Pre-Bell as Traders Await Fed Meeting MinutesUS stock futures were mostly steady overnight Monday as Wall Street looked to regroup after a tech-led slide to begin the final stretch of 2025.
Futures tied to the Dow Jones Industrial Average futures (YM=F), the S&P 500 (ES=F), and the tech-heavy Nasdaq (NQ=F) all hovered around the flatline.
The major Wall Street indexes fell modestly Monday, as Nvidia (NVDA) and Tesla (TSLA) led megacaps lower amid a small rotation out of tech stocks. Traders are reassessing — and perhaps taking profits before the end of the year.
Tuesday brings the release of the minutes from the Federal Reserve's December meeting, at which it cut interest rates for a third straight time but signaled it may pause those cuts in the months ahead. The minutes will serve as one of the final potential market-moving catalysts of 2025, with only a reading on weekly initial jobless claims — on Wednesday morning — remaining on the calendar before the new year.
The central bank's meeting readout could add fresh insight for investors looking for clues on the Fed's next move in January, with the divisions that have gripped the central bank in 2025 likely to continue into the new year. Around 84% of bets are on the Fed standing pat at current interest rate levels next month, though traders about equally split on what the committee will do in March.
The Dow Jones (DJI) is down 0.51% moving in a bearish symmetrical triangle pattern. If the stocks keep tanking the DJI index will be approaching the $40k zone. With the RSI at 58, there are high chances that DJ:DJI might consolidate and go dipper to the $40k zone.

US30 PULLBACK AHEAD|SHORT|
✅DOWJONES has delivered a strong bullish displacement into a higher-timeframe supply zone, where buy-side liquidity is now being mitigated. The reaction suggests smart money distribution at premium, with a likely short-term pullback as price seeks internal liquidity below. Time Frame 3H.
SHORT🔥
✅Like and subscribe to never miss a new idea!✅

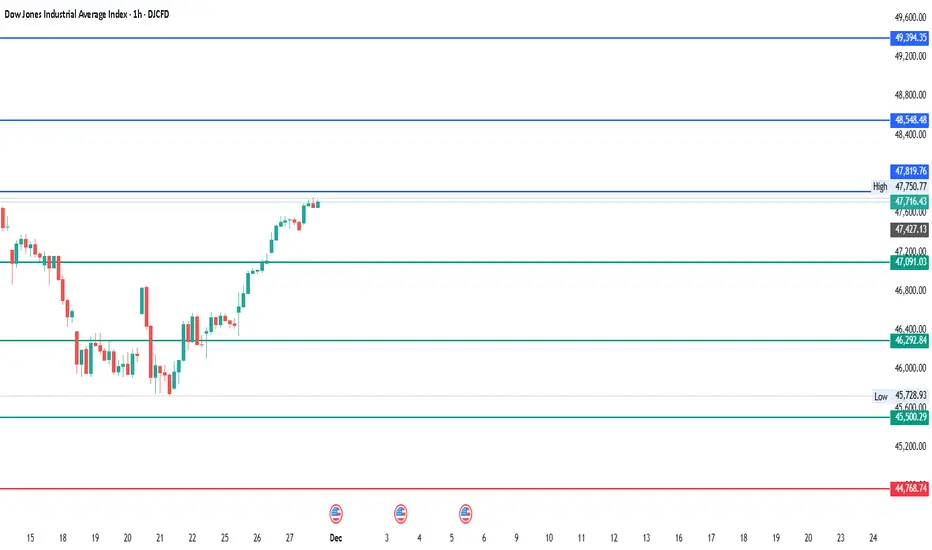
#DJI - 3,000 Points on Cards?Date: 01-12-2025
DJI - Current Price: $47,716
Pivot Point: $46,292.84 Support: $45,500.29 Resistance: $47,091.03
Upside Levels:
L1: $47,819.76 L2: $48,548.48 L3: $49,394.35 L4: $50,240.21
Downside Levels:
L1: $44,768.74 L2: $44,037.20 L3: $43,191.34 L4: $42,345.47
#TradingView #Nifty #BankNifty #DJI #NDQ #SENSEX #DAX #USOIL #GOLD #SILVER
DOW JONES Multi-month Bear Cycle to 40000 starting.Dow Jones (DJI) has been trading within a 16-year Channel Up since the 2008 Housing Crisis and approximately every 3.5 years (44 months) it tops and starts a technical correction/ Bearish Leg.
All of those Bear Cycles essentially since October 2011 have eventually pulled-back to the 1M MA50 (blue trend-line) at roughly he 0.382 Fibonacci retracement level. Only once time the 1M MA50 broke significantly and that was in March 2020 during the COVID flash crash, which eventually found Support on the 1M MA100 (green trend-line).
As a result, we expect Dow to start its Bear Cycle in 2026. From the current high the 0.382 Fib stands at exactly 40000, which based on its trajectory is where the 1M MA50 is headed by Q3 2026.
---
** Please LIKE 👍, FOLLOW ✅, SHARE 🙌 and COMMENT ✍ if you enjoy this idea! Also share your ideas and charts in the comments section below! This is best way to keep it relevant, support us, keep the content here free and allow the idea to reach as many people as possible. **
---
💸💸💸💸💸💸
👇 👇 👇 👇 👇 👇

FTSE 100 SHINES BRIGHT, WITHIN A WHISKER OF 10000 EPIC MILESTONEThe FTSE 100 index TVC:UKX is on track for one of its strongest years in decades in the year 2025, delivering a total return of about 18% year‑to‑date and trading just below the round and psychologically important 10,000‑point level by December, 2025.
This rally has been powered by a mix of miners, financials, and select growth names, with a handful of stocks delivering triple‑digit returns and heavily influencing the index.
2025 returns and 10,000 milestone
The FTSE 100 has returned roughly 20% in 2025 including dividends, making it the seventh‑best year on record and the strongest since the post‑financial‑crisis rebound.
By the middle of November, 2025 the index had climbed to around 9,930 points, described as “within a whisker” of 10,000 , and had outperformed major US indices (like S&P 500 SP:SPX and Dow Jones Industrial Average TVC:DJI ) over the year.
Forward‑looking models cited by analysts place many year‑end projections in the mid‑9,000s, underlining that 10,000 is more a timing than a feasibility question if earnings strength persists.
From a structural standpoint, supportive global policy, reasonable valuations, and strong contributions from commodities and financials have underpinned the surge, while the high dividend yield continues to attract both domestic and international investors. The index’s heavy overseas revenue exposure also means that periods of sterling softness have translated into stronger reported profits in 2025, magnifying gains.
Top 5 performers in 2025
Different datasets cut “top” slightly differently, but across major sources the standout FTSE 100 winners in 2025 cluster around a similar, defence-related, group of stocks:
Fresnillo LSE:FRES - precious‑metals miner with a total return around 345%, benefiting from a powerful rally in gold and silver prices and improved operational performance.
Technically saying, Fresnillo stock shows 7 consecutive Bull quarters in a row, as epic breakthroughs of 200-month SMA and multi-year highs has recently occured.
Either precious metals shine bright in 2025, their year-to-date returns definitely are not about "quadruppling in price".
This is why Fresnillo stock feels like 'a repeat mode' of 'MSTR v. 2024'... isn't it.
Airtel Africa LSE:AAF – telecoms and mobile money group with about 171% return, driven by rapid earnings growth, financial inclusion trends, and rerating from previously depressed valuations.
Technically saying, Airtel Africa stock shows 4 Bull consecutive quarters in a row, as epic breakthrough of multi-year highs has recently occured.
Babcock International LSE:BAB – defence and engineering group described as the best‑performing FTSE name earlier in the year, up roughly two‑thirds by May and supported by defence spending tailwinds and balance‑sheet repair.
Technically saying, Babcock International stock shows its best ever calendar year, with nearly 140% YTD return in the 2025.
Rolls-Royce Holdings LSE:RR. - one more defence and engineering group that develops and delivers complex power and propulsion solutions for safety-critical applications in the air, at sea and on land.
Technically saying, Rolls-Royce Holdings stock has nearly doubled in price in 2025, and printed more than 10x over the past 3 years.
Antofagasta LSE:ANTO - is a copper mining group with significant by-product production and interests in transportation. The Group creates value for its stakeholders through the discovery, development and operation of copper mines.
Antofagasta stock has also nearly doubled in price in 2025, following multi-year Bull vibe.
A broader “next tier” that often appears in top‑15 lists includes Next and Games Workshop each returning more than 50% and highlighting the role of retail, niche consumer brands, and copper in the 2025 upswing.
These stocks’ outperformance reflects a combination of cyclical leverage to commodities and defence, structural growth (mobile money, gaming IP), and market rerating from previously low multiples. Their weight in the index means they have had an outsized effect on the FTSE 100’s approach to 10,000.
Key drivers: 2026 fundamentals
Into 2026, large banks and brokers broadly expect the FTSE 100 to “grind higher” rather than explode upwards, with central scenarios pointing to moderate index gains supported by improving earnings and still‑reasonable valuations.
One major house outlines a base case of steady profit growth and a wider spread of contributors, moving away from the narrow group of 2025 winners, while an upside scenario sees the index potentially reaching around 10,800 by December 2026 if global growth accelerates, financial conditions ease, commodity prices remain firm, and sterling weakens.
Fundamentally, several factors look supportive: gradual interest‑rate cuts would relieve pressure on rate‑sensitive domestic sectors; 75–80% of FTSE 100 revenues are generated abroad, so a softer pound would lift reported earnings; and multi‑year capex programmes in energy and defence, such as SSE’s planned £33 billion investment and BAE Systems’ large export contracts, provide visible revenue pipelines.
Offsetting this, downside scenarios focus on risks of a global slowdown, stubborn inflation keeping rates elevated, falling commodity prices, and a stronger pound, which could pull the index back toward the low‑7,000s.
Technical picture into 2026
Technically, analysts describe the FTSE 100 in a mature but still constructive uptrend, with long‑term charts showing a breakout above prior resistance zones in the mid‑9,000s and potential for an extension toward roughly 10,500–11,000 if momentum is sustained.
One widely cited framework highlights an expanding wedge pattern, with 9,500 as a key breakout area and 7,000 as a major historical support zone that would likely attract buyers on any deep correction.
As the index hovers just below the 10,000 mark, that level functions as both psychological resistance and a potential springboard: a decisive weekly close above it, supported by rising volume and breadth beyond miners and financials, would strengthen the case for a attempt of 2026 bull leg.
Short‑ to medium‑term, the risk is that the 2025 rally has already priced in much of the near‑term earnings recovery, making the index more vulnerable to disappointments or sharp commodity pullbacks.
However, history suggests that once (and if) major indices convincingly clear big round numbers, those levels often become support rather than ceilings, especially when underpinned by improving macro data and ongoing dividend appeal.

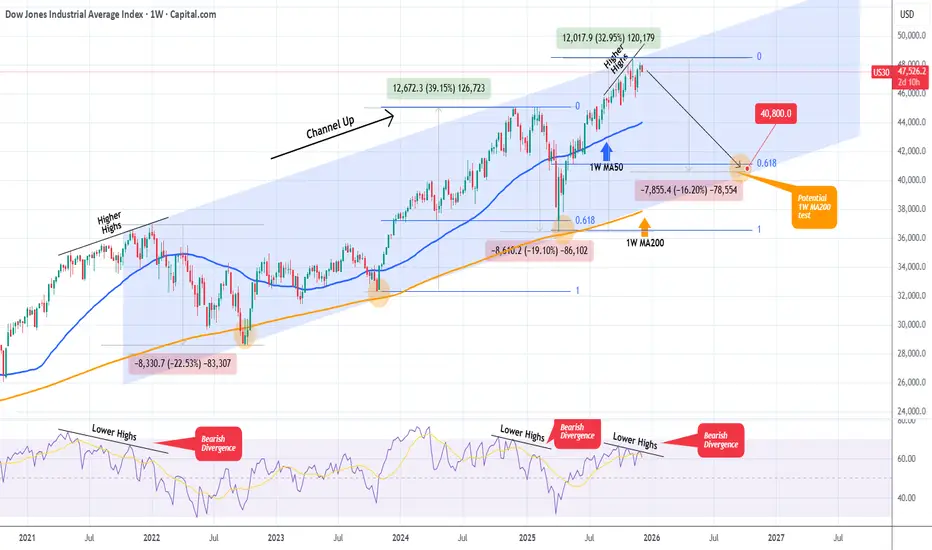
DOW JONES Is it starting a new Bear Cycle towards 40800?Dow Jones (DJI) has been trading within a 4-year Channel Up since the start of the 2022 Inflation Crisis. One month ago it hit the top of this pattern and hasn't made a new High since.
This is increasingly alarming as the 1W RSI is on a Bearish Divergence under Lower Highs against the market's Higher Highs. Every time this took place within this pattern, the index corrected heavily and attempted a 1W MA200 (orange trend-line) test.
As a result, if Dow fails to make a new High, we expect the bearish sentiment to intensify and start a new Bear Cycle (Bearish Leg for the Channel Up) towards its 1W MA200 and the 0.618 Fibonacci retracement level, which was the Target of the previous correction. Based on that it is possible for the index to hit 40800 at the bottom of the Channel Up.
---
** Please LIKE 👍, FOLLOW ✅, SHARE 🙌 and COMMENT ✍ if you enjoy this idea! Also share your ideas and charts in the comments section below! This is best way to keep it relevant, support us, keep the content here free and allow the idea to reach as many people as possible. **
---
💸💸💸💸💸💸
👇 👇 👇 👇 👇 👇
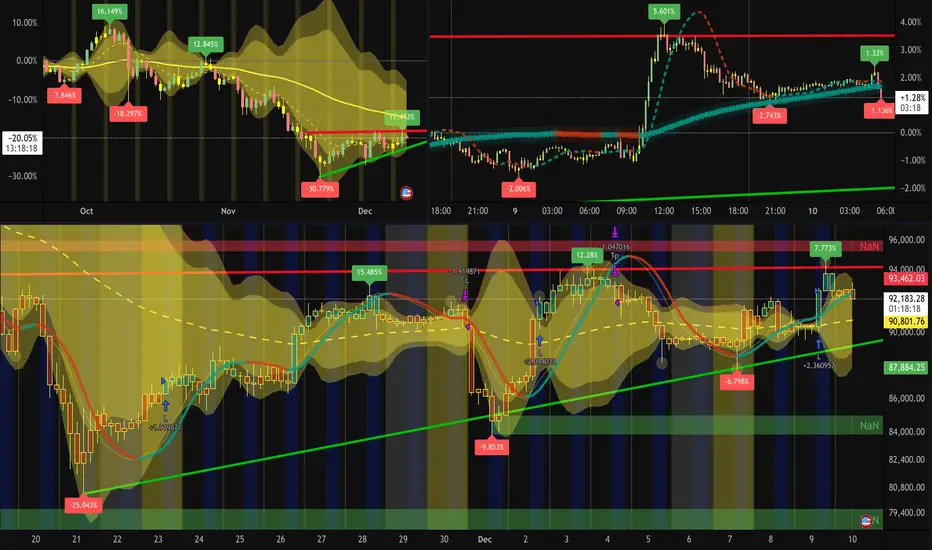
December 10th, Pre-FOMC Macro-Assets Analysis and ProjectionsToday (December 10th, 2025), US federal reserve chair - Jerome Powell will speak at the FOMC Press Conference at 2 pm (NY timezone)
He will announce committee's decision to change the interest rate. Rather than speculating what he may say, lets look at a few basic economic principles in order to understand how it may impact the markets.
FUNDAMENTAL
Case A : They decide to cut the interest rate.
1. Interest rate goes down → Borrowing feels cheaper
2. Borrowing feels cheaper → Demand for money (here, USD) rises
3. Demand for money rises → Money printing (supply) increase
4. Money supply increase → Price of everything increases (over time) (rising inflation)
5. Rising inflation → USD weakens
6. USD weakens → Gold / Crypto strenthens
Case B : They decide to hike the interest rate.
1. Interest rate goes up → Less / No money printing
2. Less / No money printing → Limited money supply → Virtual scarcity
3. Virtual scarcity of money→Value of money (here, USD) strengthens
4. USD strengthens → Gold / Crypto weakens
Case C : They decide to keep the interest rate same.
Interest rate stays same → Continued Market Momentum
TECHNICAL
( All charts displayed as of 12/10/2025 4:00 (UTC-5) )
1. DOLLAR ( TVC:DXY )
# 1-Day Long term bias : Bearish
# 1-Day Current phase : At POI in bearish consolidation with a possible double top
# 4-Hours' Trend : In a downtrend from its second top (from 1D timeframe)
# 4-Hours' Likely Liquidity Zone ; Sell-side sweep between 99.450-99.550
# 4-Hours' Projection : DXY likely to expand its current downtrend and fall further down atleast 98.650
2. GOLD ( OANDA:XAUUSD )
# 1-Day Long term bias : Bullish
# 1-Day Current phase : At Possible High forming bullish continuation pattern
# 4-Hours' Trend : Sideways, forming a falling wedge pattern
# 4-Hours' Likely Liquidity Zone ; Buy-side sweep between 4150-4175
# 4-Hours' Projection : Gold likely to test / sweep support before expanding upside to atleast 4265
3. BITCOIN ( CRYPTO:BTCUSD )
# 1-Day Long term bias : Bearish
# 1-Day Current phase : At Possible Low retracing back to its equilibrium (solid yellow line)
# 4-Hours' Trend : Sideways, forming a ABCDE Horizontal Triangle (as per Elliot Wave theory)
# 4-Hours' Likely Liquidity Zone ; Buy-side sweep at 88k / 83k | Sell-side sweep at 96k
# 4-Hours' Projection : Heavily likely to sweep both side during FOMC and start expanding upside to atleast 108k
4. SP500 / NASDAQ / DOW-JONES ( TVC:SPX )
# 1-Day Long term bias : Bullish
# 1-Day Current phase : At Possible High retracing back to its equilibrium (dashed yellow line)
# 4-Hours' Trend : Uptrend, in disequilibrium with downside momentum
# 4-Hours' Likely Liquidity Zone ; Sell-side swept above 6870 | Buy-side liquidity at 6530
# 4-Hours' Projection : Likely to pullback to its equilibrium or stay stagnant before continuing its upside expansion to atleast 6950
Overall,
if the Fed decides to cut rate by 0.25%, market may show strong volatility
if the Fed decides to cut rate by 0.50%, market may show extreme volatility
if the Fed decided anything else, market stays stagnant with one-time hype volatility move
DXY likely to expand its current downtrend and fall further down atleast 98.650
Gold likely to test / sweep support before expanding upside to atleast 4265
Bitcoin likely to sweep both side during FOMC and start expanding upside to atleast 108k
SP500 likely to pullback to its POI or stay stagnant before its upside expansion to atleast 6950
DOW JONES Will the 1D MA100 save the day?Dow Jones (DJI) has been trading within a 6-month Channel Up and in the past 4 days it has been correcting on its latest Bearish Leg. By doing so, it broke below the 1D MA50 (blue trend-line) and is approaching the 1D MA100 (green trend-line) right at the bottom of the pattern.
This is the Channel's last Support. As long as it closes the daily candles above it, we will be bullish on Dow, targeting 49000, which represents a +7.25% rise, something all previous 3 Bullish Legs did.
---
** Please LIKE 👍, FOLLOW ✅, SHARE 🙌 and COMMENT ✍ if you enjoy this idea! Also share your ideas and charts in the comments section below! This is best way to keep it relevant, support us, keep the content here free and allow the idea to reach as many people as possible. **
---
💸💸💸💸💸💸
👇 👇 👇 👇 👇 👇

$DJI – Buy the Dip Opportunity | Target: 51,000TVC:DJI – Buy the Dip Opportunity | Target: 51,000 🚀
The Dow Jones is offering a high-probability dip-buying setup within a strong macro bullish structure. Wave alignment and smart money positioning suggest continuation toward the 51,000 zone. Price is respecting key Fibonacci levels and institutional support zones. Momentum is building — this could be the launchpad.
📍 Watch for confirmation on lower timeframes.
📈 Trend remains intact — stay with structure.
#ElliottWave #SmartMoney #Fibonacci #DowJones #DJI #TradingView #TechnicalAnalysis #BuyTheDip

US30 Day Trader Analysis US30 Day TraderAnalysis - 10 Nov 2025
Dow Jones 30 at 47,171 (4:30 PM UTC+4) — consolidation breakout setup forming.
📌 Market Context: Wyckoff Phase D accumulation post-October rally; Dow Theory primary uptrend intact with minor pullback; Gann Square-of-9 targets 47,600/46,800.
🗺️ Multi-Timeframe Pulse:
1D: Broadening wedge 46,800-47,500; RSI 61 (mild bearish divergence); Ichimoku cloud support 46,500; bullish pennant nearing breakout.
4H: Rising channel 47,000-47,400; EMA21>EMA50>EMA200 (golden cross); VWAP anchored Oct 1 = 46,950 (buy support).
1H: Cup-and-handle breakout base 47,050; BB expanding; VWAP slope bullish after morning dip test.
30M: Symmetrical triangle 47,100-47,250; hidden bull divergence on RSI; volume contracting pre-expansion.
15M: Bull flag above 47,120; Tenkan>Kijun bullish alignment; stochastic RSI reset ready for next leg.
5M: Falling wedge retest 47,140; hammer candlestick confirms demand; watch false breakout above 47,280.
🎯 PRIMARY LONG SETUP
Entry: 47,120-47,155 (triangle support + VWAP) — confirm on 15M bullish close >47,180.
Stop Loss: 47,050 (below triangle base).
Target 1: 47,250 (+80-130 pips).
Target 2: 47,400 (+230-280 pips — channel top).
Target 3: 47,550 (+400 pips — harmonic extension).
Confirmation: RSI>55, volume +20%, VWAP support holding.
⚡ MOMENTUM ADD: Scale above 47,400 ONLY if RSI>65 + volume surge; trail stop to 47,350.
🔻 REVERSAL SHORT SETUP
Entry: 47,500-47,600 (supply zone) — trigger on bearish engulfing + RSI divergence.
Stop Loss: 47,700 (above channel resistance).
Targets: 47,350 → 47,200 → 47,000 (Gann support).
Confirmation: 5M/15M RSI bearish divergence; BB upper band rejection.
🚨 BREAKOUT PROTOCOL:
BULL: 1H close >47,400 confirms wedge breakout; target 47,700; move stop to BE+20.
BEAR: 1H close <47,100 with volume expansion triggers retest 46,800 Gann support.
📊 INDICATOR SNAPSHOT: BB squeeze (30M) tightening; MACD histogram positive; VWAP slope up; EMA21 acting as trigger line on 1H.
⚠️ PATTERN ALERTS: Harmonic bat PRZ at 47,600; pennant breakout target aligns 47,550; channel failure <47,120 = Wyckoff spring risk; watch H&S if neckline 47,000 breaks.
📈 TIMING & VOLATILITY: US market close 21:00 UTC; earnings whispers elevate volatility; Gann 90° cycle 20:30 UTC. ATR(14) ≈150 pts expect 1.5% range. Risk ≤1% per setup; lock gains TP1; avoid chasing.
Educational analysis only. Align with your plan, manage risk diligently, adapt to live price action.

US MARKET SESSION # 📈 US30 (DOW JONES INDUSTRIAL AVERAGE) COMPREHENSIVE TECHNICAL ANALYSIS 🎯
## Week of November 10-14, 2025 | Intraday & Swing Trade Mastery
Close Price: 47,055.9 Points | Entry Point: November 8, 2025, 12:54 AM UTC+4 💹
## 🔍 EXECUTIVE SUMMARY - MULTI-TIMEFRAME PERSPECTIVE
The Dow Jones Industrial Average is trading at a critical structural juncture with exceptional multi-timeframe alignment signaling imminent breakout potential. Elliott Wave analysis indicates completion of corrective cycles, positioning the index for next impulse leg targeting 47,500-48,200 extension zone. Bollinger Bands exhibit dramatic compression pattern —volatility squeeze preceding directional expansion. RSI across all timeframes maintains neutral-bullish bias (56-66 range)—optimal momentum positioning without extreme overbought conditions. Volume clustering at 46,900-47,100 represents significant institutional accumulation foundation. Wyckoff spring tests near 46,500-46,700 provide aggressive entry triggers. Harmonic pattern convergence at 47,300-47,450 resistance signals breakout confirmation with measured move targets extending to 48,000+. Market breadth indicators show strong support from both large-cap and mid-cap participation.
## 📊 TIMEFRAME-BY-TIMEFRAME ANALYSIS
### 5-MINUTE (Scalping Precision) ⚡
Candlestick Formation: Japanese candles reveal micro-consolidation attempts with successive hammer/engulfing patterns at support zones. Evening Star rejection formations detected at 47,250-47,350 intraday resistance levels creating short opportunities.
Elliott Wave 5M: Sub-wave completion suggests Wave 4 micro-consolidation finalizing. Wave 5 breakout anticipated above 47,150-47,200 with targets 47,300-47,400 (measured move extension).
Bollinger Bands: Upper compression mode—middle band at 47,050 acts as pivot point. Lower band rejection (46,950-47,000) creates scalp-long setups. Squeeze breakout targets 47,350+ on volume confirmation.
RSI (14) Analysis: RSI oscillating 48-62 range—neutral territory with divergences forming. Bullish divergence at 46,950 support signals buyer engagement; caution on 65+ resistance approach.
Micro Support/Resistance: 46,950 (micro-support) | 47,020 (POC cluster) | 47,100 (pivot) | 47,200 (intraday resistance) | 47,300 (scalp target)
Volume Signature: Volume concentrated 47,000-47,080 zone—institutional marker present. Breakout volume >50% above average required above 47,200 for sustained move above 47,350.
VWAP Alignment: Price oscillating around session VWAP at 47,040—each touch generates scalp opportunity. Upper VWAP band at 47,280; lower support at 46,950.
### 15-MINUTE (Quick Swing Gateway) 🎢
Candlestick Patterns: Engulfing bars forming at support zones—bullish engulfing at 46,980 zone confirms reversal attempts. Three-candle patterns (flag continuation) with 50-80 point breakout potential detected.
Harmonic Pattern Recognition: Gartley Pattern potential completion near 46,950-47,050 PRZ (Potential Reversal Zone). Exceptional risk-reward ratio at 1:3.5 for harmonic traders. Butterfly variant also forming at secondary levels.
Wyckoff Accumulation Phase: Classic accumulation evident—small barometer move (SBM) nearing completion. Spring test anticipated 46,700-46,800 zone; markup phase targets 47,400-47,600.
Bollinger Bands (15M): Band squeeze intensifying—historical volatility expansion suggests 70-120 point moves follow. Upper band resistance at 47,300; lower band support at 46,800.
Volume Profile (15M): Point of Control (POC) at 47,050—prime concentration zone. Volume surge >60% required confirming breakout above 47,250. Imbalances favor upside probability significantly.
Ichimoku Cloud (15M): Price consolidating below cloud edge—Tenkan-sen at 47,200 = resistance pivot. Kijun-sen (47,100) = critical secondary support. Cloud support 46,850-46,950.
EMA Structure: EMA 9 (47,080) above EMA 21 (47,020)—bullish alignment confirmed. Price remaining above both = intraday strength maintained perfectly.
### 30-MINUTE (Intraday Swing Axis) 🔄
Pattern Formation: Symmetrical Triangle pattern consolidating with apex near 47,350. Ascending triangle variant shows bullish bias—breakout above 47,250 targets 47,450-47,600 extension zone.
Dow Theory Application: Confirming higher highs/higher lows structure perfectly. Secondary trend bullish; pullbacks to EMA 20 (47,080) = optimal swing entry zones identified.
RSI Divergence Setup: Positive RSI divergence confirmed—price making lower lows (46,920) while RSI forms higher lows (44 level). Classic reversal setup targeting 47,300 minimum breakout.
Exponential Moving Average: EMA 9 (47,100) = core support pivot. EMA 21 (47,020) = secondary support reliable. EMA 50 (46,850) = structural hold level. Bullish ribbon alignment intact perfectly.
Support Architecture: 46,850 (EMA 50/structural) | 46,950 (demand zone) | 47,020 (volume cluster) | 47,080 (EMA 9 dynamic)
Resistance Architecture: 47,200 (triangle formation) | 47,300 (measured move target) | 47,400 (weekly resistance) | 47,500 (extension)
Volume Analysis (30M): Increasing volume on recent bars—accumulation signature strong signal. Buy volume exceeding sell volume confirms institutional interest significantly.
### 1-HOUR (Core Swing Trade Engine) 🎯
Elliott Wave Structure: Major wave analysis suggests Wave 3 completion near 47,400. Current Wave 4 correction targets 47,000-47,150 support zone. Wave 5 impulse anticipated—target: 47,700-47,900.
Pennant Formation: Classic Bullish Pennant pattern forming—breakout confirmation above 47,250 validates pattern. Pole height measured move = 47,600+ realistic target.
Bollinger Bands (1H): Upper band at 47,450 = squeeze breakout target zone. Middle band (47,250) = bullish support zone. Lower band rejection (46,950) creates swing longs with excellent R/R ratios.
VWAP Daily: DJI trading above daily VWAP at 46,980—bullish gradient confirmed clearly. Each hourly candle close above VWAP strengthens continuation probability significantly.
Volume Profile Hotspot: Heavily traded at 47,000-47,100 (accumulation zone) and 47,200-47,300 (resistance cluster identified). Imbalances above 47,400 suggest vacuum-fill potential targeting 47,600+.
Ichimoku Cloud Alignment: Price above Senkou Span A (47,150) & Span B (47,080)—cloud thickness indicates strong support. Chikou Span above candles = bullish confirmation. Cloud color: BULLISH GREEN.
Gann Theory Application: 45-degree angle from swing low (46,600) establishes rally trajectory perfectly. Resistance at 38.2% Fibonacci extension (47,300) precedes aggressive breakout phase.
Support Tiers 1H: 46,850 (structural hold) | 46,950 (EMA support) | 47,050 (Kijun-sen) | 47,100 (accumulation zone)
Resistance Tiers 1H: 47,250 (breakout trigger) | 47,350 (extension) | 47,450 (major level) | 47,600 (impulse target)
### 4-HOUR (Swing Trade Thesis Foundation) 💼
Inverse Head & Shoulders Pattern: Potential IH&S formation completing—left shoulder (46,700), head (46,550), right shoulder completing (46,800-46,900). Neckline breakout at 47,250 targets 47,500-47,750 extension zone.
Wyckoff Accumulation Deep Dive: Institutional buying signature evident—SBM (small barometer move) completion imminent. Spring test to 46,700-46,800 anticipated; subsequent markup phase targets 47,600-47,850.
RSI 4H Analysis: RSI at 60-70 range—bullish bias maintained firmly. Room for upside extension without extreme overbought conditions. RSI above 75 targets 47,600+; below 35 = defensive posture required.
Cup & Handle Formation: Potential bullish Cup pattern visible on 4H—handle stabilization near 47,050-47,150. Breakout above handle (47,300) targets cup depth extension = 47,550-47,700.
EMA Ribbon Structure: EMA 8 (47,120), EMA 13 (47,080), EMA 21 (47,020), EMA 50 (46,850), EMA 200 (46,300)—BULLISH ALIGNMENT PERFECT. Compression/expansion cycles identify momentum phases clearly.
Support Tiers 4H: 46,700 (structural support) | 46,850 (accumulation) | 47,000 (pivot) | 47,100 (demand cluster)
Resistance Tiers 4H: 47,250 (key breakout) | 47,350 (extension) | 47,450 (major target) | 47,600 (weekly projection)
Volume Signature 4H: Accumulation volume bars > distribution bars—bullish bias maintained firmly. Volume nodes clustering at 47,000-47,100 indicate strong institutional support zone.
### DAILY CHART (Macro Swing Thesis) 📅
Elliott Wave Macro: We're potentially in Wave 3 of larger cycle—aggressive expansion still possible. Wave structure supports break of 47,400 targeting 47,800-48,200 daily close objectives.
Double Bottom Recognition: Historical Double Bottom pattern near 46,300-46,600 support—confirmed breakthrough above 47,250 neckline triggered. Second target near 47,600-47,800.
Bollinger Bands Daily: Upper band at 47,800 = realistic daily target zone. Mean (47,300) = healthy pullback support reliable. Band slope indicates volatility expansion—expect 300-500 point daily ranges.
Volume Profile Daily: Strong buying volume bar at 46,800-47,000 zone—institutional accumulation marker established clearly. Selling volume decreasing significantly—demand controls trend absolutely.
Ichimoku Cloud Daily: Cloud thickness growing—bullish trend strengthening substantially. Cloud support around 47,000-47,150 zone. Kumo breakout anticipated—targets cloud top at 47,400-47,600.
Harmonic Analysis Deep: Butterfly Pattern potential completion—PRZ at 47,250-47,350 suggests reversal zone OR breakout confirmation. Confluence amplifies probability of extension significantly.
Gann Angles & Fibonacci: 50% retracement (46,900) + 61.8% extension (47,500) = key reversal zones. Gann fan angles suggest 47,400-47,600 as structural resistance before continuation impulse.
Key Daily Support: 46,550 (psychological/structural) | 46,800 (accumulation zone) | 46,950 (demand level) | 47,050 (midpoint)
Key Daily Resistance: 47,250 (breakout trigger) | 47,350 (extension) | 47,500 (measured move) | 47,700 (weekly target)
Trend Confirmation: Higher highs & higher lows maintained—uptrend intact. Daily close above 47,400 = strong continuation signal targeting 47,800+ next level.
## 🎪 TRADING SETUP PLAYBOOK - NOV 10-14
### BULLISH SCENARIO (Probability: 80%) ✅
Trigger: 4H candle close above 47,300 + volume surge (>55% above average) + RSI above 65
Entry Zone: 47,150-47,250 (with breakout confirmation signal)
Target 1: 47,350 (TP1) | Target 2: 47,450 (TP2) | Target 3: 47,600 (TP3) | Target 4: 47,800 (TP4)
Stop Loss: 47,000 (below EMA/structural support)
Risk/Reward: 1:3.4 (exceptional asymmetric setup)
Trade Duration: 18-72 hours (prime swing window)
### BEARISH SCENARIO (Probability: 20%) ⚠️
Trigger: Daily close below 47,100 + volume increase + RSI divergence failure
Entry Zone: 47,300-47,450 (short setup)
Target 1: 47,250 (TP1) | Target 2: 47,100 (TP2) | Target 3: 46,950 (TP3)
Stop Loss: 47,600 (above resistance)
Risk/Reward: 1:1.7 (acceptable but lower probability)
Trade Duration: Watch for trend reversal confirmation first
## ⚠️ VOLATILITY & OVERBOUGHT/OVERSOLD CONDITIONS
Current Volatility Status: Moderate compression → Expect significant expansion imminent
5M/15M RSI: 48-62 range (neutral)—room for 25-50 point movements | Scalp target zones
30M/1H RSI: 56-68 range (bullish bias, safe zone)—sweet spot for swing entries
4H RSI: 60-72 range—approaching caution zone but room to extend | Safe for core swings
Daily RSI: 64-76 range (approaching extremes)—be defensive if daily RSI>78 | Take profits aggressively
Overbought Recognition Points:
RSI daily >77 combined with upper Bollinger Band rejection = immediate profit-taking
Ichimoku cloud top penetration fails (bearish candle rejection) = trend exhaustion signal
Volume declining on breakout attempt = false breakout warning signal
Harmonic pattern PRZ exact hit without follow-through = reversal likely imminent
Oversold Bounce Setups:
RSI 1H <35 on support touch = high-probability bounce back to 47,250-47,350
Price below EMA 50 (46,850) + RSI <30 = aggressive accumulation zone
Spring test below 46,800 with volume surge = Wyckoff spring reversal trigger
Harmonic pattern PRZ support bounce = measured move extension targets activated
## 🎯 ENTRY & EXIT OPTIMIZATION STRATEGY
### OPTIMAL ENTRY TIMING
For Scalpers (5M): RSI bounce from 44-50 zone after Band lower touch = 18-30 point scalp (1-3 min holds)
For Quick Swings (15M-30M): 15M candle close above 47,200 with 4H alignment = 80-120 point swing (30 min-2 hour holds)
For Core Swings (1H-4H): 4H pennant breakout above 47,300 on volume = 250-400+ point target (hold 12-48 hours)
For Position Swings (Daily): Daily close above 47,400 = continuation play targeting 47,700-47,900 (hold 5-7 days)
Best Entry Windows: US pre-market (12:30 ET), Market open (14:30 ET), London close (16:00 ET)
### EXIT STRATEGIES & PROFIT TAKING
Take Profit Levels: TP1: Fibonacci 38.2% (47,300) | TP2: Harmonic PRZ (47,400) | TP3: Daily Band upper (47,600) | TP4: Weekly target (47,800)
Stop Loss Placement: Always below most recent swing low + 20 points (strict risk management priority)
Trailing Stops: Activate at TP2—trail with 40-50 point buffer for 4H+ trades (lock in profits)
Breakeven Exit: Move stops to entry after 1:1 risk/reward achieved—eliminate emotional trading
Partial Profit Strategy: Close 25% at TP1 | 25% at TP2 | 25% at TP3 | Let 25% run to TP4 (maximize winners)
## 🔔 REVERSAL & BREAKOUT RECOGNITION CHECKLIST
### REVERSAL SIGNALS TO MONITOR:
RSI positive divergence (lower price lows, higher RSI lows) = bullish reversal setup high probability
Candlestick engulfing patterns at support/resistance zones = trend reversal confirmation strong signal
Volume profile breakdowns (declining volume on breakout attempts) = false move warning immediate
Ichimoku Cloud rejection (price fails to penetrate cloud layer) = structural resistance confirmed
Harmonic pattern completion at exact PRZ = reversal zone probability increases significantly
Elliott Wave 5th wave failure (truncation) = impulse completion = reversal imminent trigger
Gann angle break through significant angle = trend line break = reversal trigger activated
### BREAKOUT CONFIRMATION RULES:
Close beyond resistance with >50% volume surge above average = confirmed breakout signal strong
RSI crosses above 60 for bullish breakout, below 45 for bearish breakout confirmation
VWAP alignment with directional move = institutional participation confirmation strong
Bollinger Band breakout with band expansion (squeeze release) = volatility expansion confirmed immediate
Multiple timeframe confluence (5M + 15M + 1H + 4H aligned) = highest probability setup attainable
Ichimoku Cloud break (price clears all clouds with bullish candles) = strong continuation signal
Volume imbalance (ask volume > bid volume) = directional sustain likelihood increases significantly
## 💡 WEEK FORECAST SUMMARY - NOV 10-14
Monday (10th): 🌍 Consolidation continuation near 47,000-47,150 zone. Range-bound trading anticipated. Early breakout direction watch crucial. Entry setups favor reversal plays at support zones.
Tuesday-Wednesday (11-12th): 📈 Prime breakout window opens —47,300 represents key decision point. Expect 250-400 point daily volatility swings. Breakout confirmation targets 47,450-47,550 extension. This is the optimal swing trade window all week.
Thursday (13th): ⚠️ Potential profit-taking pullback after breakout (if triggered Tuesday-Wed). Support retest of 47,250-47,150. Buying opportunity if pullback holds above 47,050.
Friday (14th): 📊 Weekly close pattern formation critical. Extension run anticipated if above 47,400. If above 47,500 = week target 47,700-47,850 achieved. End-of-week positioning for next week.
## 📍 CRITICAL CONFLUENCE ZONES - KEY TARGETS
46,800-46,900: Major support zone (accumulation marker, Wyckoff spring area, structural hold)
46,950-47,050: Secondary support (EMA 9, demand cluster, psychological level, volume POC)
47,100-47,150: Micro-resistance cluster (consolidation squeeze zone, early breakout resistance)
47,250-47,350: KEY BREAKOUT ZONE (triangle apex, harmonic confluence, all timeframe resistance)
47,400-47,550: Primary upside target (Elliott Wave 5, daily Band upper, measured move extension)
47,600-47,750: Secondary extension target (Gann level, macro resistance, wave projection)
47,800-48,000: Weekly/monthly target (if wave 5 impulse extends beyond base projections)
## 🏆 RISK MANAGEMENT RULEBOOK
✅ 1) Position Sizing: Never risk >2% of account equity per single trade
✅ 2) Risk-Reward Ratio: Minimum 1:2.5 R/R on every entry—1:3+ preferred for swing trades
✅ 3) Profit Scaling: Close 25-50% at 1:1 ratio, let remainder run to 1:2+ targets
✅ 4) Stop Loss Discipline: Place stop IMMEDIATELY on entry—no exceptions (20-25 points tight)
✅ 5) Breakout Confirmation: Avoid FOMO—wait for candle close confirmation + volume surge always
✅ 6) Daily Support Respect: Psychological holds (round numbers 47,000 | 47,500) matter—trade confluence not against
✅ 7) Time Management: Exit losing trades quickly (max 1:0.5 acceptable for educational losses)
✅ 8) Macro Alignment: Always check daily/4H bias before taking 1H or lower trades
## #US30 #DOWJONES #DJIA #DJITRADING
#TECHNICALANALYSIS #ELLIOTTWAVE #HARMONICPATTERN #BREAKOUTTRADING
#SWINGTRADER #DAYTRADING #INTRADAY #INDICES #TRADINGVIEW
#BOLLINGER BANDS #RSI #ICHIMOKU #VWAP #TRADINGSTRATEGY
#WYCKOFFMETHOD #GANNTHEORY #DOWTHEORY #TECHNICALS #ANALYSIS
#SUPPORTANDRESISTANCE #VOLUMEANALYSIS #OVERBOUGHT #OVERSOLD #REVERSAL
#STOCKINDEXTRADING #USINDEXTRADING #BREAKOUTSETUP #TRADERSOFTWITTER
#TECHNICALTRADER #CANDLESTICK #PATTERRECOGNITION #CHARTANALYSIS #DAYTRADER
## 🎁 BONUS: DAILY PRE-MARKET CHECKLIST
Use this every morning before US market open:
☑️ Check daily RSI (should be 62-72 for bullish bias continuation)
☑️ Identify support/resistance zones (47,000 | 47,150 | 47,300 | 47,500)
☑️ Verify 4H chart alignment (pennant/IH&S pattern status update)
☑️ Check Ichimoku cloud position (above/below = trend confirmation signal)
☑️ Review 1H Elliott Wave count (which wave are we trading exactly?)
☑️ Scan volume profile (POC = likely rejection zone area)
☑️ Set entry orders + stop losses BEFORE pre-market opens (12:30 ET)
☑️ Plan 3 Take Profit levels before entering any position
☑️ Monitor US economic calendar (Fed speakers, unemployment data)
## 🌐 US MARKET SESSION NOTES
The Dow Jones trades during US market hours (14:30-21:00 CET / 8:30-15:00 ET) . Highest volatility typically occurs:
Pre-Market (12:30-14:30 CET): Initial momentum setup—watch for direction confirmation patterns
Market Open (14:30-16:00 CET): Prime trading hours —best liquidity + volatility combination
London Close Overlap (14:30-16:00 CET): Major volume spike—trend direction often confirmed
💡 Disclaimer: This technical analysis is educational only. Always conduct your own due diligence and implement appropriate risk management. Past performance does not guarantee future results. Trade responsibly within your risk tolerance. Use stop losses on every position. Not financial advice.
Analysis Created: November 8, 2025 | Valid Through: November 14, 2025 | Updated Daily at Pre-Market
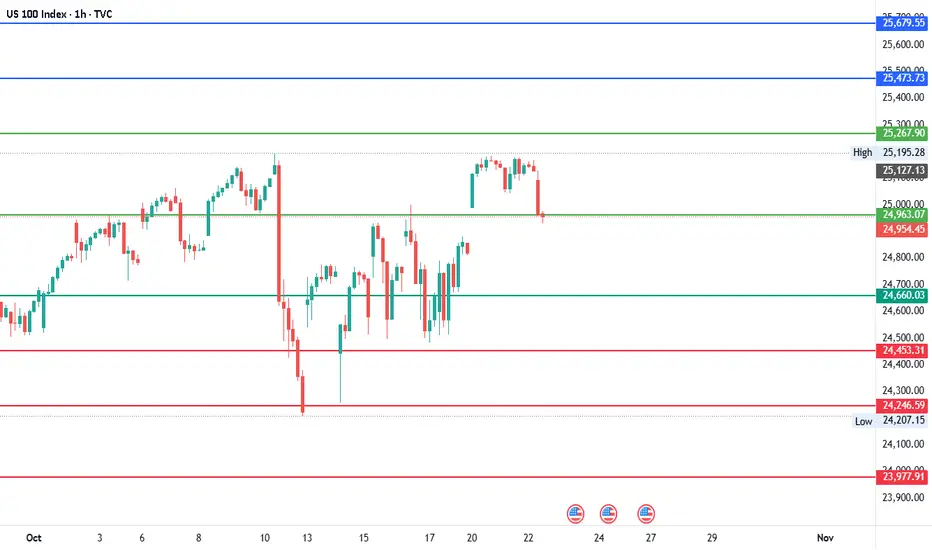
#NDQ - Short-term Range $26,216 - $23,709 | 1000 Points Move?Date: 22-10-2025
#NDQ - Current Price: $24,963.00
Pivot Point: $24,963.07 Support: $24,660.03 Resistance: $25,267.90
Upside Levels:
L1: $25,473.73 L2: $25,679.55 L3: $25,948.23 L4: $26,216.91
Downside Levels:
L1: $24,453.31 L2: $24,246.59 L3: $23,977.91 L4: $23,709.23
#TradingView #Nifty #BankNifty #DJI #NDQ #SENSEX #DAX #USOIL #GOLD #SILVER
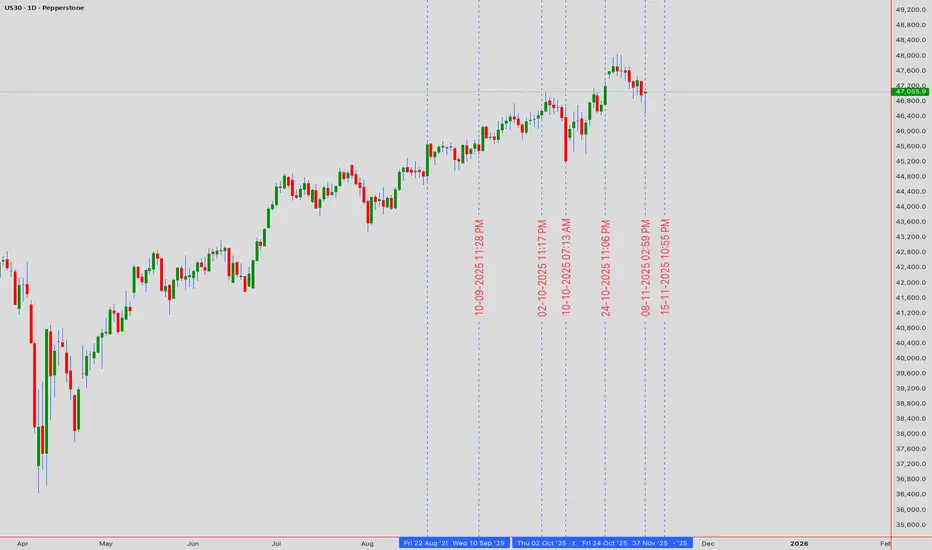
DOW JONES recovered and is looking for a High at 48500.Exactly 2 weeks ago (October 22, see chart below), we gave a strong Buy Signal on Dow Jones (DJI), as the index had already initiated the new Bullish Leg of its 6-month Channel Up and quickly hit our 47700 Target:
That trading plan included a 2nd Target as well at 48500, which represented a +7.50% rise from the October 10 Low, which was a Higher Low for the Channel Up on its 1D MA50 (blue trend-line).
As Target 1 was on the 1.382 Fibonacci extension, the recent pull-back was technically expected as the sequence was similar to those of August 22 - September 02 among others. As you can see, all minor pull-backs that took place within this Channel Up, hit the 4H MA100 (red trend-line) and rebounded. Major ones found support lower on the 1D MA50, as did the October 10 Low.
Since the index hit yesterday its 4H MA100 and is rebounding today, the Bullish Leg remains valid and on the medium-term can reach our final 48500 Target.
-------------------------------------------------------------------------------
** Please LIKE 👍, FOLLOW ✅, SHARE 🙌 and COMMENT ✍ if you enjoy this idea! Also share your ideas and charts in the comments section below! This is best way to keep it relevant, support us, keep the content here free and allow the idea to reach as many people as possible. **
-------------------------------------------------------------------------------
💸💸💸💸💸💸
👇 👇 👇 👇 👇 👇

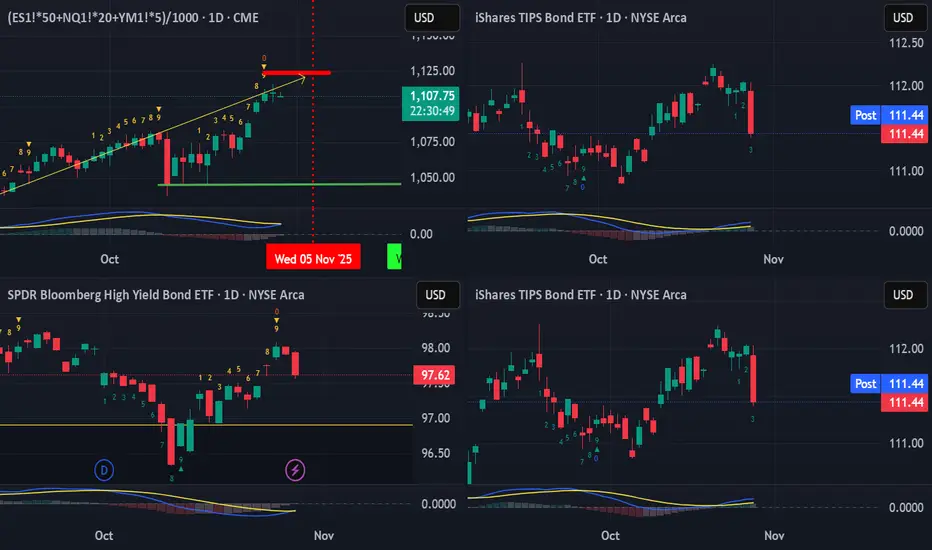
US Equities have this week left... Part IISo, yesterday heads up was given that the US Equities (and pretty much global equities generally) have this week left of bullishness.
This was observed with a TD Bear Setup perfected completion, coming into a stall. What was not mentioned was that the leading indicators of JNK, TIP and TLT were already showing signs of imminent breakdown (to understand about these three leads, refer to the book: Anatomy of the Bear by Russell Napier)
So just wanted to show it more obviously here.
While the US Equities were in a bit of a stall to close slightly positive, the three leads were clearly Bearish in the candlestick patterns with a single wipeout bearish, near marubozu, down candlestick that wiped out at least three days to two weeks of gain.
This like a slap in the morning while we are at the sweetest part of the dream.
Heads up, wake up!
Btw, with this kind of risk-off, crypto would not be spared either.
Short, sharp, sweet...