Dow Jones Swing Trade Setup – Is 48,000 the Next Stop?📈 US30 "Dow Jones Industrial Average" CFD: Thief's Wealth Strategy Map (Swing/Day Trade) 🚨
🎯 Swing/Day Trade Setup: US30 (Dow Jones Industrial Average CFD)
Get ready to sneak into the market with the Thief Strategy — a cheeky, layered limit-order approach to steal profits from the Wall Street shadows! 😎 This bullish plan is designed for swing or day trading, with a professional yet playful vibe to maximize your market heist. Let’s break it down! 🕵️♂️
🧠 Trade Idea: Bullish Heist on US30 🚀
Asset: US30 (Dow Jones Industrial Average Index CFD)
Market: Wealth Strategy Map (Swing/Day Trade)
Outlook: Bullish 📈
Strategy: The Thief Strategy — using multiple buy limit orders in a layered entry style to catch the best price levels. Think of it as setting traps for profits! 🕸️
📝 The Thief’s Plan: Layered Entry & Key Levels
🔑 Entry Strategy:
Deploy multiple buy limit orders to layer your entries like a master thief:
🎯 46,500
🎯 46,600
🎯 46,700
🎯 46,800
Pro Tip: Feel free to add more layers based on your risk appetite or market conditions. The more traps, the merrier! 😜
Flexible Entry: You can enter at any price level within this range, but layering helps you average into the position like a sneaky pro.
🔐 Stop Loss (SL):
Set at 46,300 — the Thief’s escape hatch! 🚪
Note: Dear Ladies & Gentlemen (Thief OGs 🕶️), this SL is my suggestion, but it’s your heist! Adjust based on your risk tolerance and account size. Only risk what you can afford to lose!
🎯 Take Profit (TP):
Primary target: 47,600 — a juicy profit zone before the Police Barricade (resistance) at 48,000.
Why 47,600? This level avoids the overbought trap and potential reversal at 48,000, where strong resistance and market shenanigans may lurk. 🕵️♂️
Note: Thief OGs, this TP is my call, but you’re the boss! Take profits at your own discretion and secure the bag. 💰
🔍 Why This Setup? Key Analysis Points
Market Context: The US30 is showing bullish momentum, supported by recent economic data and market sentiment (check social posts and financial news for real-time vibes).
Technical View:
The layered entry approach leverages potential pullbacks within a bullish trend, maximizing your entry efficiency.
The 46,300 SL is placed below key support to protect against sudden reversals.
The 48,000 level acts as a major resistance (overbought zone + psychological barrier), making 47,600 a safer TP.
Risk Management: The Thief Strategy spreads risk across multiple entry points, reducing the impact of volatility spikes.
💹 Related Pairs to Watch (Correlated Assets in USD)
To boost your market awareness, keep an eye on these correlated assets:
SP:SPX (S&P 500 Index CFD): Moves closely with US30 due to shared exposure to U.S. large-cap stocks. A bullish US30 often aligns with SPX strength. 📈
PEPPERSTONE:NAS100 (Nasdaq 100 Index CFD): Tech-heavy index that can amplify or diverge from US30 moves. Watch for tech sector momentum. 💻
FX:USDJPY (Forex Pair): A stronger USD often supports bullish US equity indices like US30. Monitor for USD strength or Yen weakness. 💵
Key Correlation Insight: If SP:SPX and PEPPERSTONE:NAS100 show similar bullish patterns, it reinforces the US30 setup. Conversely, a sharp USDJPY drop could signal caution for US indices.
⚠️ Disclaimer
This Thief Style trading strategy is just for fun and educational purposes! 😜 Trading involves risks, and past performance doesn’t guarantee future results. Always conduct your own analysis, manage risk wisely, and only trade what you can afford to lose.
✨ If you find value in my analysis, a 👍 and 🚀 boost is much appreciated — it helps me share more setups with the community!
#US30 #DowJones #ThiefStrategy #SwingTrading #DayTrading #Bullish #TechnicalAnalysis #TradingView #WealthStrategy
Dji30

Can Dow Jones Maintain Bullish Momentum? Analysis🎯 US30 Dow Jones: The Great Heist Setup! 🏦💰
📊 Asset Overview
US30 (Dow Jones Industrial Average) - CFD Index
Trade Type: Swing/Day Trade
Bias: BULLISH 🐂
🔍 The Master Plan: Double Moving Average Confirmation
We're hunting for a pullback retest at two critical moving averages acting as dynamic support:
✅ Simple Moving Average (SMA) alignment
✅ Kijun-Sen (Ichimoku baseline) confluence
This double confirmation gives us the green light to ride the bullish trend with institutional-level precision. Think of it as the market leaving the vault door slightly open... 🚪💎
🎯 Entry Strategy: The "Thief Layering" Method
Primary Approach: Multiple Buy Limit Orders (Layering Strategy)
Recommended Layer Entry Zones:
🟢 Layer 1: 46,000
🟢 Layer 2: 46,200
🟢 Layer 3: 46,400
💡 Pro Tip: You can add more layers based on your risk appetite and position sizing. This strategy allows you to average into the position as price pulls back to support—like catching falling diamonds! 💎
Alternative: Market execution at any pullback to the moving average confluence zone.
🛡️ Risk Management
Stop Loss: 45,600
⚠️ Important: This is MY stop loss level based on technical invalidation. You're the captain of your own ship—adjust according to YOUR risk tolerance and account size. Trade at your own risk!
🎯 Target Zone: The Police Barricade
Take Profit Target: 47,600 🚨
This level represents:
🚧 Strong resistance zone (the "Police Barricade")
📈 Potential overbought conditions
Bull trap territory
Strategy: Scale out or secure profits as we approach this level. Remember: realized profits are better than paper gains!
⚠️ Reminder: This is MY take profit target. Your exit strategy should align with your trading plan and risk management rules. Lock in profits when YOU'RE comfortable!
🌐 Correlated Assets to Watch
Keep an eye on these related instruments for confluence:
SP:SPX (S&P 500): Broad market sentiment indicator—if SPX shows strength, US30 typically follows
SEED_ALEXDRAYM_SHORTINTEREST2:NQ (Nasdaq 100): Tech-heavy index correlation—risk-on appetite confirmation
TVC:DXY (US Dollar Index): Inverse correlation—weaker dollar often supports equity indices
TVC:TNX (10-Year Treasury Yield): Rate sensitivity—lower yields can fuel equity rallies
TVC:VIX (Volatility Index): Fear gauge—declining VIX supports bullish setups
Key Correlation Note: When these indices move in harmony with declining dollar strength, it strengthens the bullish case for US30. Watch for synchronized moves!
📝 Technical Summary
Trend: Bullish structure intact
Confirmation: Dual moving average support
Risk/Reward: Favorable with 400-1,600 point profit potential (depending on entry layer)
Time Frame: Swing to day trade duration
Strategy Style: "Thief layering" - accumulate on pullbacks
✨ If you find value in my analysis, a 👍 and 🚀 boost is much appreciated — it helps me share more setups with the community!
⚠️ Disclaimer
This "Thief Style" trading strategy is shared for educational and entertainment purposes only. This is NOT financial advice. Trading involves substantial risk of loss. Always conduct your own analysis, manage your risk appropriately, and never trade with money you cannot afford to lose. Past performance does not guarantee future results. You are solely responsible for your trading decisions.
#US30 #DowJones #SwingTrading #DayTrading #TechnicalAnalysis #MovingAverages #LayeringStrategy #IndexTrading #BullishSetup #TradingStrategy #CFDTrading #PriceAction #SupportAndResistance #TradingIdeas #MarketAnalysis #ThiefStyle

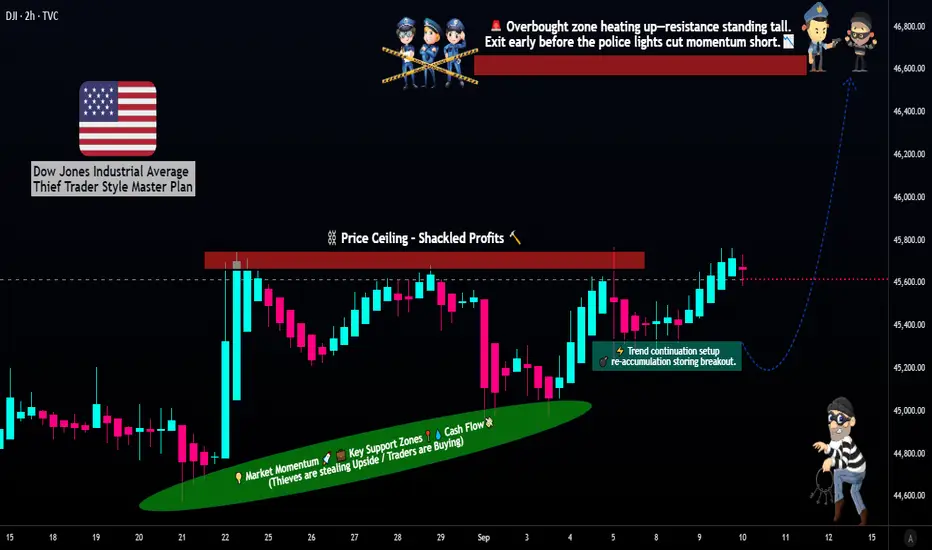
Can the DJIA Maintain Its Momentum? A Strategic Long Setup📈 DJIA Money-Making Plan: Thief Strategy (Swing/Day Trade) 🕵️♂️
🚀 Swing/Day Trade Setup for Dow Jones Industrial Average (DJIA) CFD
Join the "Thief OG" crew with this bullish plan to navigate the market with precision! Using a layered limit order strategy, this setup targets smart entries and calculated exits while keeping risk management first. Let’s dive into the plan! 💥
📊 Trade Plan Overview
Asset: Dow Jones Industrial Average (DJIA) CFD 💰
Direction: Bullish 🐂
Current Price (Sep 10, 2025): 45,711 🟢 (+0.43% from previous close)
Strategy: Thief Layered Limit Order Strategy 🕵️♂️
Place multiple buy limit orders at key levels to "steal" entries during pullbacks.
Suggested Entry Levels: $45,400, $45,500, $45,600, $45,700 (or customize based on your analysis).
Note: You can add more layers or adjust levels to suit your risk appetite. Flexibility is key! 🔧
Stop Loss (SL): $45,100 (Thief OG’s starting point).
Important: Adjust your SL based on your strategy and risk tolerance. This is a suggestion, not a rule! ⚠️
Target Price (TP): $46,600 (Escape before the "police barricade"!).
Note: Set your own TP based on your goals. Take profits at your discretion—don’t follow blindly! 💸
Risk Disclaimer: Dear Traders (Thief OG’s), this plan is a guide, not a guarantee. Always trade at your own risk and adjust SL/TP to your strategy. Protect your capital! 🛡️
🧠 Why This Plan? Thief Strategy + Market Insights
The "Thief" strategy uses layered limit orders to capitalize on pullbacks in a bullish trend, backed by solid market data. Here’s why this setup shines:
Thief Technical Strategy 🕵️♂️:
Layered Entries: Multiple buy limit orders ($45,400–$45,700) allow you to scale into the trade during dips, maximizing entry precision.
Risk Management: Suggested SL at $45,100 protects against unexpected reversals. Customize to your comfort level.
Profit Potential: Target $46,600 aligns with resistance levels and recent momentum. Exit strategically to lock in gains.
Fundamental & Macro Score: 7/10 (Solid Foundation) 🟢
Earnings Growth: Expected 7-10% for 2025, driven by strong corporate balance sheets.
Sector Strength: 10/11 S&P sectors up YTD, with tech and industrials leading.
Macro Environment:
Cooling inflation (CPI ~3.1% YoY).
Fed rate cuts expected, supporting growth.
Mild headwinds from tariffs and global trade risks.
Resilient labor market (unemployment 4.3%) and consumer spending fuel upside.
Trader Sentiment Outlook 😊:
Retail: 51% Bullish 🟢 | 34% Bearish 🔴 | 15% Neutral ⚪
Optimism driven by dip-buying in tech and industrials.
Institutional: 45% Bullish 🟢 | 40% Bearish 🔴 | 15% Neutral ⚪
Cautious positivity, focusing on corporate fundamentals amid policy uncertainties.
Overall Mood: Mildly positive, but stay alert for volatility from trade talks or inflation data.
Fear & Greed Index: 51 (Neutral) ⚖️
Balanced emotions: Not too scared, not too greedy.
Steady momentum, but watch for volatility spikes with upcoming data (e.g., inflation reports).
Market Outlook: Bullish 🚀
Bullish trend intact with no recession signals.
Expect modest single-digit % gains, led by earnings.
Stay cautious of pullbacks from policy news, but avoid shorting for now.
🔗 Related Pairs to Watch (in USD)
S&P 500 CFD ( SP:SPX ): Tracks broader market trends, often moves in tandem with DJIA.
NASDAQ 100 CFD ( NASDAQ:NDX ): Tech-heavy index, great for confirming bullish momentum.
FX:USDJPY : Currency pair sensitive to U.S. economic data and Fed policy.
OANDA:XAUUSD (Gold): Safe-haven asset; monitor for risk-off moves if sentiment shifts.
📝 Final Notes
This DJIA setup combines the tactical "Thief" layered entry strategy with robust market data to guide your trades. Stay disciplined, manage risk, and adapt the plan to your style. Let’s make smart moves together! 💪
✨ “If you find value in my analysis, a 👍 and 🚀 boost is much appreciated — it helps me share more setups with the community!”
#TradingView #DJIA #SwingTrading #DayTrading #ThiefStrategy #Bullish #TechnicalAnalysis #MarketAnalysis
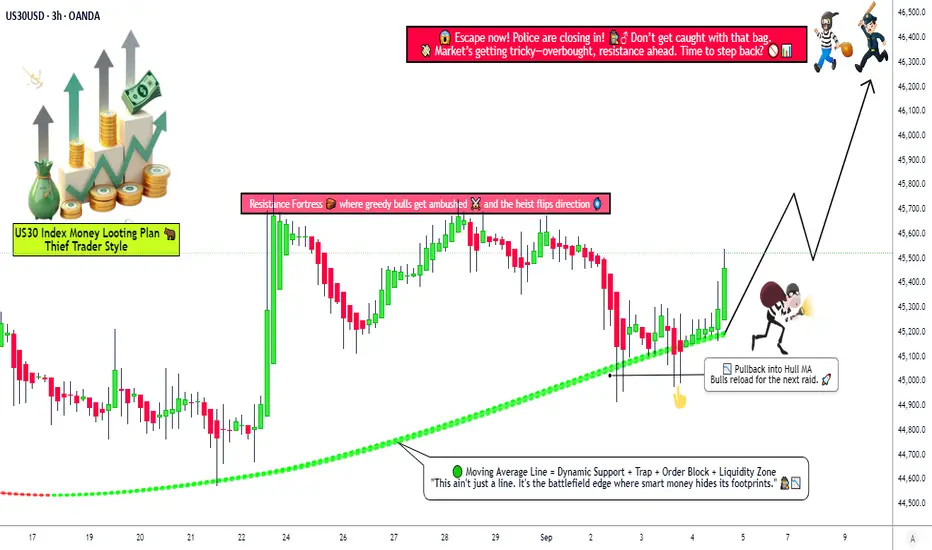
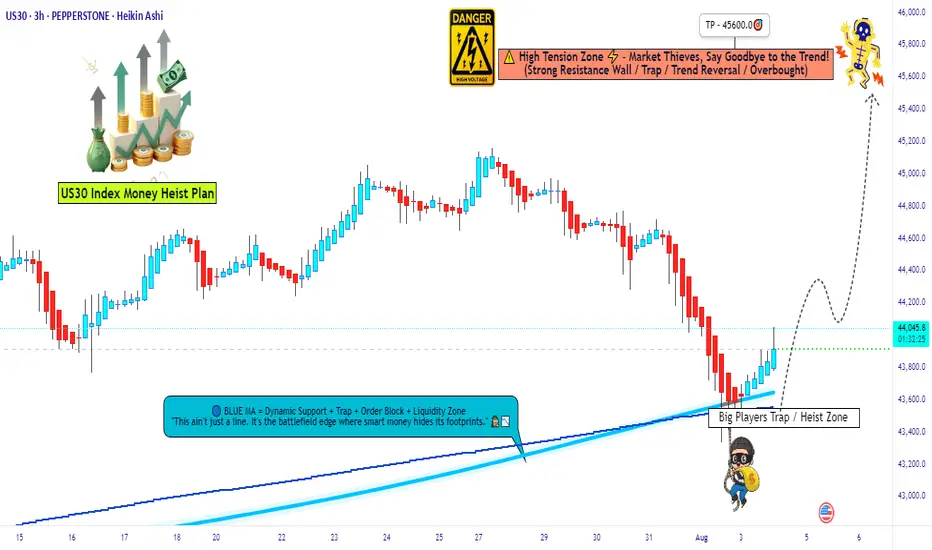
Dow Jones Bullish Strategy! Can the Market Break Higher?🚀 US30 Index Money-Making Plan (Swing / Day Trade) 📊
🧠 Trading Plan & Strategy (Thief Layer Style)
🚀 Approach: Bullish Hull Moving Average pullback plan — “bulls reloaded” for the next wave.
🎯 Entry (Layering Strategy): Multiple buy-limit layers → 45,200 • 45,300 • 45,400 • 45,500 (flexible to add more based on your own plan).
🛡️ Stop Loss: Reference point at 45,000. Adjust SL responsibly to match your personal risk tolerance & style.
💰 Target: Potential resistance zone (the “police barricade”) sits near 46,300. That’s where traders may consider taking profits.
📢 Note: This is an illustrative plan based on technicals — every trader should adapt TP/SL to their own strategy and risk appetite.
📊 US30 Market Report – September 4, 2025
📈 Current Price Snapshot
Trading near 45,000 points, up 0.05% today.
Strong monthly performance (+2.4%) and robust yearly gains (+17%).
Market showing resilience despite trade tensions.
😊 Retail Traders’ Sentiment
60% long vs 40% short → Tilted bullish.
Optimism driven by hopes for earnings growth & Fed rate cuts.
Caution remains due to tariff risks.
🏦 Institutional Traders’ Outlook
Cautiously bullish positioning.
Demand for equities continues, but with moderated exposure.
Buybacks + foreign inflows supporting price action.
🌡️ Overall Investor Mood
Neutral to positive tone.
Economic resilience balanced against policy uncertainty.
Healthy breadth across sectors, not just tech.
😨 Fear & Greed Index
Currently at 52 (Neutral).
Suggests balance — no extremes dominating.
Neutral setups often precede steady gains.
💹 Fundamental Score → 8/10
Strong corporate earnings (+12–13% growth projected next year).
Balance sheets remain solid.
AI & tech themes boosting key components.
Tariffs still a drag, but diversified exposure helps.
🌍 Macro Score → 7/10
US GDP growth cooling to 1.5%, but global rebound supports outlook.
Inflation ~2.9%; Fed rate cuts expected later.
Labor market stable, policy clarity could add upside.
🐂 Overall Market Outlook: Bullish Bias 📈
If support at 45,000 holds, potential move higher toward 46,000+.
Drivers: Strong earnings, Fed easing, broad rally.
Watch: Trade news headlines remain a key risk factor.
🔎 Why This Plan?
Hull MA pullback indicates momentum continuation.
Layered entries provide flexibility & better risk distribution.
Market sentiment + fundamentals align with bullish bias.
Resistance at 46,300 offers a clear take-profit zone.
📌 Related Pairs to Watch
CAPITALCOM:US30
FOREXCOM:SPX500
EIGHTCAP:NDQ100
TVC:VIX
TVC:DXY
✨ “If you find value in my analysis, a 👍 and 🚀 boost is much appreciated — it helps me share more setups with the community!”
#US30 #DowJones #Indices #SwingTrading #DayTrading #TechnicalAnalysis #StockMarket #TradingPlan #HullMA #LayeringStrategy
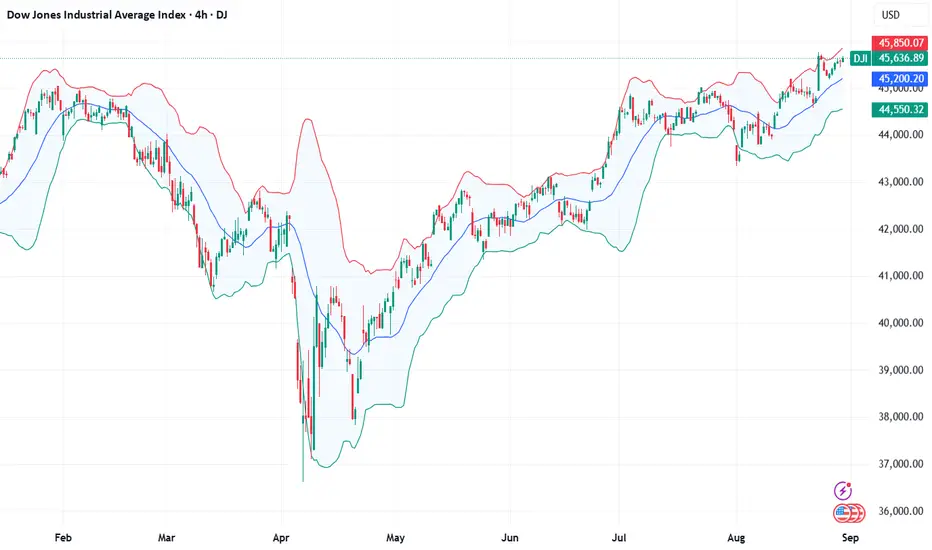
US30 At a Monumental High - Parabolic or Poised to Pull Back?US30 Technical Analysis: 🏭 At a Monumental High - Parabolic or Poised to Pull Back? 📉
Asset: US30 (Dow Jones Industrial Average CFD)
Analysis Date: September 5, 2025
Current Closing Price: 45,411.3 (as of 12:59 AM UTC+4)
Timeframes Analyzed: 1H, 4H, D, W
Executive Summary & Market Outlook 🧐
The US30 is trading at an all-time high in a powerful, near-parabolic advance. 🚀 While the trend is unequivocally bullish, the index is displaying extreme overbought conditions and is testing a major psychological barrier at 45,500. This represents a classic FOMO (Fear Of Missing Out) zone. A decisive breakout could see an extension of the rally, but the risk of a sharp, profit-driven pullback is significantly elevated. 📊 Prudence suggests waiting for a better risk-reward entry rather than chasing the move. This analysis outlines key levels for intraday traders 🎯 and swing traders 📈.
Multi-Timeframe Technical Analysis 🔍
1. Trend Analysis (Daily & 4-Hour Chart):
Primary Trend: 🟢 Strongly Bullish. Price is miles above all key moving averages, which are fanned out bullishly.
Momentum: 🟡 Exhaustion Signs. The rally has been almost vertical. Such moves are unsustainable in the short term and often conclude with a volatile correction.
2. Key Chart Patterns & Theories:
Parabolic Rise 📈➡️📉: The chart structure is parabolic. While bullish, these patterns are notoriously fragile and prone to sharp reversals as traders take profits.
Elliott Wave Theory 🌊: The rally is a clear five-wave impulse. We are likely in the final stages of Wave 5. This implies the completion of a cycle and warns that a larger, more complex corrective phase (Wave A-B-C or a deep Wave 4) is increasingly probable. A typical retracement target would be the 38.2% Fibonacci level of the entire Wave 3 rally.
Ichimoku Cloud (H4/D1) ☁️: Price is extremely far above the Cloud on all timeframes, indicating massive bullish momentum but also a severe over-extension from equilibrium. A mean reversion pullback towards the Cloud is a high-probability event.
Gann Theory ⏳: The 45,500 level is a key psychological and mathematical resistance. A decisive break above could target the next Gann angle, but rejection here is a significant risk.
3. Critical Support & Resistance Levels:
Resistance (R1): 45,500 - 45,600 (Key Psychological & Parabolic Resistance) 🚨
Resistance (R2): 46,000 (Projected Target if breakout occurs)
Current Closing Price: ~45,411
Support (S1): 44,800 - 45,000 (Immediate Support & Prior Breakout Zone) ✅
Support (S2): 44,200 - 44,400 (Major Support - 38.2% Fib & 21-day EMA) 🛡️
Support (S3): 43,500 (50-day EMA & 50% Fib Retracement)
4. Indicator Consensus:
RSI (14-period on 4H/D): Reading is well above 75 on both timeframes, signaling severely overbought conditions. 📛 This is the strongest sell signal the RSI can give and warns against new long positions.
Bollinger Bands (4H) 📏: Price is consistently piercing the upper band. A reversion to at least the middle band (20-period SMA) is a matter of when, not if.
Moving Averages: The bullish alignment is perfect but stretched. The EMA 21 on the 4H chart is critical short-term dynamic support.
Volume & VWAP: Volume may be declining on the most recent highs (a bearish divergence), suggesting the rally is running on fumes. 📉 Price is extremely extended from any logical Anchored VWAP level.
Trading Strategy & Forecast 🎯
A. Intraday Trading Strategy (5M - 1H Charts):
Bearish Scenario (Rejection Play) ⬇️: This is the highest probability play. Watch for bearish reversal candlestick patterns (e.g., Bearish Engulfing, Shooting Star 🌠, Doji) at or near the 45,500 resistance.
Entry: On confirmation of rejection (e.g., a break below a small consolidation low).
Stop Loss: Tight, above 45,600.
Target: 45,000 (TP1), 44,800 (TP2).
Bullish Scenario (Breakout Fade) ⚠️: Chasing a breakout here is high-risk. If price breaks above 45,500, it's safer to wait for a pullback to that level for a support re-test before considering a long.
B. Swing Trading Strategy (4H - D Charts):
Strategy: WAIT FOR A PULLBACK. The risk/reward for new long entries at this altitude is terrible. 🚫
Ideal Long Zones: Wait for a dip to 44,200 - 44,400 or even 43,500. This would provide a much healthier entry to ride the next potential leg up in the primary bull trend. ✅
Bearish Risk: A daily close below 44,000 would signal a deeper correction is underway, potentially targeting the 43,000 zone.
Risk Management & Conclusion ⚠️
Key Risk Events: All US economic data (especially jobs and inflation reports) and Fed speaker comments are potential catalysts for a volatility explosion. 🔥 The market is priced for perfection.
Position Sizing: Extreme caution is advised. This is a low-probability environment for new entries. Risk should be halved (e.g., 0.5% of account) due to the high volatility and unpredictability at peaks.
Conclusion: The US30 is in a spectacular bull run but is in a High-Risk Zone. 🎲 This is a time for profit protection for existing longs, not for FOMO buying. 🚫📈 Swing traders must be patient for a pullback. Intraday traders can look for short-term reversal signals. The most likely outcome is a healthy and necessary correction to recharge for the next move. 📉
Overall Bias: 🟢 Bullish above 44,200 | 🔴 Caution/Correction likely between 45,000-45,600
For individuals seeking to enhance their trading abilities based on the analyses provided, I recommend exploring the mentoring program offered by Shunya Trade. (Website: shunya dot trade)
I would appreciate your feedback on this analysis, as it will serve as a valuable resource for future endeavors.
Sincerely,
Shunya.Trade
Website: shunya dot trade
⚠️Disclaimer: This post is intended solely for educational purposes and does not constitute investment advice, financial advice, or trading recommendations. The views expressed herein are derived from technical analysis and are shared for informational purposes only. The stock market inherently carries risks, including the potential for capital loss. Therefore, readers are strongly advised to exercise prudent judgment before making any investment decisions. We assume no liability for any actions taken based on this content. For personalized guidance, it is recommended to consult a certified financial advisor.
US30 Technical Analysis Report - Dow Jones Industrial Average# US30 Technical Analysis: Dow Jones Industrial Average Comprehensive Multi-Timeframe Trading Strategy
Executive Summary
Current Price: 45,572.6 (August 30, 2025, 12:54 AM UTC+4)
Market Sentiment: Cautiously Bullish with Fed Policy Tailwinds
Primary Trend: Strong Uptrend with Consolidation Characteristics
Key Catalyst: Powell's Jackson Hole Speech Signaling Potential September Rate Cuts
The Dow Jones Industrial Average continues to exhibit remarkable strength, trading near all-time highs following Fed Chair Jerome Powell's dovish pivot at Jackson Hole. The index benefits from renewed optimism around rate cuts while maintaining its traditional value-oriented composition that typically outperforms during monetary easing cycles.
Market Context & Fundamental Backdrop
Federal Reserve Policy Landscape
Fed Chair Powell's Jackson Hole speech marked a significant shift in policy stance, with Powell indicating that conditions "may warrant" interest rate cuts. The Fed's dual mandate balance is shifting, with labor market risks now potentially outweighing inflation concerns. Markets are pricing in high probability of a September rate cut, with the current federal funds rate maintained at 4.25%-4.5%.
Economic Environment Assessment
The US economy has shown resilience despite policy uncertainties, though Powell warned of "unusual" labor market behavior that could become concerning. Recent inflation data has provided some reassurance to investors, with the consumer price index rising 2.7%, though tariff impacts remain a wildcard for future inflation trajectory.
Dow Jones Composition Dynamics
The Dow's 30 blue-chip constituents, including industrials, financials, and consumer staples, are well-positioned to benefit from lower interest rates. The index's price-weighted structure means high-priced stocks like Boeing, Goldman Sachs, and UnitedHealth Group carry significant influence on movements.
Recent Performance Context
The Dow has demonstrated exceptional strength, with recent sessions showing solid gains. The index reached fresh record highs during August, powered by strong performances from components like Home Depot. The index closed at 45,418.07 on August 26, showing consistent upward momentum throughout the month.
Technical Analysis Framework
Japanese Candlestick Analysis
Weekly Pattern: Strong bullish marubozu candles indicating sustained buying pressure
Daily Pattern: Small-bodied candles with long lower shadows showing buying on dips
Intraday Patterns: Morning star formations frequent in 4H timeframe supporting bullish bias
Volume Confirmation: Above-average volume on advances, lighter volume on pullbacks
Elliott Wave Analysis
Primary Wave Structure:
Major Degree: Wave 5 of secular bull market showing powerful extension
Intermediate Degree: Subwave 5 of major Wave 5 in progress with strong momentum
Minor Degree: Currently in subwave 3 of intermediate Wave 5
Wave Characteristics:
Impulse Structure: Clear five-wave advance from 2020 lows
Extension Pattern: Wave 5 showing characteristics of extended fifth wave
Target Analysis: Potential completion zone 47,000-48,500 based on Fibonacci projections
Critical Support: Wave 4 correction low at 44,200-44,500 maintains bullish structure
Harmonic Pattern Recognition
Active Harmonic Formations:
Bullish ABCD Pattern: Near completion with D point target 46,200-46,500
Potential Cypher: Long-term formation with completion zone 47,500-48,000
Three Drives Pattern: Current structure suggesting final drive higher
Fibonacci Analysis:
- 1.272 extension: 45,800 (approaching)
- 1.414 extension: 46,400 (intermediate target)
- 1.618 extension: 47,200 (major target)
- 2.0 extension: 48,500 (extended target)
Wyckoff Method Analysis
Phase Assessment: Markup Phase C - Strong hands control
Accumulation Evidence:
- Successful test of support zones showing institutional buying
- Sign of Strength (SOS) on Fed policy optimism
- Last Point of Support (LPS) established around 44,500
- Backup to Edge of Creek (BUE) showing minimal selling pressure
Markup Characteristics:
- Sustained advances on increasing volume
- Minor pullbacks on light volume
- No climactic selling evident
W.D. Gann Technical Analysis
# Square of 9 Application
Current Position: 45,572.6 = 213.48° on the Gann wheel
Critical Resistance Levels:
- 45,796 (214°) - immediate geometric resistance
- 46,225 (215°) - intermediate resistance zone
- 46,656 (216°) - major resistance confluence
Key Support Levels:
- 45,369 (213°) - immediate geometric support
- 44,944 (212°) - strong support zone
- 44,521 (211°) - major support level
# Time Theory Application
Critical Time Windows:
- September 2-6: 45-degree time angle from recent high
- September 20-23: Autumn equinox natural turning point
- October 14-21: 90-degree time cycle completion
- November 11-18: 144-degree major cycle
# Price and Time Squaring Analysis
Square Root of Price: √45,572.6 = 213.48
Next Significant Square Levels:
- 214² = 45,796 (immediate resistance)
- 215² = 46,225 (key target zone)
- 216² = 46,656 (intermediate target)
- 220² = 48,400 (major target)
Support Square Levels:
- 213² = 45,369 (immediate support)
- 212² = 44,944 (strong support)
- 210² = 44,100 (major support)
# Gann Angle Analysis
Primary Angles from Major Low:
- 1x1 Angle: Providing dynamic support around 45,200
- 2x1 Angle: Resistance trend line near 46,000
- 1x2 Angle: Long-term support at 44,500
Ichimoku Kinko Hyo Analysis
Cloud Configuration:
Tenkan-sen (9): 45,580 - Price slightly below, neutral to bullish
Kijun-sen (26): 45,420 - Price above, confirming bullish bias
Senkou Span A: 45,500 (cloud top)
Senkou Span B: 44,800 (cloud bottom)
Chikou Span: Above price action 26 periods ago (strongly bullish)
Assessment: Price trading above bullish cloud with all components aligned for continued strength.
Multi-Timeframe Technical Indicator Analysis
5-Minute Chart (Scalping Focus)
RSI(14): 58.2 - Bullish momentum without overbought conditions
VWAP: 45,568 - Price trading slightly above VWAP showing strength
Bollinger Bands: Middle band at 45,570, upper band at 45,620
Stochastic: 62.1 in bullish territory with room for advancement
Volume: Steady participation with no unusual spikes
Scalping Levels:
Micro Resistance: 45,590, 45,615, 45,640
Micro Support: 45,545, 45,520, 45,495
15-Minute Chart (Scalping Focus)
MACD: Positive momentum with bullish crossover potential
Williams %R: -38% showing healthy pullback from overbought
Moving Averages: EMA(20) > SMA(20) confirming short-term strength
Volume Profile: High volume node at 45,520-45,580
Key Trading Ranges:
Bullish Zone: 45,550-45,580 (buying opportunities)
Neutral Zone: 45,520-45,550 (range trading)
Bearish Zone: Below 45,520 (short opportunities)
1-Hour Chart (Day Trading)
RSI(14): 61.3 - Strong bullish momentum with room for extension
VWAP: 45,485 providing dynamic support trend
ADX(14): 34.2 indicating strong trend conditions
Parabolic SAR: Below price at 45,420 (bullish signal intact)
Day Trading Structure:
Primary Resistance: 45,650-45,700
Secondary Resistance: 45,800-45,850
Primary Support: 45,450-45,500
Secondary Support: 45,350-45,400
4-Hour Chart (Swing Trading)
RSI(14): 65.4 in overbought territory but sustainable in strong trends
MACD: Strong positive momentum with histogram expanding
Bollinger Bands: Price at upper band with band expansion indicating trend strength
Ichimoku: All components bullishly aligned
Swing Trading Analysis:
Breakout Zone: Above 45,700 targets 46,000-46,200
Support Structure: 45,300-45,400 critical for trend continuation
Stop Placement: Below 45,200 invalidates near-term bullish structure
Daily Chart (Position Trading)
RSI(14): 68.7 showing strong momentum but approaching overbought
MACD: Robust positive momentum with room for extension
Volume: Consistent above-average participation on advances
Moving Averages: All major MAs aligned in bullish configuration
Position Trading Framework:
Trend Channel: Upper channel resistance near 46,500
Support Trend Line: Rising support around 44,800-45,000
Pattern Analysis: Ascending channel with room for upper channel test
Weekly Chart (Long-term Analysis)
RSI(14): 72.1 approaching overbought levels (caution warranted)
MACD: Strong weekly momentum with positive histogram
Long-term Trend: Powerful secular uptrend since 2009 lows intact
Major Resistance: 47,000-47,500 based on measured moves
Monthly Chart (Strategic Perspective)
RSI(14): 74.3 significantly overbought (distribution risk increasing)
Long-term Structure: Multi-decade bull market showing maturity signs
Secular Targets: 50,000-52,000 based on long-term projections
Major Support: 40,000-42,000 represents significant correction zone
Comprehensive Support and Resistance Analysis
Primary Support Structure
1. 45,450-45,500: VWAP and Kijun-sen confluence (immediate)
2. 45,350-45,400: Previous consolidation zone with volume
3. 45,200-45,250: Rising trend line and minor swing support
4. 45,000-45,100: Psychological level and major trend confluence
5. 44,800-44,900: Cloud bottom and structural support
6. 44,500-44,600: Elliott Wave support and institutional interest
7. 44,200-44,300: Major correction low and key trend defense
Primary Resistance Structure
1. 45,650-45,700: Immediate intraday resistance and breakout level
2. 45,800-45,850: Short-term resistance and measured move target
3. 46,000-46,100: Major psychological level and Gann confluence
4. 46,200-46,300: Harmonic pattern completion zone
5. 46,500-46,600: Channel resistance and intermediate targets
6. 47,000-47,200: Major resistance zone and long-term targets
7. 47,500-48,000: Extended targets and secular resistance
Weekly Trading Strategy (September 2-6, 2025)
Monday, September 2, 2025 (Labor Day - US Markets Closed)
Market Environment: US equity markets closed for Labor Day holiday
Strategy Focus: Pre-positioning analysis for Tuesday's open
International Impact: Monitor global markets for overnight developments
Pre-Market Preparation:
Gap Analysis: Assess any gap formation from Friday's close
Overnight News: Monitor for Fed communications or economic releases
Global Sentiment: Track international markets for risk appetite cues
Tuesday, September 3, 2025
Market Environment: Return from holiday with potential catch-up volatility
Primary Strategy: Trend continuation with careful gap management
Volatility Expectation: Above normal due to holiday return dynamics
Intraday Trading Strategy:
Gap Scenarios:
Gap Up: Above 45,600 suggests continued strength
Gap Down: Below 45,500 may offer buying opportunity
No Gap: Normal trading within established range
Long Setup (Primary): 45,520-45,550
- Stop Loss: 45,480
- Target 1: 45,620 (1:2 R/R)
- Target 2: 45,700 (1:3.5 R/R)
Short Setup (Secondary): 45,680-45,720
- Stop Loss: 45,750
- Target 1: 45,600 (1:1 R/R)
- Target 2: 45,520 (1:2.3 R/R)
Wednesday, September 4, 2025
Market Environment: Mid-week momentum with potential economic data
Primary Strategy: Breakout preparation with volume confirmation
Focus: Fed speakers and economic indicators impact
Trading Approach:
Bullish Breakout: Above 45,750 with volume
- Entry: 45,760-45,780
- Stop: 45,700
- Targets: 45,850, 45,950, 46,050
Range Trading: Within 45,500-45,700
- Long: 45,520-45,540, Target: 45,650-45,680
- Short: 45,670-45,690, Target: 45,550-45,580
Risk Considerations: Reduce position sizes if range-bound continues
Thursday, September 5, 2025
Market Environment: High-impact day with jobs data potential
Primary Strategy: Economic data trading with technical confirmation
Key Factor: Employment data ahead of Friday's NFP
Economic Data Strategy:
Strong Employment: May delay Fed cuts, potential negative
Weak Employment: Supports Fed cut narrative, likely positive
Mixed Data: Technical levels become primary focus
Technical Breakout Setup:
Major Breakout: Above 46,000
- Volume Required: 150% of 20-day average
- Initial Target: 46,200-46,300
- Extended Target: 46,500-46,600
- Stop Loss: 45,850
Breakdown Scenario: Below 45,400
- Target: 45,200-45,100
- Extended: 45,000-44,900
- Stop Loss: 45,500
Friday, September 6, 2025
Market Environment: Non-Farm Payrolls day with weekly close focus
Primary Strategy: News trading with weekly positioning
Critical Importance: NFP data impact on Fed policy expectations
NFP Trading Strategy:
Strong NFP (>200K):
- Potential negative for rate cut hopes
- Technical resistance becomes more significant
- Focus on short opportunities near 46,000
Weak NFP (<150K):
- Strengthens rate cut case
- Bullish breakout potential increases
- Target 46,200-46,500 on strength
In-Line NFP (150-200K):
- Maintains current Fed expectations
- Technical levels drive trading
Weekly Close Analysis:
Bullish Close: Above 45,700 sets up next week advance
Neutral Close: 45,400-45,700 maintains current structure
Bearish Close: Below 45,400 suggests correction risk
Advanced Risk Management Framework
Position Sizing Matrix
Risk Allocation by Strategy:
5M Scalping: 0.3-0.5% of capital per trade
15M Scalping: 0.5-0.8% of capital per trade
1H Day Trading: 1-1.5% of capital per trade
4H Swing Trading: 2-3% of capital per trade
Daily Position Trading: 3-4% of capital per trade
Dynamic Stop Loss Framework
Volatility-Based Stops:
Current ATR: ~180 points daily average
Low Volatility: Stops at 120-150 points
Normal Volatility: Stops at 180-220 points
High Volatility: Stops at 250-300 points
Timeframe-Specific Stops:
5-Minute Charts: 60-80 points maximum
15-Minute Charts: 100-140 points maximum
1-Hour Charts: 180-250 points maximum
4-Hour Charts: 350-450 points maximum
Daily Charts: 600-800 points maximum
Profit-Taking Methodology
Systematic Profit Distribution:
Target 1 (40%): 1:1.5 Risk/Reward ratio
Target 2 (35%): 1:2.5 Risk/Reward ratio
Target 3 (25%): 1:4+ Risk/Reward ratio
Trailing Stops: Implement after Target 2 achievement
Portfolio Risk Controls
Maximum Exposure Limits:
Total Account Risk: 6% maximum across all positions
Single Trade Risk: 4% maximum concentration
Sector Concentration: 50% maximum in related trades
Daily Loss Limit: 3% account drawdown triggers review
Geopolitical and Economic Risk Assessment
Federal Reserve Policy Implications
September FOMC (17-18): High probability of 25bp cut based on Powell's signals
Policy Trajectory: Market expectations for 2-3 cuts through Q4 2025
Communication Risk: Any hawkish surprises could trigger significant correction
Independence Concerns: Trump administration pressure on Fed policy creates uncertainty
Economic Data Dependencies
Labor Market Dynamics: Powell's noted "unusual" behavior requires close monitoring
Inflation Trajectory: Tariff impacts creating uncertainty for price stability
GDP Resilience: Economy showing strength but policy impacts unclear
Consumer Health: Holiday spending season critical for Q4 performance
Political and Policy Risks
Tariff Implementation: Broad tariff policies could spike inflation and delay cuts
Trade Relations: China trade dynamics affecting multinational Dow components
Fiscal Policy: Government spending and tax policies impacting corporate earnings
Regulatory Environment: Industry-specific regulations affecting key sectors
Global Economic Factors
International Growth: Global slowdown impacts for multinational corporations
Currency Dynamics: Dollar strength/weakness affecting overseas earnings
Commodity Prices: Input cost inflation affecting manufacturing components
Geopolitical Tensions: Regional conflicts creating safe-haven demand for US assets
Sectoral Analysis and Dow Components
Sector Weight Distribution
Industrials (20%): Boeing, Caterpillar, 3M leading weight
Financials (18%): Goldman Sachs, JPMorgan, American Express
Technology (15%): Microsoft, Apple, Intel
Healthcare (12%): UnitedHealth, Johnson & Johnson, Merck
Consumer (15%): Home Depot, McDonald's, Nike
Other (20%): Utilities, materials, energy components
Rate Cut Beneficiaries
High Sensitivity Sectors:
1. Financials: Yield curve steepening benefits net interest margins
2. Real Estate (REITs): Lower rates increase property valuations
3. Utilities: Bond proxy sectors benefit from rate environment
4. Consumer Discretionary: Lower borrowing costs boost spending
Potential Underperformers
Rate Cut Challenges:
1. Insurance: Lower investment yields pressure profitability
2. Banks: Net interest margin compression risks
3. Dollar-Sensitive: Strong international exposure may face currency headwinds
Component-Specific Analysis
Key Drivers:
Boeing: Recovery story and rate environment benefits
Goldman Sachs: Trading revenue and investment banking activity
Home Depot: Housing sector sensitivity to interest rates
Apple: Consumer spending and international exposure
Advanced Technical Patterns and Setups
Ichimoku Advanced Strategies
Cloud Breakout Setup:
- Price above cloud with expanding bands
- Tenkan above Kijun with widening gap
- Chikou Span clearing resistance
- Volume confirmation on breakouts
Kumo Twist Analysis:
- Future cloud turning bullish through Q4 2025
- Cloud thickness indicating strong trend support
- Senkou Span crossovers providing early signals
Gann-Based Trading Systems
Square of 9 Implementation:
Long Trades: Buy at 212° (44,944) targeting 215° (46,225)
Short Trades: Sell at 216° (46,656) targeting 213° (45,369)
Breakout Trades: Above 215° targets 220° (48,400)
Time and Price Confluence:
- Major resistance at time/price squares
- Natural reversal zones at geometric intersections
- Seasonal time cycles confirming geometric levels
Wyckoff Accumulation/Distribution Analysis
Markup Phase Characteristics:
Sign of Strength: Fed policy optimism driving advances
Last Point of Support: 44,500 zone established
Backup to Edge of Creek: Minimal selling pressure evident
Secondary Test: Any pullback to 45,200 should hold
Distribution Warning Signs:
Climactic Volume: Heavy selling on any approach to 47,500
Weakness Signs: Inability to hold gains on positive news
Phase A Risk: Sharp reversal from major resistance levels
Market Microstructure and Execution
High-Frequency Trading Impact
Algorithm Concentration Zones:
45,000 Level: Major HFT support algorithm activity
46,000 Level: Significant resistance algorithm presence
Round Numbers: Enhanced activity at 500-point intervals
Optimal Execution Timing:
9:30-10:00 EST: Opening volatility and opportunity
10:30-11:00 EST: Post-opening continuation patterns
14:00-14:30 EST: European close overlap effects
15:30-16:00 EST: Final hour institutional positioning
Liquidity Analysis
High Liquidity Zones: 45,400-45,700 with tight bid/ask spreads
Reduced Liquidity: Above 46,500 requiring careful position sizing
After-Hours Considerations: Limited liquidity requiring smaller sizes
Order Flow Characteristics
Institutional Patterns:
Accumulation Evidence: Large block buying 45,200-45,500
Distribution Monitoring: Watch for heavy selling above 46,200
Momentum Algorithms: Active participation on breakout moves
Technology Integration and Trading Infrastructure
Essential Trading Platforms
1. TradingView: Advanced Dow Jones charting and technical analysis
2. Interactive Brokers: Professional execution and margin capabilities
3. E*TRADE: Retail-friendly interface with advanced tools
4. Charles Schwab: Commission-free trading with research integration
Critical Alert Configuration
Price-Based Alerts:
Breakout Levels: 45,750 (bullish), 45,400 (bearish)
Psychological Levels: 46,000, 46,500, 47,000
Gann Squares: 44,944, 46,225, 46,656
Volume-Based Monitoring:
Unusual Volume: >150% of 20-day average
Block Trades: >$20M institutional transactions
Index Rebalancing: Quarterly component changes
News and Event Alerts:
Fed Communications: FOMC members speeches and interviews
Economic Releases: Employment, inflation, GDP data
Component Earnings: Major Dow constituent results
Policy Announcements: Trade, fiscal, regulatory changes
Advanced Analysis Integration
Options Market Analysis: Monitor Dow options for unusual activity and sentiment
Futures Market Positioning: Track YM futures for institutional positioning
ETF Flow Analysis: Monitor DIA and other Dow ETFs for flow patterns
Cross-Market Correlation: Track relationships with bonds, commodities, currencies
Calendar and Seasonal Considerations
September Seasonality
Historically challenging month for equities, though current Fed policy support may override seasonal weakness. Dow's defensive characteristics may provide relative outperformance during seasonal stress periods.
Federal Reserve Timeline
September 17-18: FOMC Meeting with high cut probability
November 6-7: Next FOMC Meeting
December 17-18: Final 2025 FOMC Meeting with year-end implications
Earnings Calendar Impact
Q3 2025 Reporting Season: October-November critical for Dow components
Key Reporters: Goldman Sachs, JPMorgan, Boeing, Apple reporting schedules
Guidance Analysis: Management commentary on rate environment benefits
Holiday and Event Calendar
Labor Day (Sep 2): US markets closed
Columbus Day (Oct 14): Bond markets closed, equity markets open
Election Considerations: Political developments affecting policy expectations
Year-End Positioning: Institutional rebalancing effects in Q4
Conclusion and Strategic Outlook
The Dow Jones Industrial Average stands at a pivotal moment, benefiting from Fed Chair Powell's dovish pivot while trading at historically elevated levels. The index's composition of blue-chip, dividend-paying companies positions it well for a potential rate-cutting cycle, though elevated valuations require careful risk management.
Strategic Investment Themes:
1. Fed Policy Tailwind: Rate cutting cycle benefiting rate-sensitive components
2. Value vs Growth: Dow's value orientation may outperform in rate cut environment
3. Dividend Aristocrats: Quality dividend payers attractive in lower rate environment
4. Economic Resilience: Defensive characteristics providing downside protection
Trading Strategy Priorities:
Trend Following: Primary bias remains bullish with Fed support
Breakout Trading: Monitor 46,000 level for significant upside potential
Risk Management: Elevated levels require disciplined position sizing
Component Selection: Focus on rate-sensitive sectors for maximum benefit
Medium-Term Outlook (3-6 months):
Technical and fundamental analysis converges on a constructive outlook for the Dow through Q4 2025. The combination of Fed accommodation, resilient economic data, and strong corporate balance sheets supports advancement toward 47,000-48,000 targets, though any hawkish Fed surprises or geopolitical shocks could trigger corrections to 44,000-44,500 support.
Risk Management Focus:
Overbought Conditions: Monthly RSI above 74 suggests caution at higher levels
Policy Risk: Fed policy error or hawkish surprise major downside risk
Valuation Concerns: Historical high levels warrant selective positioning
Correlation Risk: High correlation with broader market during stress periods
Long-Term Strategic Considerations:
The secular bull market remains intact, supported by American economic dynamism and corporate innovation. However, demographic trends, debt levels, and policy uncertainty create longer-term challenges requiring ongoing assessment and strategy adjustment.
Traders and investors should maintain flexibility while capitalizing on the current favorable environment, with particular attention to the Fed policy trajectory and its impact on the interest rate-sensitive components that comprise significant portions of the Dow Jones Industrial Average.
---
*This comprehensive analysis integrates multiple technical methodologies with current fundamental drivers affecting the Dow Jones Industrial Average. All recommendations should be implemented within individual risk tolerance parameters and adapted to evolving market conditions. The blue-chip nature of Dow components provides some defensive characteristics, though elevated levels require enhanced risk awareness.*
---
For individuals seeking to enhance their trading abilities based on the analyses provided, I recommend exploring the mentoring program offered by Shunya Trade. (Website: shunya dot trade)
I would appreciate your feedback on this analysis, as it will serve as a valuable resource for future endeavors.
Sincerely,
Shunya.Trade
Website: shunya dot trade
---
Disclaimer: This post is intended solely for educational purposes and does not constitute investment advice, financial advice, or trading recommendations. The views expressed herein are derived from technical analysis and are shared for informational purposes only. The stock market inherently carries risks, including the potential for capital loss. Therefore, readers are strongly advised to exercise prudent judgment before making any investment decisions. We assume no liability for any actions taken based on this content. For personalized guidance, it is recommended to consult a certified financial advisor.
#DJI30 hits record highs: The index just made history!On August 22, 2025, the #DJI30 surged past 45,700, setting a new all-time high. The rally was fueled by growing expectations of a Fed rate cut, with cheap money once again making stocks attractive. Strong earnings reports from industrial and banking sectors, along with new White House infrastructure investment plans, added to the bullish sentiment. A solid labor market and resilient consumer activity continue to ease recession fears, prompting capital to flow out of volatile assets and into blue-chip stocks. As a result, #DJI30 posted a powerful breakout and reinforced its role as a key barometer of U.S. economic strength.
Why the #DJI30 rally may still have room to run:
Easing Fed policy: Lower rates and controlled inflation create favorable conditions for borrowing and investing.
U.S. infrastructure expansion: Government spending on transport, energy, and digitalization supports real-sector companies — the core of #DJI30.
Strong corporate earnings & dividends: Many Dow components offer reliable dividends, making the index attractive amid broader market volatility.
Shift from risky assets: Funds and individual investors are rotating out of crypto and growth stocks into more stable “industrial giants.”
U.S. geopolitical resilience: Despite global tensions, the U.S. remains a “safe haven” for investors, boosting demand for American equities.
The continued rise of #DJI30 is underpinned by robust corporate profitability and the overall resilience of the U.S. economy. The latest earnings season confirmed the strength of major industrial and financial players, while easing inflation and expectations of a Fed rate cut provide a supportive backdrop. #DJI30 remains a reliable gauge of market stability and investor risk appetite worldwide. According to FreshForex, this opens a window of opportunity for long positions on #DJI30.
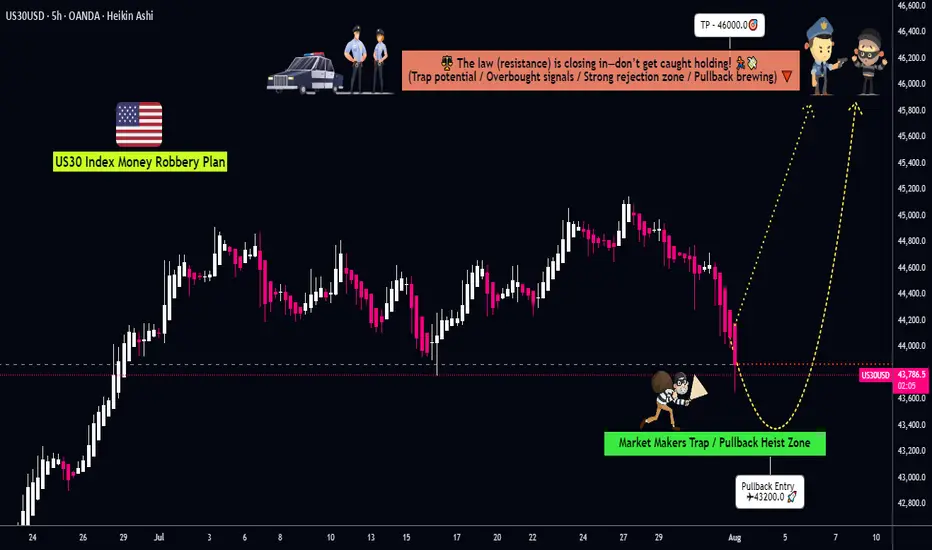
Heist Alert: Dow 30 Bullish Surge Incoming – Lock In Targets🦹♂️💎 “US30 Gold Vault Heist” – Thief’s Bullish Break-In Plan! 🚨📈
(Brought to you by Thief Trader – Layered Entry. Zero Mercy. Big Bags.)
🌍 Welcome to the Heist Floor, Global Market Bandits!
🎯 US30 is the next vault on the hitlist – and we’re going in loud but calculated.
💣 The Setup: Bullish Raid in Progress!
The Thief has eyes on Wall Street's armored vault — US30 Index — gearing up for a multi-layered bullish assault.
💼 Using limit orders like C4 on the door hinges, we’re stacking precise entries for maximum loot extraction. This isn’t gambling — this is organized market crime.
🔓 Entry Protocol – Any Price Level Is Breachable
🪜 Layered Limit Orders: Entry at any market level, multiple orders spread like a thief’s toolkit.
No sniper candle required — we work the shadows and stack with precision.
(Use the 15m-1H TF to tighten your strike zone.)
🛑 Stop Loss – The Getaway Hatch
📍 SL parked at 43300.0 – if the mission fails, we vanish clean.
No chasing losses — the next heist awaits.
📈 Take Profit – The Loot Vault
🎯 Target: 45600
That’s the gold room, the top floor, the getaway car location.
Use trailing SLs to secure the bag mid-run if resistance agents start showing up.
🧠 Behind the Heist – What’s Fueling This Move?
Global risk-on tone? ✅
Dow futures resilience? ✅
Thief’s sentiment meter flashing GREEN? ✅
Index rebalancing & sector flow favoring bulls? ✅
We don’t just trade the chart. We rob the macro narrative.
🚫 News Caution – No Sudden Sirens
Avoid entering during red folder data drops or FOMC speeches.
Stay ghosted. Let the volatility settle, then strike. 🕵️♂️
💥 Smash the BOOST Button 💖 If You’re With the Crew!
Let’s run this like a proper cartel of information — share it, save it, tag your trader circle.
Every like supports the next robbery plan.
No signals. No fluff. Just pure market exploitation.
📌 Disclaimer: Educational analysis only. No financial advice. Manage your risk like a true thief — never expose the whole bag.
💼📊 Thief Trader Out — More heist maps coming soon.
🔐 Rob Smart. Stack Heavy. Run Fast. 🦹♂️💸📈
Dow Jones: Explosive US30 Trade Setup – Entry,Trap & Exit Mapped💎 Dow Jones Robbery Blueprint: The US30 Vault Crack Plan 💎
(Maximized for reach — within TradingView title limit)
🌟Hi! Hola! Ola! Bonjour! Hallo! Marhaba!🌟
Dear Market Robbers & Money Movers 🕵️♂️💰🚨
This ain't your average analysis — it’s a Thief Trader-style 🔥tactical mission🔥 aimed at the mighty "US30/DJI" (Dow Jones Industrial Average). We're talkin' about a precision heist with a full blueprint: entry zones, trap setups, and escape exits. Read carefully — this ain’t for the faint-hearted traders! 🧠🦾
🧠 Entry Zones (The Break-In) 📈
🛠 ENTRY 1: Candle wick near 44200.0 – that’s the resistance gate. Wait for confirmation.
🎯 ENTRY 2: Sneak in at the Market Makers’ Trap around 43200.00 – a dirty zone where retailers get baited. Perfect time to strike long!
🧱 DCA/Layering strategy recommended. Stack those buy orders like a thief layering explosives on a safe. 💣💸
🛑 Risk Levels (Escape Routes/Stop Loss)
🔊 "Listen up, vault raiders! Never drop your SL until breakout is confirmed. If you jump early, you might land in a bear trap! 🪤"
🔐 Stop Zones (Based on Strategy):
🔐 Max Risk SL (5H TF): If you're deep, your last stand is at 43000.0
☝️ SL depends on your position sizing, number of entries, and risk appetite. Trade like a thief, not a gambler.
🎯 Heist Target (Profit Exit)
🏁 Escape Point: 46000.0 — or exit before heat rises! Don’t be greedy. Rob and vanish. 💨💰
🔥 Market Mood: Why the Heist Is On
"US30/DJI" is bullish AF — thanks to:
📊 Macro-Economic Wind at Our Back
📈 Institutional momentum
📰 Strong sentiment and intermarket flows
Check your chart radar: Fundamentals + technicals aligning = green light for robbery! 🟢
⚠️ Tactical Reminder: News Can Jam the Plan
📵 Avoid new entries during major economic releases
🛡 Use trailing SLs to protect running trades
Stay alert, stay alive. 💡
❤️ Support the Robbery Crew
Hit that 💥BOOST💥 — your love fuels our next mission.
Join us and ride daily heist plans with Thief Trading Style 🏴☠️🚀💰
US30 Robbery Blueprint: Breakout, Pullback, Escape Setup💎 Dow Jones Robbery Blueprint: The US30 Vault Crack Plan 💎
(Maximized for reach — within TradingView title limit)
🌟Hi! Hola! Ola! Bonjour! Hallo! Marhaba!🌟
Dear Market Robbers & Money Movers 🕵️♂️💰🚨
This ain't your average analysis — it’s a Thief Trader-style 🔥tactical mission🔥 aimed at the mighty "US30/DJI" (Dow Jones Industrial Average). We're talkin' about a precision heist with a full blueprint: entry zones, trap setups, and escape exits. Read carefully — this ain’t for the faint-hearted traders! 🧠🦾
🧠 Entry Zones (The Break-In) 📈
🛠 ENTRY 1: Crack the wall near 44700.00 – that’s the resistance gate. Wait for confirmation.
🎯 ENTRY 2: Sneak in at the Market Makers’ Trap around 43500.00 – a dirty zone where retailers get baited. Perfect time to strike long!
🧱 DCA/Layering strategy recommended. Stack those buy orders like a thief layering explosives on a safe. 💣💸
🛑 Risk Levels (Escape Routes/Stop Loss)
🔊 "Listen up, vault raiders! Never drop your SL until breakout is confirmed. If you jump early, you might land in a bear trap! 🪤"
🔐 Stop Zones (Based on Strategy):
📌 Swing Buy SL (2H TF): Place at 44100.00 for the stealth buy.
🏦 Institutional SL (Swing Zone): Drop it around 43000.00
🔐 Max Risk SL (3H TF): If you're deep, your last stand is at 39200.00
☝️ SL depends on your position sizing, number of entries, and risk appetite. Trade like a thief, not a gambler.
🎯 Heist Target (Profit Exit)
🏁 Escape Point: 46200.00 — or exit before heat rises! Don’t be greedy. Rob and vanish. 💨💰
🔥 Market Mood: Why the Heist Is On
"US30/DJI" is bullish AF — thanks to:
📊 Macro-Economic Wind at Our Back
📈 Institutional momentum
📰 Strong sentiment and intermarket flows
Check your chart radar: Fundamentals + technicals aligning = green light for robbery! 🟢
⚠️ Tactical Reminder: News Can Jam the Plan
📵 Avoid new entries during major economic releases
🛡 Use trailing SLs to protect running trades
Stay alert, stay alive. 💡
❤️ Support the Robbery Crew
Hit that 💥BOOST💥 — your love fuels our next mission.
Join us and ride daily heist plans with Thief Trading Style 🏴☠️🚀💰

Market Heist in Progress! US30/DJI Long Trade – Ride or Escape?🔥 "The US30/DJI Heist: Bullish Loot & Escape Before the Trap!" 🔥
🌟 Hi! Hola! Ola! Bonjour! Hallo! Marhaba! 🌟
Dear Money Makers & Market Robbers, 🤑💰💸✈️
Based on the 🔥Thief Trading Style🔥 (technical + fundamental analysis), here’s our master plan to heist the US30/DJI (Dow Jones Industrial Average). Follow the strategy on the chart—long entry is the play! Aim to escape near the high-risk RED Zone (overbought, consolidation, potential reversal). The bears are lurking, so take profits and treat yourself—you’ve earned it! 💪🏆🎉
🚀Entry (The Vault is Open!)
"Swipe the bullish loot at any price!"
For precision, place buy limit orders within 15-30min timeframe (recent swing lows/highs).
Set alerts! Don’t miss the heist.
🛑 Stop Loss (Safety Net)
Thief-style SL at nearest swing low (3H timeframe) → 41,400 (adjust based on risk/lot size).
🏴☠️ Target 🎯: 44,200.00
Bullish momentum is fueling this heist—ride the wave but exit before the trap!
📰 Fundamental Backing (Why This Heist Works)
Macroeconomic trends, COT data, geopolitics, and sentiment align for bullish moves.
Full analysis? Check our bio0 linkk! 👉🔗🌎
⚠️ Trading Alerts (News & Risk Mgmt)
Avoid new trades during high-impact news (volatility = danger).
Use trailing stops to lock profits and dodge sudden reversals.
💥 Boost This Heist!
Hit 👍 (Boost Button) to strengthen our robbery squad!
More heists = More profits—stay tuned for the next steal! 🚀🤑
See you soon, fellow thieves! 🤝🎉

Surprising ups and downs in global indicesJune brought contrasting moves across global stock markets: while the U.S. and Asia posted gains, Europe struggled under pressure. Rising tensions between Iran and Israel, political instability in the EU, and shifting rate expectations fueled volatility. In search of stability, investors turned to U.S. tech and exporters — pushing the S&P 500 (#SP500) and Nasdaq 100 (#NQ100) higher.
Key market movers in June:
• #SP500 (+0.96%), Dow Jones (#DJI30) (+0.89%), #NQ100 (+0.94%) – buoyed by dovish Fed tone and Iran’s restrained response to U.S. strikes. #Tesla surged 8.2%, with #IBM also among top gainers.
• Hong Kong 50 (#HSI) (+3%) – lifted by strong retail data and hopes of new stimulus from China.
• Australia 200 (#ASX) (+1.25%) – boosted by RBA rate cut expectations and strong tech sector performance.
• France 40 (#CAC40) (–2.76%) – weighed down by political risks and weakness in luxury stocks.
• Europe 50 (#ESTX50) (–1.8%) – hurt by soft ECB tone and weaker business activity.
• DAX 30 (#DAX30) (–3%) – pressured by weak industrial data and fading Chinese demand.
S&P 500 and Nasdaq 100 continue to rise on solid macro data, a softer Fed stance, and strong earnings from major tech players. Analysts at FreshForex believe investor confidence in the U.S. recovery supports the ongoing bullish trend.

"US30/DJI" Index Market Bullish Robbery (Swing Trade Plan)🌟Hi! Hola! Ola! Bonjour! Hallo! Marhaba!🌟
Dear Money Makers & Robbers, 🤑 💰💸✈️
Based on 🔥Thief Trading style technical and fundamental analysis🔥, here is our master plan to heist the "US30/DJI" Index Market Heist. Please adhere to the strategy I've outlined in the chart, which emphasizes long entry. Our aim is to escape near the high-risk YELLOW MA Zone. It's a Risky level, overbought market, consolidation, trend reversal, trap at the level where traders and bearish robbers are stronger. 🏆💸"Take profit and treat yourself, traders. You deserve it!💪🏆🎉
Entry 📈 : "The vault is wide open! Swipe the Bullish loot at any price - the heist is on!
however I advise to Place buy limit orders within a 15 or 30 minute timeframe most recent or swing, low or high level. I Highly recommended you to put alert in your chart.
Stop Loss 🛑:
Thief SL placed at the Nearest / Swing low level Using the 3H timeframe (39200) Day/Swing trade basis.
SL is based on your risk of the trade, lot size and how many multiple orders you have to take.
🏴☠️Target 🎯: 42400
💰💵💸"US30/DJI" Index Money Heist Plan is currently experiencing a bullishness,., driven by several key factors. .☝☝☝
📰🗞️Get & Read the Fundamental, Macro Economics, COT Report, Geopolitical and News Analysis, Sentimental Outlook, Intermarket Analysis, Index-Specific Analysis, Future trend targets with Overall outlook score... go ahead to check 👉👉👉🔗🔗🌎🌏🗺
⚠️Trading Alert : News Releases and Position Management 📰🗞️🚫🚏
As a reminder, news releases can have a significant impact on market prices and volatility. To minimize potential losses and protect your running positions,
we recommend the following:
Avoid taking new trades during news releases
Use trailing stop-loss orders to protect your running positions and lock in profits
💖Supporting our robbery plan 💥Hit the Boost Button💥 will enable us to effortlessly make and steal money 💰💵. Boost the strength of our robbery team. Every day in this market make money with ease by using the Thief Trading Style.🏆💪🤝❤️🎉🚀
I'll see you soon with another heist plan, so stay tuned 🤑🐱👤🤗🤩

"US30 Heist Alert: Thief Style's Bullish Plan to Steal Profits!"🌟 Salut! Ciao! Hola! Konnichiwa! 🌟
Dear Wealth Raiders & Market Bandits, 🤑💰✈️
Here’s our slick *Thief Trading Style* heist plan for the **US30 / Dow Jones Industrial Average Cash** Index, crafted with sharp technicals and fundamentals. 💥 Stick to the chart’s long entry strategy and aim to slip out near the spicy Yellow ATR Zone—a risky, overbought level where bears and traps lurk. 🏆💸 *Grab profits and treat yourself, you’ve earned it!* 💪🎉
**Entry 📈**: The heist kicks off! Watch for a breakout above the MA line (42600.0) to jump in—bullish riches await! 🤑 Set *buy stop orders* above the MA or *buy limit orders* near the most recent 15/30-min swing low/high for pullback entries. 🚨 Set an *alert* to catch the breakout signal!
**Stop Loss 🛑**: Yo, thieves, listen up! 🗣️ For buy stop orders, hold off on placing that stop loss until the breakout confirms. 🔊 Place it at the 8H recent/swing low (40850.0) for day/swing trades. Adjust SL based on your risk, lot size, and number of orders. Play it smart, or it’s your loot on the line! ⚠️🔥
**Target 🎯**: Aim for 44500.0 or bail before the target hits. 🏴☠️
**Scalpers, eyes here 👀**: Stick to long-side scalps. Big bankrolls can dive in; smaller ones, join the swing trade heist. Use *trailing SL* to lock in your haul. 💰
💸 **US30 Market Heist Outlook**: The index is neutral but leaning bullish, fueled by key drivers. ☝ Check the fundamentals, macroeconomics, COT reports, geopolitics, sentiment, intermarket analysis, and future trend targets for the full score. 🌎🔗
⚠️ **Trading Alert: News & Position Management** 📰🚫
News can shake the market hard. To protect your loot:
- Skip new trades during news releases.
- Use trailing stop-loss orders to secure running profits.
💖 Boost our heist plan! 🚀 Hit that *Boost Button* to power up our robbery squad. With *Thief Trading Style*, we’re snatching profits daily. 🏆🤝 Stay sharp for the next heist plan! 🤑🐱👤🤩
---
### Latest Real-Time Data (UTC+1, May 16, 2025) 📊
*Data sourced from reliable platforms like Financial Juice and official market feeds.*
**Indices** 📈
- US30 (Dow Jones): 42580.0 | +0.18% 😊
- S&P 500: 5720.5 | +0.12% 😄
- NASDAQ 100: 20150.2 | +0.25% 😊
- FTSE 100: 8250.3 | -0.05% 😐
---
### Latest COT Data (Updated Friday, May 9, 2025) 📑
*Commitment of Traders (COT) report for US30/Dow Jones futures, sourced from CFTC.*
- **Non-Commercial (Speculators)**:
- Long: 45,200 contracts | +2,500 😄
- Short: 38,900 contracts | -1,200 😊
- Net Position: +6,300 (Bullish bias) 🟢
- **Commercial (Hedgers)**:
- Long: 82,500 contracts | -1,000 😐
- Short: 90,700 contracts | +800 😐
- Net Position: -8,200 (Bearish hedge) 🔴
- **Open Interest**: 165,400 contracts | +1,200 😊
- **Key Insight**: Speculators are increasing bullish bets, while hedgers lean bearish, signaling potential volatility near resistance levels like the Yellow ATR Zone. ⚠️
---
💥 Join the *Thief Trading* crew, boost the plan, and let’s raid the markets together! 🤑🚀

"US30/DJI30" Index CFD Market Heist Plan (Scalping/Day Trade)🌟Hi! Hola! Ola! Bonjour! Hallo! Marhaba!🌟
Dear Money Makers & Robbers, 🤑 💰💸✈️
Based on 🔥Thief Trading style technical and fundamental analysis🔥, here is our master plan to heist the "US30/DJI30" Index CFD Market. Please adhere to the strategy I've outlined in the chart, which emphasizes long entry. Our aim is to escape near the high-risk MA Zone. Risky level, overbought market, consolidation, trend reversal, trap at the level where traders and bearish robbers are stronger. 🏆💸"Take profit and treat yourself, traders. You deserve it!💪🏆🎉
Entry 📈 : "The heist is on! Wait for the MA breakout (40800) then make your move - Bullish profits await!"
however I advise to Place Buy stop orders above the Moving average (or) Place buy limit orders within a 15 or 30 minute timeframe most recent or swing, low or high level for Pullback entries.
📌I strongly advise you to set an "alert (Alarm)" on your chart so you can see when the breakout entry occurs.
Stop Loss 🛑: "🔊 Yo, listen up! 🗣️ If you're lookin' to get in on a buy stop order, don't even think about settin' that stop loss till after the breakout 🚀. You feel me? Now, if you're smart, you'll place that stop loss where I told you to 📍, but if you're a rebel, you can put it wherever you like 🤪 - just don't say I didn't warn you ⚠️. You're playin' with fire 🔥, and it's your risk, not mine 👊."
📍 Thief SL placed at the recent/swing low level Using the 1H timeframe (39200) Day trade basis.
📍 SL is based on your risk of the trade, lot size and how many multiple orders you have to take.
🏴☠️Target 🎯: 42700 (or) Escape Before the Target
🧲Scalpers, take note 👀 : only scalp on the Long side. If you have a lot of money, you can go straight away; if not, you can join swing traders and carry out the robbery plan. Use trailing SL to safeguard your money 💰.
💰💵💴💸"US30/DJI30" Index CFD Market Heist Plan (Day / Scalping Trade) is currently experiencing a bullishness🐂.., driven by several key factors.👇👇👇
📰🗞️Get & Read the Fundamental, Macro, COT Report, Quantitative Analysis, Sentimental Outlook, Intermarket Analysis, Future trend targets... go ahead to check 👉👉👉🔗🔗
⚠️Trading Alert : News Releases and Position Management 📰 🗞️ 🚫🚏
As a reminder, news releases can have a significant impact on market prices and volatility. To minimize potential losses and protect your running positions,
we recommend the following:
Avoid taking new trades during news releases
Use trailing stop-loss orders to protect your running positions and lock in profits
💖Supporting our robbery plan 💥Hit the Boost Button💥 will enable us to effortlessly make and steal money 💰💵. Boost the strength of our robbery team. Every day in this market make money with ease by using the Thief Trading Style.🏆💪🤝❤️🎉🚀
I'll see you soon with another heist plan, so stay tuned 🤑🐱👤🤗🤩

US30/DJI "Dow Jones" Index CFD Market Heist Plan (Day or Swing)🌟Hi! Hola! Ola! Bonjour! Hallo! Marhaba!🌟
Dear Money Makers & Robbers, 🤑 💰💸✈️
Based on 🔥Thief Trading style technical and fundamental analysis🔥, here is our master plan to heist the US30/DJI "Dow Jones" Index CFD Market. Please adhere to the strategy I've outlined in the chart, which emphasizes long entry. Our aim is the high-risk Red Zone. Risky level, overbought market, consolidation, trend reversal, trap at the level where traders and bearish robbers are stronger. 🏆💸Book Profits Be wealthy and safe trade.💪🏆🎉
Entry 📈 : "The heist is on! Wait for the MA breakout (42200) then make your move - Bullish profits await!"
however I advise to Place Buy stop orders above the Moving average (or) Place buy limit orders within a 15 or 30 minute timeframe most recent or swing, low or high level.
📌I strongly advise you to set an alert on your chart so you can see when the breakout entry occurs.
Stop Loss 🛑:
Thief SL placed at the recent/swing low level Using the 1H timeframe (41400) swing trade basis.
SL is based on your risk of the trade, lot size and how many multiple orders you have to take.
🏴☠️Target 🎯: 43100 (or) Escape Before the Target
🧲Scalpers, take note 👀 : only scalp on the Long side. If you have a lot of money, you can go straight away; if not, you can join swing traders and carry out the robbery plan. Use trailing SL to safeguard your money 💰.
US30/DJI "Dow Jones" Index CFD Market Heist Plan (Swing/Day) is currently experiencing a bullishness,., driven by several key factors.
📰🗞️Get & Read the Fundamental, Macro, COT Report, Geopolitical and News Analysis, Sentimental Outlook, Intermarket Analysis, Index-Specific Analysis, Positioning and future trend targets.. go ahead to check 👉👉👉
📌Keep in mind that these factors can change rapidly, and it's essential to stay up-to-date with market developments and adjust your analysis accordingly.
⚠️Trading Alert : News Releases and Position Management 📰 🗞️ 🚫🚏
As a reminder, news releases can have a significant impact on market prices and volatility. To minimize potential losses and protect your running positions,
we recommend the following:
Avoid taking new trades during news releases
Use trailing stop-loss orders to protect your running positions and lock in profits
💖Supporting our robbery plan 💥Hit the Boost Button💥 will enable us to effortlessly make and steal money 💰💵. Boost the strength of our robbery team. Every day in this market make money with ease by using the Thief Trading Style.🏆💪🤝❤️🎉🚀
I'll see you soon with another heist plan, so stay tuned 🤑🐱👤🤗🤩

"US30 / DJI" Indices Market Bearish Heist Plan🌟Hi! Hola! Ola! Bonjour! Hallo!🌟
Dear Money Makers & Robbers, 🤑 💰🐱👤🐱🏍
Based on 🔥Thief Trading style technical and fundamental analysis🔥, here is our master plan to heist the "US30 / DJI" Indices Market. Please adhere to the strategy I've outlined in the chart, which emphasizes short entry. Our aim is the high-risk Green Zone. Risky level, oversold market, consolidation, trend reversal, trap at the level where traders and bullish thieves are getting stronger. 🏆💸Book Profits Be wealthy and safe trade.💪🏆🎉
Entry 📈 : "The vault is wide open! Swipe the Bearish loot at any price - the heist is on!
however I advise placing Sell limit orders within a 15 or 30 minute timeframe. Entry from the most recent or closest low or high level should be in retest.
Stop Loss 🛑: Thief SL placed at (44200) swing Trade Basis Using the 4H period, the recent / swing high or low level.
SL is based on your risk of the trade, lot size and how many multiple orders you have to take.
Target 🎯: 42200 (or) Escape Before the Target
🧲Scalpers, take note 👀 : only scalp on the Short side. If you have a lot of money, you can go straight away; if not, you can join swing traders and carry out the robbery plan. Use trailing SL to safeguard your money 💰.
📰🗞️Fundamental, Macro, COT, Sentimental Outlook:
"US30 / DJI" Indices Market is currently experiencing a Bearish trend., driven by several key factors.
🟣Fundamental Analysis
Earnings: Q4 2024 EPS growth strong (e.g., 16.9% for S&P 500 proxies)—bullish, but US30 firms face tariff uncertainty.
Rates: Fed at 3-3.5%, no cuts signaled—real yields ~1% (10-year Treasury 3.8%) pressure equities—bearish.
Inflation: PCE 2.6% (Jan 2025)—persistent inflation supports Fed stance, bearish for stocks.
Growth: U.S. consumer spending wanes (Schwab)—mixed, neutral impact.
Geopolitics: Trump tariffs (25% Mexico/Canada, 10% China)—short-term volatility, long-term bullish for U.S. firms.
🟤Macro Economics
Federal Reserve Policy: The Federal Reserve has been raising interest rates to combat inflation, which has led to a strengthening of the US dollar.
US Economy: The US economy has been showing signs of slowing down, with GDP growth rates decreasing.
Global Economy: The global economy has been experiencing a slowdown, with many countries experiencing recession.
⚪Commitments of Traders (COT) Data
Speculators: Net long ~55,000 contracts (down from 65,000)—cooling bullishness.
Hedgers: Net short ~60,000—stable, locking in gains.
Open Interest: ~125,000 contracts—steady global interest, neutral.
🔴Market Sentimental Analysis
Bullish Sentiment: Some analysts believe that the US30 will break above the resistance at 45,000 and continue rising.
Bearish Sentiment: Many investors expect a correction, with a potential target of 42200.
Risk Aversion: The market is experiencing risk aversion, with investors seeking safe-haven assets.
🔵Positioning Analysis
Long Positions: Some investors are holding long positions in US30, expecting a breakout above 45,000.
Short Positions: Many investors are holding short positions in US30, expecting a correction.
🟠Quantitative Analysis
Technical Indicators: The 14-day Relative Strength Index (RSI) is at 45, indicating a neutral sentiment.
Moving Averages: The 21-day Simple Moving Average (SMA) is at 44,404, providing resistance for US30 prices.
🟡Intermarket Analysis
DXY: 106.00—USD softness aids equities—bullish.
XAU/USD: 2910—gold rise signals risk-off, bearish for US30.
NDX: ~20,000, tech softening—correlated pressure on US30—bearish.
Bonds: U.S. 10-year 3.8%—yield stability neutral.
🟢News and Events Analysis
Federal Reserve Meeting: The Federal Reserve is scheduled to meet on March 15-16, with investors expecting a potential rate hike.
US Economic Data: The US economic data, including the Non-Farm Payrolls report, is being closely watched for its impact on US30 prices.
🟣Next Trend Move
Bullish Trend: Some analysts believe that the US30 will break above the resistance at 45,000 and continue rising.
Bearish Trend: Many investors expect a correction, with a potential target of 42,200.
🔴Overall Summary Outlook
Bullish Outlook: Some analysts believe that the US30 will break above the resistance at 45,000 and continue rising.
Bearish Outlook: Many investors expect a correction, with a potential target of 42,200.
📌Keep in mind that these factors can change rapidly, and it's essential to stay up-to-date with market developments and adjust your analysis accordingly.
⚠️Trading Alert : News Releases and Position Management 📰 🗞️ 🚫🚏
As a reminder, news releases can have a significant impact on market prices and volatility. To minimize potential losses and protect your running positions,
we recommend the following:
Avoid taking new trades during news releases
Use trailing stop-loss orders to protect your running positions and lock in profits
💖Supporting our robbery plan 💥Hit the Boost Button💥 will enable us to effortlessly make and steal money 💰💵. Boost the strength of our robbery team. Every day in this market make money with ease by using the Thief Trading Style.🏆💪🤝❤️🎉🚀
I'll see you soon with another heist plan, so stay tuned 🤑🐱👤🤗🤩

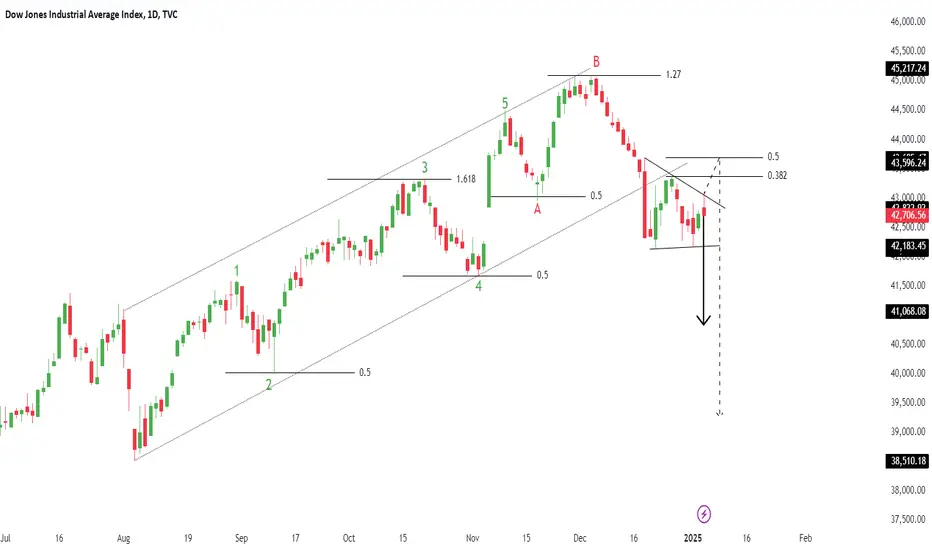
DJIDJI - Dow Jones Index
Break of Structure
Symmetrical Triangle as an Corrective Pattern in Short Time Frame
Demand Zone
Fibonacci Level - 38.20% / 50.00%
Completed " 12345 " Impulsive Waves and " AB " Corrective Waves
Dow Jones Industrial (DJI) Short Trade: TP1 DoneThe DJI (15-minute timeframe) chart presents a well-executed short trade setup, delivering substantial initial profits and paving the way for the remaining targets to be achieved.
Key Trade Insights:
Entry Point: Positioned at 44,159.10, as identified by the bearish crossover and resistance from the downward EMA.
Stop Loss: Strategically placed at 44,322.02 to safeguard against upward reversals.
Targets:
TP1: 43,957.73 ✅ Achieved
TP2: 43,631.88
TP3: 43,306.04
TP4: 43,104.67
Technical Breakdown:
Bearish EMA Structure: The red EMA ribbon suggests sustained downward pressure, reinforcing the bearish sentiment.
Volume Confirmation: Declining upward retracements signify reduced buying momentum, increasing the likelihood of hitting deeper targets.
Trade Outlook:
With TP1 secured, market momentum and bearish patterns strongly favor hitting TP2 and beyond. Traders using the Risological Indicator are positioned to capitalize further on this move.
Stay vigilant and let the profits roll in!

Dow JonesDJI - Dow Jones
Completed " 12345 " Impulsive Waves. Bullish Channel as an corrective pattern in short time frame and rejection from Upper Trend Line at Fibonacci Level - 261.8%. Strong Divergence with Break of Structure

US30 / DJ30 / DJI Market Money Heist Plan on Bullish SideHola ola My Dear,
Robbers / Money Makers & Losers,
This is our master plan to Heist US30 / DJ30 / DJI Market based on Thief Trading style Technical Analysis.. kindly please follow the plan I have mentioned in the chart focus on Long entry. Our target is Red Zone that is High risk Dangerous level, market is overbought / Consolidation / Trend Reversal at the level Bearish Robbers / Traders gain the strength. Be safe and be careful and Be rich.
Attention for Scalpers : If you've got a lot of money you can get out right away otherwise you can join with a swing trade robbers and continue the heist plan, Use Trailing SL to protect our money.
Note: If you've got a lot of money you can get out right away otherwise you can join with a swing trade robbers and continue the heist plan, Use Trailing SL to protect our money.
Entry : Can be taken Anywhere, What I suggest you to Place Buy Limit Orders in 15mins Timeframe Recent / Nearest Swing Low
Stop Loss : Recent Swing Low using 30m timeframe
Warning : Fundamental Analysis comes against our robbery plan. our plan will be ruined smash the Stop Loss. Don't Enter the market at the news update.
Loot and escape on the target 🎯 Swing Traders Plz Book the partial sum of money and wait for next breakout of dynamic level / Order block, Once it is cleared we can continue our heist plan to next new target.
Support our Robbery plan we can easily make money & take money 💰💵 Follow, Like & Share with your friends and Lovers. Make our Robbery Team Very Strong Join Ur hands with US. Loot Everything in this market everyday make money easily with Thief Trading Style.

US30 / DJ30 / DJI Market Money Heist Plan on Bullish SideMy Dear Robbers / Money Makers & Newbies,
This is our master plan to Heist US30 / DJ30 / DJI Market based on Thief Trading style Technical Analysis.. kindly please follow the plan I have mentioned in the chart focus on Long entry. Our target is Red Zone that is High risk Dangerous level, market is overbought / Consolidation / Trend Reversal at the level Bearish Robbers / Traders gain the strength. Be safe and be careful and Be rich.
Note: If you've got a lot of money you can get out right away otherwise you can join with a swing trade robbers and continue the heist plan, Use Trailing SL to protect our money.
Entry : Can be taken Anywhere, What I suggest you to Place Buy Limit Orders in 15mins Timeframe Recent / Nearest Swing Low
Stop Loss : Recent Swing Low using 2h timeframe
Warning : Fundamental Analysis comes against our robbery plan. our plan will be ruined smash the Stop Loss. Don't Enter the market at the news update.
Loot and escape on the target 🎯 Swing Traders Plz Book the partial sum of money and wait for next breakout of dynamic level / Order block, Once it is cleared we can continue our heist plan to next new target.
Support our Robbery plan we can easily make money & take money 💰💵 Follow, Like & Share with your friends and Lovers. Make our Robbery Team Very Strong Join Ur hands with US. Loot Everything in this market everyday make money easily with Thief Trading Style.

US30 Market breadth EMA200 [IAS]Introducing our Market Breadth Indicator, specifically designed for traders looking to gain a deeper understanding of the overall health of the Dow Jones Industrial Average (DJIA). This indicator tracks how many of the 30 Dow Jones stocks are trading above their 200-day Exponential Moving Average (EMA), giving you a quick snapshot of market momentum.
Traders typically use market breadth indicators to assess whether the market is broadly strong or weak. When more stocks are trading above their 200-day EMA, it suggests a healthy, bullish environment. Conversely, fewer stocks above this threshold could indicate a weakening market or a potential downturn. Our indicator takes this concept and visualizes it in an easy-to-read histogram, ranging from 0 to 30, where 0 represents no stocks above the 200-day EMA and 30 represents all stocks above this key level.
🔶Usage
Using the Indicator in your trading is straightforward, you can simply implement it by looking for:
1. Bullish Signals: When there are higher number of stocks highlighted in red (e.g., 25-30) trading above their 200-day EMA, it’s a strong signal that the market is in a robust uptrend.
2. Bearish Signals: When the histogram starts declining towards the lower end (e.g., 0-10, where below 6 is highlighted in green). This can be use as a warning sign that the market might be entering a bearish phase.
3. Confirming Trends: The indicator is also useful for confirming trends. For example, if the overall market is rallying but the histogram is showing a decline in stocks above the 200-day EMA, it could be a sign of underlying weakness. This divergence can alert you to potential trend reversals.
This indicator is versatile and can be adapted to various trading styles, whether you’re an intraday trader, or a longer-term investor.
Intraday Trading:
For intraday traders, this tool can be use to find short-term lows or peaks. As the histogram rises above the green zone in the session it may indicate increasing buying pressure, suggesting opportunities for quick long positions from the low. Conversely, if the histogram declines from a red zone, it could be a signal to explore short setups. Using this indicator alongside your usual intraday strategies can help you fine-tune your entries and exits, reducing risk and enhancing your trading precision.
Longer-Term Trading:
For longer-term investors or those looking to position trade on a weekly basis, Market Breadth is an excellent tool to assess the overall health of the market. A histogram consistently near its upper range (e.g., 25-30) over several weeks signals a strong, sustained uptrend, making it a good time to add to positions or initiate new ones. On the other hand, a gradual decline in the histogram over time may indicate that the market is weakening, suggesting a more cautious approach, such as rebalancing your portfolio or exploring defensive strategies. This longer-term perspective can help you stay aligned with the broader market trend, reducing the risk of being caught on the wrong side of a major market move.
By using the indicator across different timeframes, you can better align your trading strategy or even plan your risk management with the underlying market conditions, making more informed decisions whether you’re trading by the minute or planning for the months ahead.
