Is US30 Setting Up a Major Bullish Reversal? Layer Plan Inside🚀 US30 BULLISH SWING LAYER STRATEGY | "The Thief" Entries 🚀
BROTHERS & SISTERS OF THE MARKET! 👋 Welcome back, Thief OG's! 🦸♂️🦸♀️ A powerful Bullish setup is forming on the US30 (DOW JONES), and I'm sharing my layered entry plan to strategically position for the next leg up.
📈 Asset: US30 (Dow Jones Industrial Average)
⚡ Bias: Bullish | Style: Swing Trade
🎯 The Strategic Plan (The "Thief" Method)
This isn't a gamble; it's a calculated siege. We use a "Thief" Layering Strategy to scale into the position, reducing average entry cost and managing risk. We don't chase price; we let price come to us!
⚔️ Trade Execution Details
✅ ENTRIES (Buy Limit Layers):
We are setting multiple buy orders at key support levels. This is the core of the "Thief" method:
▶️ Layer 1: 46,400
▶️ Layer 2: 46,600
▶️ Layer 3: 46,800
▶️ Layer 4: 47,000
💡 Pro Tip: You can INCREASE or ADJUST these layers based on your capital and risk appetite.
❌ STOP LOSS (RISK MANAGEMENT):
A consolidated stop loss is placed below a major support zone to protect our capital.
➡️ SL: 46,200 (or lower based on your personal risk tolerance)
⚠️ Disclaimer (PLEASE READ): I am NOT a financial advisor. This SL is a suggestion. You MUST adjust your Stop Loss based on your own risk management strategy. Protect your capital at all costs!
🎯 PROFIT TARGET:
We are targeting a significant resistance zone where the market might see a pullback.
🎯 TP: 48,800
Rationale: This area aligns with a confluence of factors including Moving Average resistance and a potential overbought trap. The goal is to "escape with profits" before a potential reversal.
🤑 Take Note: You are free to take profits earlier! If you're in profit, you can never be wrong for taking money off the table.
🔍 Market Analysis & Key Drivers
Bullish Structure: The overall trend structure on higher timeframes remains intact.
Layered Advantage: This strategy smooths out the entry, preventing a single, potentially poor, entry point.
Risk Defined: Our maximum risk is clearly defined from the start.
🌐 Related Pairs & Correlations to Watch
Diversify your view! The US30 doesn't move in a vacuum. Keep these key assets on your watchlist:
SP:SPX (S&P 500): 🟢 High Positive Correlation. The SPX is the broader market leader. A strong SPX often pulls the DOW higher. This is your #1 confirmation.
NASDAQ:NDX (Nasdaq 100): 🟢 Positive Correlation. Tech strength can fuel overall market sentiment, but watch for divergence.
TVC:DXY (US Dollar Index): 🔴 Generally Inverse Correlation. A strengthening dollar can be a headwind for US equities. If DXY rallies sharply, be cautious.
/ES (S&P 500 Futures): 🟢 High Positive Correlation. Tracks the SPX almost tick-for-tick. Great for real-time sentiment.
✅ Conclusion
This "Thief" layered strategy provides a disciplined, low-stress approach to catching a potential US30 upswing. Remember, the market is about probabilities, not certainties.
👑 Your Capital, Your Rules. Trade Safe!
📌 Hashtags for Maximum Visibility:
#TradingView #US30 #DOW #TradingStrategy #SwingTrading #Stocks #Investing #Finance #Bullish #LayerStrategy #RiskManagement #ThiefStrategy #MarketAnalysis #SPX #DXY
👉 LIKE & FOLLOW if you found this idea helpful! Your support keeps the research coming! 💪
Djiaprediction
Stocks Fall Pre-Bell as Traders Await Fed Meeting MinutesUS stock futures were mostly steady overnight Monday as Wall Street looked to regroup after a tech-led slide to begin the final stretch of 2025.
Futures tied to the Dow Jones Industrial Average futures (YM=F), the S&P 500 (ES=F), and the tech-heavy Nasdaq (NQ=F) all hovered around the flatline.
The major Wall Street indexes fell modestly Monday, as Nvidia (NVDA) and Tesla (TSLA) led megacaps lower amid a small rotation out of tech stocks. Traders are reassessing — and perhaps taking profits before the end of the year.
Tuesday brings the release of the minutes from the Federal Reserve's December meeting, at which it cut interest rates for a third straight time but signaled it may pause those cuts in the months ahead. The minutes will serve as one of the final potential market-moving catalysts of 2025, with only a reading on weekly initial jobless claims — on Wednesday morning — remaining on the calendar before the new year.
The central bank's meeting readout could add fresh insight for investors looking for clues on the Fed's next move in January, with the divisions that have gripped the central bank in 2025 likely to continue into the new year. Around 84% of bets are on the Fed standing pat at current interest rate levels next month, though traders about equally split on what the committee will do in March.
The Dow Jones (DJI) is down 0.51% moving in a bearish symmetrical triangle pattern. If the stocks keep tanking the DJI index will be approaching the $40k zone. With the RSI at 58, there are high chances that DJ:DJI might consolidate and go dipper to the $40k zone.

Dow Jones -> A breakout rally of +40%!🐂Dow Jones ( TVC:DJI ) will create new highs:
🔎Analysis summary:
Since the April lows, the Dow Jones already rallied about +25%. This was simply the expected rejection away from a strong confluence of support. Now, the Dow Jones is sitting at the previous all time highs and about to break out, leading to a massive rally.
📝Levels to watch:
$45.000, $60.000
🙏🏻#LONGTERMVISION
Philip - Swing Trader

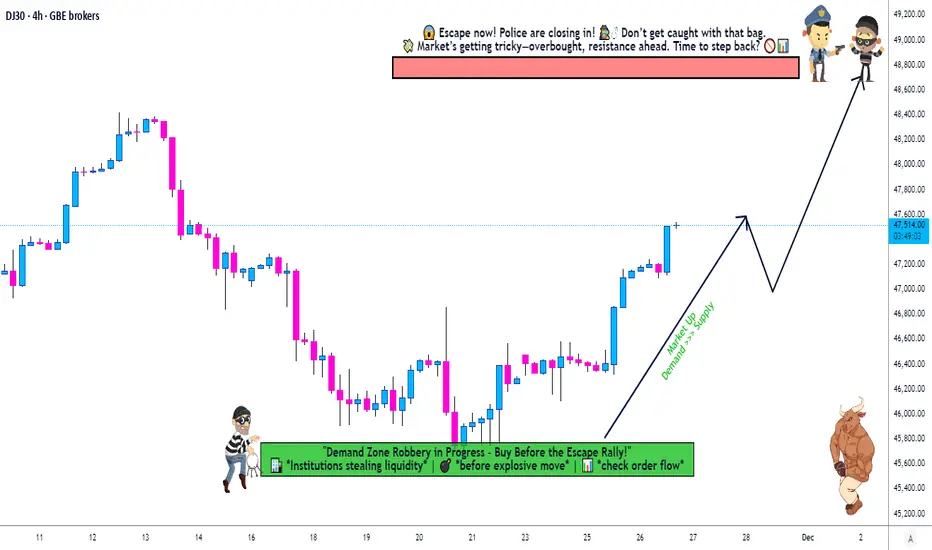
"US30/DJI" Index Market Bullish Robbery (Swing Trade Plan)🌟Hi! Hola! Ola! Bonjour! Hallo! Marhaba!🌟
Dear Money Makers & Robbers, 🤑 💰💸✈️
Based on 🔥Thief Trading style technical and fundamental analysis🔥, here is our master plan to heist the "US30/DJI" Index Market Heist. Please adhere to the strategy I've outlined in the chart, which emphasizes long entry. Our aim is to escape near the high-risk YELLOW MA Zone. It's a Risky level, overbought market, consolidation, trend reversal, trap at the level where traders and bearish robbers are stronger. 🏆💸"Take profit and treat yourself, traders. You deserve it!💪🏆🎉
Entry 📈 : "The vault is wide open! Swipe the Bullish loot at any price - the heist is on!
however I advise to Place buy limit orders within a 15 or 30 minute timeframe most recent or swing, low or high level. I Highly recommended you to put alert in your chart.
Stop Loss 🛑:
Thief SL placed at the Nearest / Swing low level Using the 3H timeframe (39200) Day/Swing trade basis.
SL is based on your risk of the trade, lot size and how many multiple orders you have to take.
🏴☠️Target 🎯: 42400
💰💵💸"US30/DJI" Index Money Heist Plan is currently experiencing a bullishness,., driven by several key factors. .☝☝☝
📰🗞️Get & Read the Fundamental, Macro Economics, COT Report, Geopolitical and News Analysis, Sentimental Outlook, Intermarket Analysis, Index-Specific Analysis, Future trend targets with Overall outlook score... go ahead to check 👉👉👉🔗🔗🌎🌏🗺
⚠️Trading Alert : News Releases and Position Management 📰🗞️🚫🚏
As a reminder, news releases can have a significant impact on market prices and volatility. To minimize potential losses and protect your running positions,
we recommend the following:
Avoid taking new trades during news releases
Use trailing stop-loss orders to protect your running positions and lock in profits
💖Supporting our robbery plan 💥Hit the Boost Button💥 will enable us to effortlessly make and steal money 💰💵. Boost the strength of our robbery team. Every day in this market make money with ease by using the Thief Trading Style.🏆💪🤝❤️🎉🚀
I'll see you soon with another heist plan, so stay tuned 🤑🐱👤🤗🤩

Just In: The Dow Jones Industrial Average (DJI) Dip 1,300 PointsOverview
The Dow Jones Industrial Average, also known as the DJIA or simply the Dow, is a market index frequently used to gauge the overall performance of the U.S. stock market. Indexes like the DJIA track the prices of a group of securities.
The Consumer index saw a downtick of 1300 points representing a 5.5% dip. This was days after Donald Trump declared a new set of tariffs targeting 185 countries, including major U.S. trading allies.
Tariffs Concern
The US stocks are poised to continue their bloodbath as futures signaled more fear over President Donald Trump's tariffs. Administration officials and Trump himself signaled on Sunday that they won't back down from their aggressive decisions. Meanwhile, an inflation report is due later this week as well as bank earnings.
Wall Street remained in fear mode over President Donald Trump's tariffs on Sunday evening as futures pointed to more steep losses.
The S&P 500 futures also sank 3.9% and Nasdaq futures dived 4.9%. That follows a devastating week that saw the worst selloff since the early days of the COVID-19 pandemic.
Similarly, the 10-year Treasury yield dropped 8.5 basis points to 3.906%, and US crude oil prices fell 3.7% to $59.72 a barrel.
Countries affected by the tariff rates are:
China (34%), the European Union (20%), and Japan (24%). Fitch Ratings estimated that the effective tariff rate could hit 25% on average — the highest in more than 115 years.
In an X post on Sunday, Former Treasury Secretary Larry Summers cautioned, saying there's a very good chance of more market turbulence similar to what was seen on Thursday and Friday.
Those sessions represented the fourth largest two-day drop in the last 85 years, Summer said. The selloff wiped out about $6 trillion in market cap.
“A drop of this magnitude signals that there’s likely to be trouble ahead, and people ought to be very cautious,” Summers wrote.
Meanwhile, Trump administration and the president himself defended the tariffs.
Technical Outlook
as of the time of writing, the The Dow Jones Industrial Average (DJI) Dip index point is down 5.5% trading in tandem with the support point that aligns with the 38,000 points. On a bearish case scenario, a break below this axis could be canning for the stock market as it will lead to panic selling in the industries concerned.
Similarly, should the bulls manage to thrust the DJI points up to the 42,000 points, we should experience a respite from the bears and possibly increased momentum might sent the stocks soaring higher. With the RSI at 23, this is hinting to a weak momentum with more downside ahead.

Dow Jones Testing Key Support – Bounce or Crash Ahead?The Dow Jones Industrial Average (DJIA) is currently testing a key rising trendline support, which has been a strong foundation for its uptrend since 2023. Holding this level could signal a continuation of the bullish momentum, while a breakdown may lead to a deeper correction. If the price fails to hold above this trendline, the next significant support lies around 41,000-40,000, a zone that previously acted as resistance and is now a psychological support level. In case of further weakness, the long-term trendline support around 38,000-39,000 could come into play, aligning with the Ichimoku cloud support.
For the bullish scenario to remain valid, DJIA needs to sustain above the rising trendline and reclaim recent highs. However, if sellers gain control and push prices lower, a broader pullback could unfold. Overall, the market remains in an uptrend as long as key support levels hold, but price action in the coming weeks will determine whether the index continues upward or undergoes a deeper correction.
Do like, comment and follow

DJI - 1590 Points and Running!This is a long trade setup on the Dow Jones Industrial Average (DJI) on the 15-minute timeframe. The trade was initiated on January 14th, 2025, and has shown a significant upward move since then. As of today, the position is currently sitting at a substantial profit of 1590 points.
Trade Confirmation Rules:
The Risological Dotted Trend Line turned green, indicating a bullish trend or a change in trend direction.
The Risological Options Trading Indicator turned green with a bullish crossover, suggesting favorable conditions for long options positions.

DJI a FAILED 5th Wave and right shoulder Head n shoulder TOP The chart now can be seen as A 5th wave Failure . as we have entered the 6 spiral window. the last 5 /6 spirals called the TOP to the day major turn 11/29 to 12/5 in the dji it was 11/29 and the MATH was near perfect . Now what ?? the drop in my view was wave 4 of the Supercycle peak . since then cycles turned up and the 5th wave started . based on the 80 day cycle due mid dec . so why am I calling this a Failed 5th wave reason is the last low was one of the longest days down in US history and breaking the long term trendline support The High Hit the trendline at the peak going back to the sept 2nd 1929 high . The fact that the sp 500 is now the only index to print a new record high is a warning . I started to move into puts on friday jan 17th and moved to a 110 % long puts today at 6100 in the spx cash and 533 in the QQQ , The market can still trace out a small 4 nad 5 and 4.5 and the DJI could still print a minor new High but today and this week are a grouping of 6 spirals Golden ratio . the DJI has only rallied to almost .786 the drop 44370 target I started buying puts at 43800. 2025 is a very bearish cycle see my forecast DEC 8th 2024 . Best of trades WAVETIMER

DJI - ACCURATE TREND CAUGHTDow Jones Industrial (DJI) Accurate Trend Caught Using Risological Options Trading Indicator .
After a one sided 1100 points (SHORT side)
We are now seeing a Bullish reversal in the market, with 350+ points open P&L so far, and running.
The past two weeks have been painful for many traders and investors worldwide.
Share your personal experiences below.
All the best.

DJI Short Trade Nets $2100 Dip: A 4.7% Market Move!Dow Jones Industrial (DJI): $2100 Drop Captured
On December 11, 2024, the Risological Options Trading Indicator provided a clear signal to initiate a short trade on the Dow Jones Industrial (DJI). This trade capitalized on a significant bearish move, capturing an impressive $2100 dip, equating to a massive 4.7% decline from the entry point.
The trade was identified using the Risological Options Trading Indicator, which accurately captured the strong bearish momentum. The red overlay in the histogram confirms increasing selling pressure, coinciding with the downward trajectory.
This setup highlights how the Risological Options Trading Indicator leverages market structure to pinpoint high-probability trades. The captured $2100 move reinforces its precision in navigating even the most volatile markets.
All the best!
Namaste.

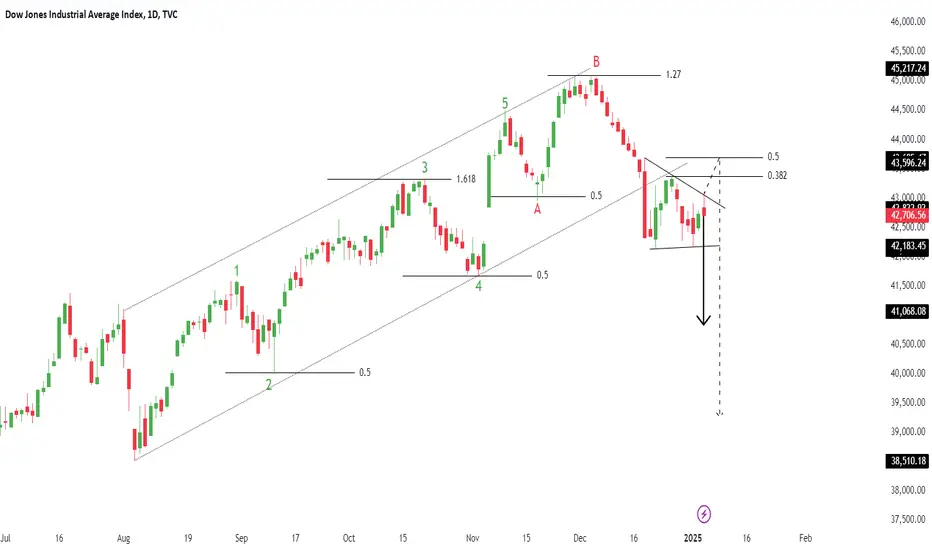
DJIDJI - Dow Jones Index
Break of Structure
Symmetrical Triangle as an Corrective Pattern in Short Time Frame
Demand Zone
Fibonacci Level - 38.20% / 50.00%
Completed " 12345 " Impulsive Waves and " AB " Corrective Waves
Dow Jones Industrial (DJI): SHORT TRADETrade Overview:
The Dow Jones Industrial (DJI) chart presents a strong short trade setup on the 1-hour timeframe. Using the Risological Swing Trading Indicator , this trade successfully achieved TP1 (43,779.69) through TP3 (42,180.27), with TP4 (41,686.05) remaining highly probable based on prevailing market trends.
Key Levels:
Entry Price: 44,273.91
Stop Loss (SL): 44,673.77
Take Profits:
TP1: 43,779.69
TP2: 42,979.98
TP3: 42,180.27
TP4: 41,686.05
Market Sentiment:
The trade reflects bearish momentum, supported by broader market conditions indicating reduced risk appetite. The Dow Jones continues to exhibit a descending trendline and weaker market confidence.
The Risological Indicator identified precise entry, stop loss, and take-profit levels, enabling a disciplined and profitable trade execution. With three targets already achieved, the setup remains poised to capture further downside momentum.

DOW JOENS 1469 Points Secured on Risological BUY SELL IndicatorDow Jones Industrial (DJI) on a 15-minute timeframe captured significant profitable movements using the " Risological BUY SELL Indicator ". The tool effectively identified both bullish and bearish entries, allowing traders to secure impressive gains.
Highlights of Captured Trades:
584 Points captured in a downward move.
244 Points secured in a bullish retracement.
331 Points caught during a short trade.
310 Points profited in the final bullish rally.
The Risological BUY SELL Indicator demonstrated precision in marking key entry and exit points for high-confidence trading decisions.
Comment " FREE Trial " to get 7 days unlimited FREE trial of this indicator.

Dow Jones Industrial (DJI) Short Trade: TP1 DoneThe DJI (15-minute timeframe) chart presents a well-executed short trade setup, delivering substantial initial profits and paving the way for the remaining targets to be achieved.
Key Trade Insights:
Entry Point: Positioned at 44,159.10, as identified by the bearish crossover and resistance from the downward EMA.
Stop Loss: Strategically placed at 44,322.02 to safeguard against upward reversals.
Targets:
TP1: 43,957.73 ✅ Achieved
TP2: 43,631.88
TP3: 43,306.04
TP4: 43,104.67
Technical Breakdown:
Bearish EMA Structure: The red EMA ribbon suggests sustained downward pressure, reinforcing the bearish sentiment.
Volume Confirmation: Declining upward retracements signify reduced buying momentum, increasing the likelihood of hitting deeper targets.
Trade Outlook:
With TP1 secured, market momentum and bearish patterns strongly favor hitting TP2 and beyond. Traders using the Risological Indicator are positioned to capitalize further on this move.
Stay vigilant and let the profits roll in!

Dow JonesDJI - Dow Jones
Completed " 12345 " Impulsive Waves. Bullish Channel as an corrective pattern in short time frame and rejection from Upper Trend Line at Fibonacci Level - 261.8%. Strong Divergence with Break of Structure

Dow Jones (DJI) Primed for a Bullish Move – Fresh Long Entry!DOW JONES INDUSTRIAL (DJI) Technical Analysis:
In the 15-minute timeframe, Dow Jones Industrial (DJI) has signaled a fresh long trade entry at 42,406.00 with potential upside movement, supported by the break above the Risological dotted trendline.
Key Levels:
Entry: 42,406.00
Stop Loss (SL): 42,294.50
Target 1 (TP1): 42,543.81
Target 2 (TP2): 42,766.81
Target 3 (TP3): 42,989.81
Target 4 (TP4): 43,127.63
Observations:
The price has gained bullish momentum, with a clean break above the Risological trendline.
If momentum sustains, this trade could see all targets successfully hit.
A solid long trade entry is in play for DJI, with upside potential. The Risological dotted trendline serves as strong support, and if buyers maintain control, higher targets are likely to be reached.

DOW JONES (DJI) Slides Through TP1 & TP2! Eyes Set on TP3 & TP4!Technical Analysis:
On the 15-minute timeframe, the Dow Jones (DJI) short trade has already successfully hit TP1 and TP2, confirming strong downward momentum. Price continues to trade below the Risological dotted trendline, suggesting that the bearish trend is likely to continue.
Key Levels:
Entry: 42,997.92
Stop Loss (SL): 43,161.50
Target 1 (TP1): 42,795.74 (Done)
Target 2 (TP2): 42,468.58 (Done)
Target 3 (TP3): 42,141.42 (Pending)
Target 4 (TP4): 41,939.24 (Pending)
Observations:
After breaking below the Risological dotted trendline, the Dow Jones showed significant selling pressure.
Price continues to respect the downward trendline, supporting the case for further declines toward the remaining targets.
With TP1 and TP2 already hit, the Dow Jones looks primed to move towards TP3 and TP4. Traders should continue to monitor the bearish momentum as the setup points toward more downside potential.

DJI- Correction to 40k zone?Since mid-September, the Dow Jones Industrial Average ( TVC:DJI ) has resumed its upward trend, reaching new all-time highs.
This recent rally reflects investor optimism and strong market momentum.
However, despite this bullish movement, the rise appears to be contained within a rising wedge pattern, which can often indicate a potential reversal or the weakening of an uptrend.
For traders and investors, a key confirmation of this potential correction would be a decisive drop below the 42,500-42,700 support zone. If the Dow30 breaks below this critical level, it could trigger a larger sell-off, possibly pushing the index down toward the 40,000 level—a significant psychological and technical support zone.
While it’s still too early to confirm whether this correction will take place, it’s important to keep an eye on the price action around the 42,500-42,700 range.
If the index fails to hold this zone, it could mark the end of the recent uptrend and the start of a broader market pullback.
In summary, while the Dow30 has been reaching new heights, caution is warranted due to the rising wedge pattern and key support levels.
If these signals confirm a correction, we may see the index retracing toward 40,000 in the near future.

Dow Jones Hits All Targets! Bullish Surge CompletesThe Dow Jones has demonstrated a strong bullish trend, with the long trade reaching and completing all profit targets.
Key Levels
Entry: 42078.17 – The long position was entered as the price broke above this level, confirming bullish sentiment.
Stop-Loss (SL): 41954.95 – Positioned below recent support to manage risk in case of a pullback.
Take Profit 1 (TP1): 42230.47 – The first target was achieved, confirming the continuation of the upward trend.
Take Profit 2 (TP2): 42476.91 – The second target was hit as the bullish momentum continued.
Take Profit 3 (TP3): 42723.35 – Momentum carried the price to the third target.
Take Profit 4 (TP4): 42875.65 – The final profit target was reached, signaling a strong rally.
Trend Analysis
The price is comfortably trading above the Risological Dotted trendline, confirming the strength of the bullish momentum. With all targets hit, the trend continues to reflect a strong upward movement, supported by positive market sentiment.
The long trade on the Dow Jones successfully hit all profit targets, with the final TP4 at 42875.65 marking the end of a highly profitable trade. Strong support from the Risological Dotted trendline and continuous upward momentum suggest that the market is favoring bulls in this period.

Dow JonesPair : DJI - Dow Jones
Description :
Completed " 12345 " Impulsive Waves
Break of Structure
CHOCH
RSI - Divergence
Bullish Channel as an Corrective Pattern in Short Time Frame
Order Block

DJI Collapse Imminent | Caution All AssetsThis is how we hold the finance sector accountable.
Caution in all assets.
The world economy is grinding to a stand-still.
This selloff will be deep and obviously very painful.
There are a ton of hype stories and narratives out there - I have covered and poked fun at many of the ridiculous narratives in previous posts.
We knew this day would come.

INTEL SHORT TRADE : 22% Gain - All Profits Done and Dusted!INTEL SHORT TRADE
Short entry at: 34.74
Stoploss: 35.95
Profit targets:
TP1: 33.24
TP2: 30.81
TP3: 28.39
TP4: 26.89
All targets done - INTEL!
Please follow for more analysis, tips and trade setups.

DJI Pair : DJI - Dow Jones
Description :
Completed " 1234 " Impulsive Waves
Break of Structure
RSI - Divergence
Exp FIAT as an Corrective Pattern in Short Time Frame
Fibonacci Level - 38.20%
