Dogecoin (DOGE) Market Update & Catalysts: Ready for 50 cents?🚀 Dogecoin (DOGE) Market Update & Catalysts
🐋 Whale Accumulation & Trading Activity
Large players (“whales”) have been steadily absorbing DOGE, fueling upward momentum. Recent market structure shows that bulls defended the $0.22 zone, while primary support and reload range sits at $0.15–$0.16 — the bottom of the accumulation range. A breakout above $0.25 could spark a run toward $0.40, especially if short positions get squeezed.
🏦 ETF Prospects & Institutional Tailwinds
Optimism is building around a potential Dogecoin Spot ETF, with growing speculation that approval could arrive in the next cycle. An ETF would open the doors for institutional capital, mirroring what happened with Bitcoin’s rally.
🔗 Expanding Utility (DogeOS & DeFi)
The development of DogeOS, which allows DOGE to interact with Ethereum DeFi ecosystems, could give the coin a major utility boost beyond its meme status. This evolution may help sustain higher valuations long-term.
📈 Technical Signals & Price Forecasts
Chart patterns are turning favorable:
Golden cross (50-day MA crossing the 200-day) shows momentum strength.
Oversold RSI signals suggest a potential reversal upward.
If support at $0.15–$0.16 holds and bulls reclaim $0.25, upside targets expand to $0.34–$0.40.
🔮 Bullish Scenarios & Analyst Sentiment
Mid-term projections highlight possible price zones:
Conservative path: $0.30–$0.33 into 2025.
Aggressive path: Retesting all-time highs near $1 if institutional demand + ETF + DeFi traction align.
🌟 Key Positive Catalysts
🔑 Catalyst 🚀 Impact
🐋 Whale absorption & accumulation Strengthens base; short squeezes possible.
🏦 Spot ETF approval potential Brings institutional demand.
📊 Technical bullish patterns Golden cross + RSI suggest uptrend.
🔗 DogeOS & DeFi integration Expands DOGE’s real-world use cases.
💬 Strong community + hype Keeps DOGE in the spotlight.
✅ Summary
Dogecoin is holding its accumulation base at $0.15–$0.16, with strong whale support and growing catalysts like ETFs and DeFi integration. If bulls can reclaim the $0.25–$0.26 zone, momentum could build toward $0.40 in the mid-term — with long-term upside scenarios eyeing $1+ if institutional and utility drivers align.
Doge

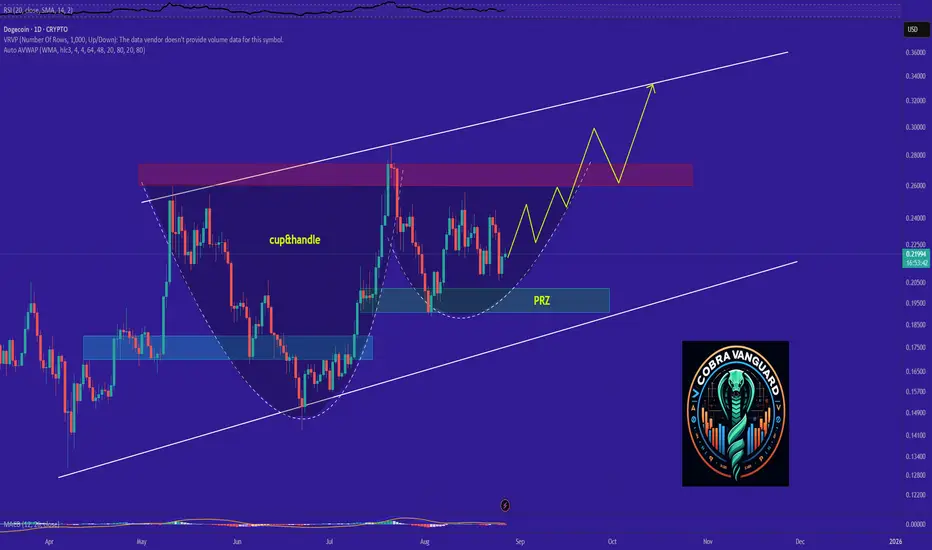
DOGE's Situation, A Comprehensive Analysis !!!It appears that the price is forming a cup and handle pattern, and if this occurs, it could push the price above $0.50.
PREVIOUS ANALYSIS
Best regards CobraVanguard.💚

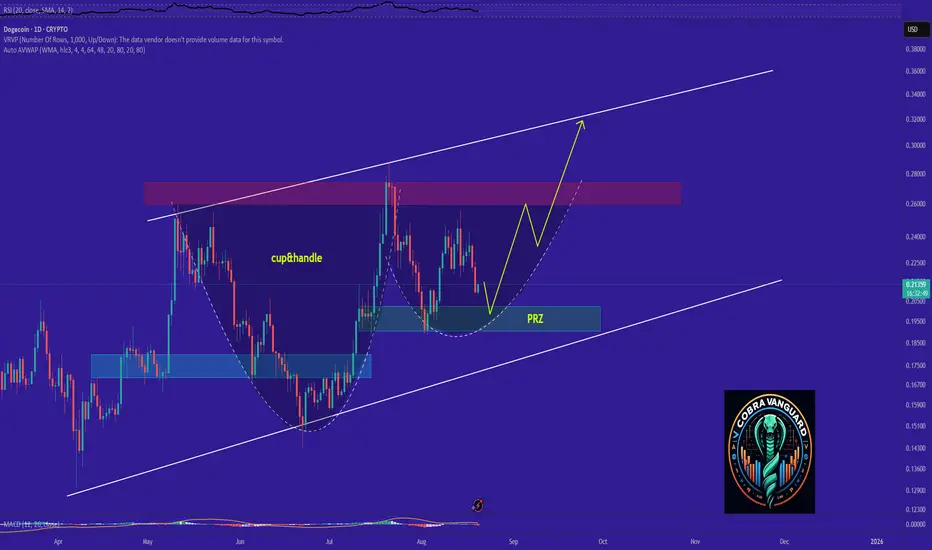
Can we be optimistic that this will come true?Perhaps this is a cup and handle pattern, and if that's the case, it could push the price up to around 0.30 .
Give me some energy !!
✨We spend hours finding potential opportunities and writing useful ideas, we would be happy if you support us.
Best regards CobraVanguard.💚
_ _ _ _ __ _ _ _ _ _ _ _ _ _ _ _ _ _ _ _ _ _ _ _ _ _ _ _ _ _ _ _
✅Thank you, and for more ideas, hit ❤️Like❤️ and 🌟Follow🌟!
⚠️Things can change...
The markets are always changing and even with all these signals, the market changes tend to be strong and fast!!
DOGECOIN Looks Bearish (1D)It seems that Dogecoin is preparing for another decline. A bearish trendline has formed, and the candles are moving below this trendline.
Based on the ABC structure, it appears that Dogecoin is pulling back into the red zone to gather more sell orders for a deeper drop.
It is expected that upon touching the red box, the price will move toward lower levels.
The targets are marked on the chart.
A daily candle close above the invalidation level will invalidate this analysis.
For risk management, please don't forget stop loss and capital management
When we reach the first target, save some profit and then change the stop to entry
Comment if you have any questions
Thank You

AUSDT bulish This AUSDT currency has reached the oversold area and should experience a growth of at least 8%. In this strategy, I buy spot and wait for the target. The win rate of this strategy is above 80%. If the next stage drops further, I will enter with 2 times the volume, which happens in one out of every 8 transactions. Capital management is the main pillar of trading.

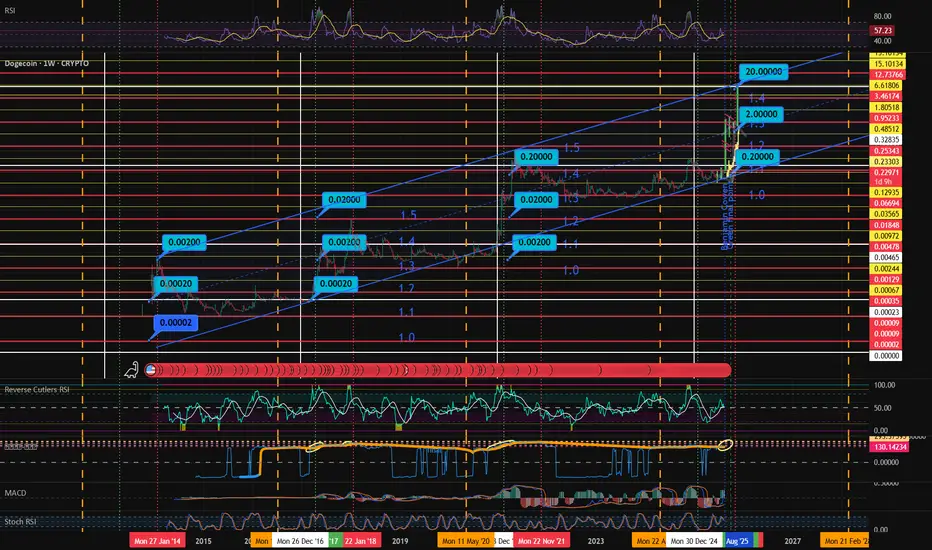
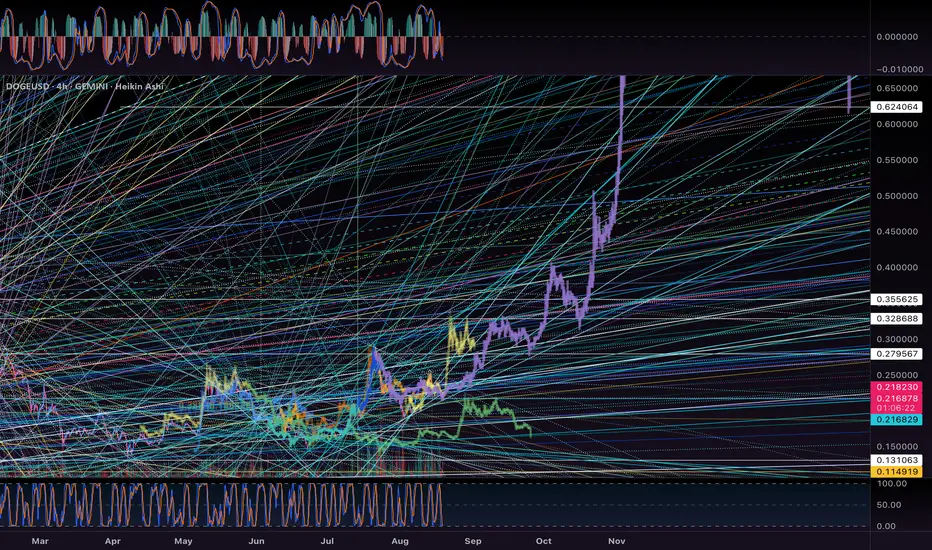
The only chart you need for DOGEUSD This chart displays Dogecoin (DOGE/USDT) on a weekly timeframe, highlighting its long-term price trend within an ascending channel since 2014. Key historical breakout levels are marked (e.g., $0.00002, $0.002, $0.02, $0.20, $2, and a projected $20 target), showing the repeating exponential growth cycles. The chart is overlaid with support and resistance zones, Fibonacci-like levels, and trend channels (1.0, 1.1, 1.2, 1.5). Vertical dotted and dashed lines mark important cycle dates and potential turning points. Current price action is consolidating near $0.23, with future targets extending to $2 and potentially $20 if the channel pattern continues.
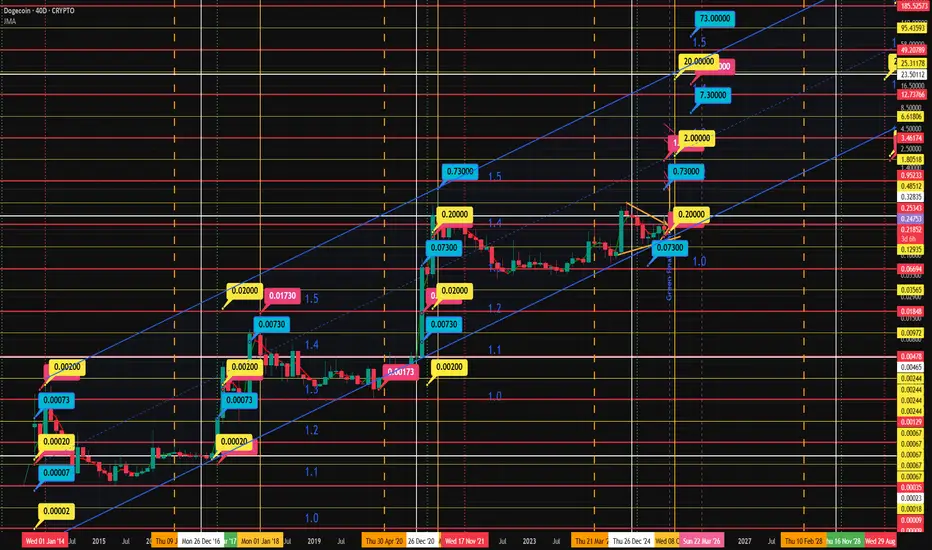
DOGE Bubble Cycle PatternBy merging both bubble charts (Yellow/Blue/Pink and Blue/Pink only), a clear fractal sequence emerges:
🔎 Step 1 – Cycle Sequences
Cycle 1 (2014–2016): Y (0.0002) → B (0.00073) → P (0.00173)
Cycle 2 (2017–2020): Y (0.0020) → B (0.0073) → P (0.0173)
Cycle 3 (2020–2022): Y (0.0200) → B (0.0730) → P (0.1730)
Cycle 4 (2025–2026, in progress): Y (2.0000) → B (7.3000) → P (17.3000 projected)
📌 Step 2 – Sequence Pattern
When overlaps are removed, each cycle follows the same strict order:
➡️ Yellow → Blue → Pink
This structure has repeated across 3 full historical cycles and is unfolding again in Cycle 4.
🧩 Step 3 – Cycle Rule
Yellow = Macro cycle anchor (start of each set).
Blue = Impulse peak within the cycle.
Pink = Correction pivot before reset.
The cycle then resets with a new Yellow and repeats.
So the long-term repeating loop is:
(Y → B → P) → (Y → B → P) → (Y → B → P) …
✅ Conclusion: DOGE’s bubble cycles are fractal, color-coded, and consistent. Currently, Cycle 4 has completed Yellow & Blue and is moving toward the Pink bubble (~17.3) before the next reset begins.
BNB tuched its TPThe first position reached its target with reward 2
Please go and see the previous analysis.
I am waiting for a new high to be recorded

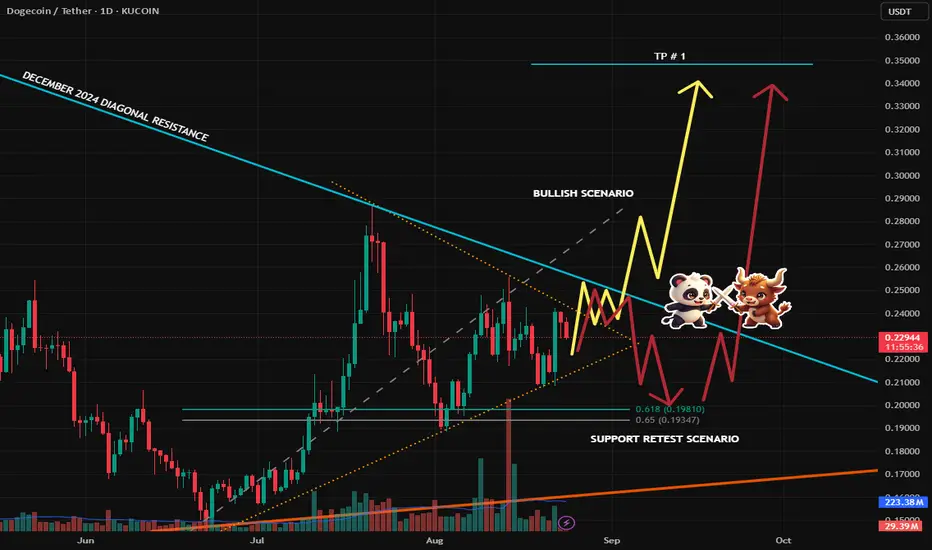
DOGE/USDT – Breakout or Retest?DOGE is coiling tighter inside this triangle and we’re now approaching the decision zone. I’ve mapped out two possible paths:
📊 Scenarios
🟡 Bullish Scenario
A breakout above the diagonal resistance (~0.24–0.25) with strong volume could ignite a rally.
Target (TP #1): 0.33 – 0.34
If momentum holds, higher levels are possible later.
🔴 Support Retest Scenario
If price gets rejected, DOGE could pull back into the 0.20–0.19 support zone (confluence with the 0.618–0.65 Fibonacci retracement).
A healthy retest here may provide fuel for a bigger move afterwards.
🧠 Market Context
Let’s be real — anything can happen here:
There’s still no significant buying volume confirming a breakout yet.
In fact, we recently saw a large red sell volume candle, showing sellers are still active.
Combine that with the usual September volatility (historically shaky month for crypto), and we should expect fakeouts and manipulation before a clear direction.
That’s why I don’t trade on hope — I wait for confirmation before committing.
💡 Final Thoughts
DOGE is at a critical zone — one strong move is coming. Whether we see the breakout first or a support retest before the bounce, the setup is already on the chart.
⚡ Smash the Follow button if you want more clean setups and pro-level breakdowns. Let’s trade smart and ride this DOGE wave together! 🚀🐕
THE NEO CYCLE CAN BREAK TO $12-$26 N3 Blockchain comingThe NEO cycle is starting to confirm in this zone, but we are waiting for a second confirmation. If the cycle is confirmed, we could see a new high around $12, with the potential to reach a top target of $26.
NEO is showing an A-level setup, though it may take time to fully build. This is shaping up to be a swing trade, so it should be monitored closely, step by step.
Some exchange data show interesting views about NEW and the building of volume
TA shows possibilities for a new break.

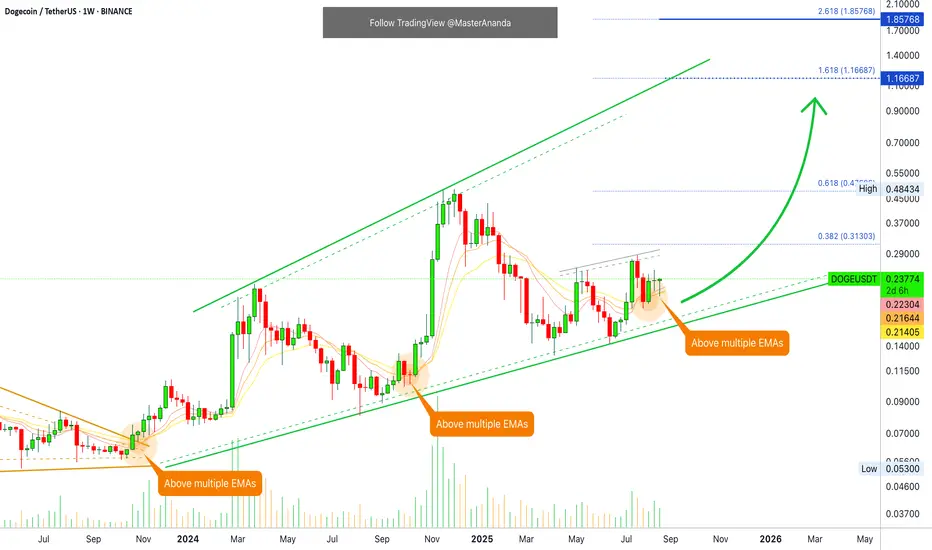
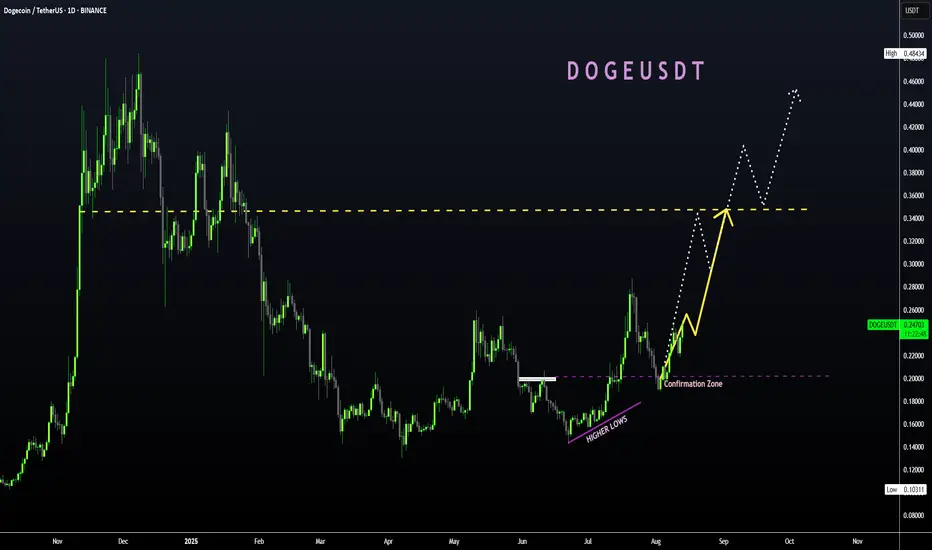
Dogecoin Set To Grow Immediately · Next Target $1.85 Mid-TermThis is it. If you are one of those traders that wait for confirmation, this is it. You can go LONG, all-in, right above the three moving averages shown on this chart. EMA8, EMA13 and EMA21. The stop below and you are safe because the Cryptocurrency market bulls own the game. The market is moving up.
This week is the fourth week that DOGEUSDT has been trading above support and seeing this support holding once more—support confirmed—simply ends the period of doubt.
Just a few days ago, a few weeks ago the market was divided in two groups, as it always happens. One group was bearish and another group was bullish. This is normal and always valid because the market can move in any direction. Where the market is headed can be predicted though based on what is happening.
If the action is happening above support/resistance with high volume and strong technical chart signals, we can say that prices are set to rise. When the contrary is true, the market is red below resistance/support, we know a drop follows.
Dogecoin is in the process of confirming a strong support and this confirmation is what reveals a higher high as the next major move. The market was already bullish and Dogecoin was already growing. What happened just now is the confirmation of the next advance. Now we know for certain Dogecoin is set to move beyond $1 in the coming months. It can go much higher of course.
Namaste.
DOGE 1H timeframe a closer look! Bounce or Bleed?This is a follow-up from my previous idea, but now on the 1H timeframe for a closer perspective. DOGE is currently hovering around the 0.5 Fibonacci retracement ($0.2149), and the price action is tightening between key support and resistance levels.
Here’s what I’m watching:
✅ A bounce from the 0.5 FIB ($0.2149) could send price back up to test the December 2024 diagonal resistance.
❌ A break below this level may open the way to the 0.618 ($0.1982) and 0.65 ($0.1936) supports, where buyers could step in again.
🚀 On the bullish side, confirmation above the December 2024 diagonal resistance remains the major trigger, aligning with my bigger plan for a move toward TP1 = $0.348.
The June 2025 diagonal support line is still intact, keeping the broader structure supportive of higher lows.
In short:
Bulls need to hold $0.2149 → bounce likely.
Bears take control if $0.2149 breaks → next zone $0.1982–$0.1936.
Breakout above diagonal resistance → momentum builds toward higher targets.
💬 That’s my closer look at DOGE. What’s your short-term bias here — do you see bulls holding or bears taking over? Share your thoughts in the comments, and I’ll be happy to check out your trade ideas too! 🙌
If this breakdown helps, don’t forget to follow me here on TradingView for more updates and setups. 🚀

DOGE at the Crossroads: Bounce or Break?Currently, I’m watching how DOGE reacts around the 0.5 Fibonacci retracement ($0.2149). If this level fails to hold, my next support levels are at the 0.618 ($0.1982) and the 0.65 ($0.1936) zone. These areas could serve as strong demand zones where buyers may step in before DOGE begins another bullish leg.
The key resistance to watch is the December 2024 trendline (diagonal resistance connecting the recent highs). Once price breaks and confirms above this trendline, my first partial Take Profit (TP1) will be at the 0.618 level of the bigger Fibonacci retracement = $0.348.
The June 2025 diagonal support line (ascending trendline) also remains intact, providing structure for a possible higher-low formation.
Here’s my trading plan in simple steps:
✅ If 0.5 FIB ($0.2149) holds → bounce likely.
❌ If 0.5 FIB breaks → next support is 0.618 ($0.1982) / 0.65 ($0.1936).
🚀 Breakout above December 2024 trendline → first TP = $0.348.
That’s my take on DOGE. What’s yours? Share your thoughts in the comments — I’d love to check out your trade ideas too. 🙌 If you found this breakdown useful, don’t forget to follow me here on TradingView for more structured crypto setups and insights!

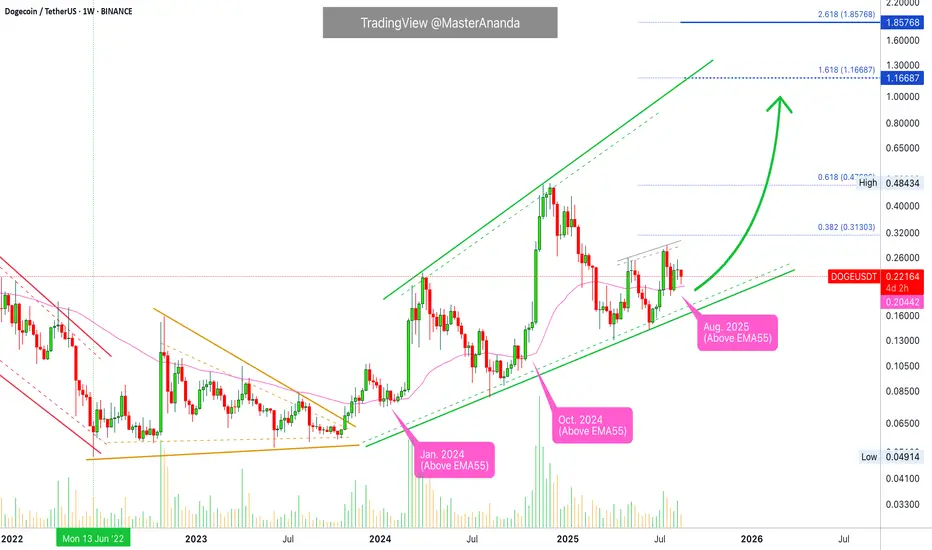
Dogecoin · EMA55 Weekly · See What I Mean?Here DOGEUSDT (Dogecoin) can be seen rising while staying above EMA55 weekly—magenta line on the chart.
This is technical analysis made simple.
» DOGEUSDT moved above EMA55 October 2024 and this produced a major bullish jump.
» DOGEUSDT moved above EMA55 January 2024 and this produced a bullish jump.
» DOGEUSDT moved above EMA55 November 2020. This event preceded the 65,000% 2021 bull market.
» The date is now August 2025 and Dogecoin is trading safely above EMA55 after a minor advance. It managed to break this level as resistance and later confirm it as support.
If DOGEUSDT can remain above this level for just 1-2 weeks without crashing down, expect a major advance, and this is exactly what we expect will happen in the coming weeks. Dogecoin is going to grow massive with targets at $1.16 and $1.85.
Thank you for reading.
Namaste.
DOGE's Situation, A Comprehensive Analysis !!!It appears that the price is forming a cup and handle pattern, and if this occurs, it could push the price above $0.30 & reach to top of the channel.
Best regards CobraVanguard.💚
DODUSDT (Daily)🔎 Chart Context
• Pair: DOGE/USDT
• Exchange: Binance
• Timeframe: 1D (Daily)
• Date: 21 August 2025
This chart applies price action, supply & demand zones, and liquidity sweeps to map DOGE’s likely paths.
📊 Key Observations
1. Market Structure
• DOGE bottomed at 0.129 – 0.142 zone earlier in the year.
• A bullish change of character (CH D) occurred around 0.193, shifting bias upward.
• Since then, price has established higher lows (0.164, 0.168, 0.188) and higher highs (0.259, 0.2875) → confirming an uptrend on the daily timeframe.
2. Support & Demand Zones
• 0.188 – 0.206 zone: Strong demand, aligned with previous accumulation and mitigation.
• 0.164 – 0.168 zone: Secondary demand if the higher zone fails.
• 0.142 – 0.129 zone: Long-term base and ultimate defense for the bullish structure.
3. Resistance & Supply Zones
• 0.259 – 0.2875 zone: Heavy supply, marked as the upside target.
• Price has rejected this zone twice, indicating strong liquidity resting above.
• A breakout above 0.2875 would expose the next major resistance at 0.320 – 0.340.
4. Liquidity Behavior
• Below: liquidity pools around 0.188 (recent HL) and 0.168 (old base).
• Above: liquidity above 0.259 and especially 0.2875, where many stop orders cluster.
• The projection suggests a sweep lower into 0.188, then a bullish continuation toward 0.2875.
📈 Bullish Scenario (Higher Probability)
• Price retraces into 0.188 – 0.206 demand zone.
• Buyers defend the zone, leading to a reversal.
• Path: bounce → reclaim 0.23 → push into 0.259 → liquidity grab at 0.2875.
• A successful break of 0.2875 confirms continuation toward 0.320 – 0.340.
📉 Bearish Scenario (Lower Probability)
• Failure to hold 0.188 demand zone leads to a deeper correction.
• Next downside targets:
• 0.168 (secondary demand)
• 0.142 – 0.129 (long-term accumulation zone)
• This would still keep DOGE inside a macro bullish accumulation, unless 0.129 breaks.
⚡ Trading Plan
• Long Setup (Preferred Play):
• Entry: 0.188 – 0.206 zone
• TP1: 0.259
• TP2: 0.2875
• TP3: 0.320 – 0.340 extension
• Stop-loss: Below 0.188 or conservative below 0.168
• Short Setup (Countertrend, Risky):
• Entry: 0.259 – 0.2875 supply zone rejection
• TP: 0.206 – 0.188 demand zone
• Stop-loss: Above 0.29

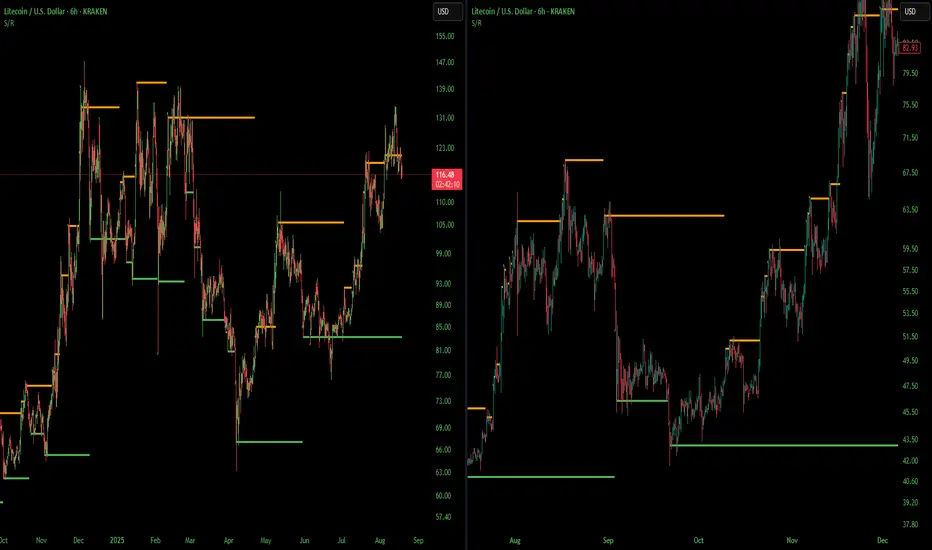
Not Exact But Man Does It Look Similar LTCUSDI had pointed this out in a previous chart but i thought I would zoom in and show how similar these look. I think its launch time, last time LTC was at this point it did a 10x in a month. Alt season starts when Litecoin says so. Not financial advice just my opinion. Thank you
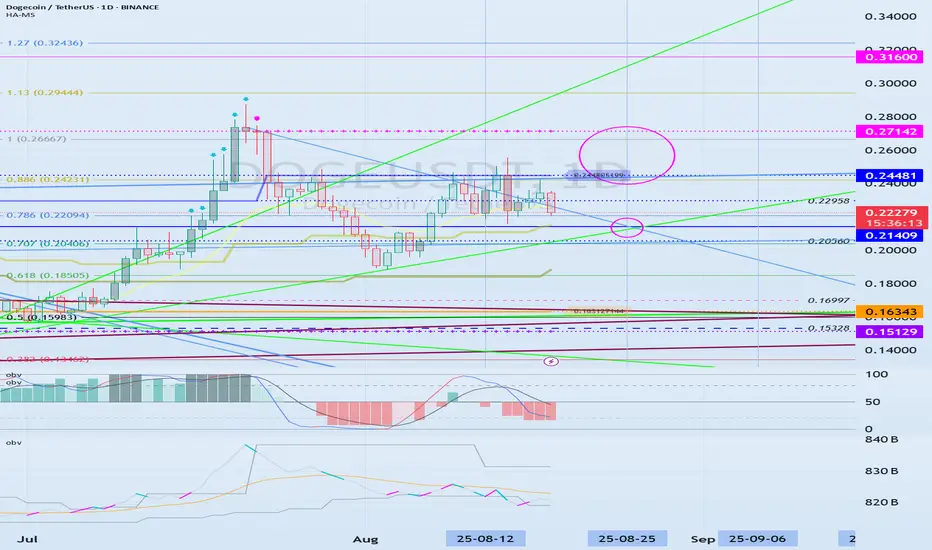
DOGE Golden Pocket Defense — Bulls vs Bears at 0.21!Analysis
Dogecoin is currently at a critical inflection point, trading inside a range between 0.20 – 0.245. The 0.206 – 0.216 zone (Golden Pocket Fib 0.5 & 0.618) has acted as a key demand area, consistently absorbing sell pressure and triggering multiple bounces.
So far, this zone has been respected as a strong support, signaling buyer accumulation. However, without a decisive breakout above 0.2447, the market remains in sideways consolidation mode.
---
🔹 Technical Structure & Pattern
Golden Pocket Defense → buyers are repeatedly defending the 0.202–0.216 area.
Equal Highs → formed around 0.2447–0.2724, suggesting liquidity buildup above this range.
Consolidation Range → in play since June, with 0.20 as support and 0.245–0.272 as resistance.
A successful breakout could serve as a base for the next expansion leg.
---
🚀 Bullish Scenario
1. As long as price holds above 0.202–0.216, bias remains constructive.
2. A daily close above 0.2447 will likely trigger momentum toward 0.2724.
3. If 0.2724 breaks, targets extend to 0.3106 → 0.3363.
4. A strong continuation above 0.3363 could push DOGE toward 0.4137 – 0.4350, and eventually 0.4668 – 0.4843.
5. This would mark a clear shift from consolidation to a trend expansion phase.
---
⚠️ Bearish Scenario
1. A daily close below 0.202 invalidates the demand zone and flips bias to bearish.
2. Downside targets: 0.190 → 0.170.
3. In case of extended weakness, deeper supports are found at 0.136 – 0.129 (historical lows).
4. Such a breakdown could trigger panic selling, especially if Bitcoin weakens simultaneously.
---
🎯 Trading Idea Summary
Critical Zone: 0.202 – 0.216 (Golden Pocket) → buyers must defend it to sustain bullish momentum.
Bullish Play: Accumulate near demand zone, invalidation below 0.202, scale out at 0.2447 / 0.2724 / 0.3106.
Bearish Play: Wait for breakdown below 0.202 for momentum toward 0.190 / 0.170.
📌 In short, DOGE is at a make-or-break zone: will it push higher into 0.27–0.31 or lose its footing and revisit 0.19?
#DOGE #DOGEUSDT #Dogecoin #CryptoAnalysis #Altcoins #PriceAction #Fibonacci #SupportResistance #GoldenPocket

Doge - launch sequence?Hello!
The yellow and purple traces are today’s look at the bullish launch sequences that we may be feeling the effects of.
Yellow shows $0.32 on this next move for Doge. Purple is fractaling out … it goes big. Over a dollar.
This could also the a head and shoulders having just completed on the hourly view. That would make this the right shoulder on tehlonge range view also… nested H& S? That can trigger big moves.
RSI and MACD jsut reset on the 4H candle. Love that position for a bounce!
Go Doge Go!
See if it finds support near 0.21409 and can rise
Hello, fellow traders!
Follow me to get the latest information quickly.
Have a great day.
-------------------------------------
(DOGEUSDT 1M Chart)
I'm not sure if I should hold DOGE for the medium to long term.
However, if you plan to hold the coin for the medium to long term, I recommend increasing the number of coins (tokens) that represent profit.
The 0.21409-0.31600 range is an important high point boundary.
If this area supports the price and the price rises, a stepwise upward trend is likely.
To do so, we need to observe whether the price rises along the existing rising channel.
If the price falls below the downtrend line (1), we should stop trading and wait and see how things unfold.
-
(1W Chart)
A new channel has formed by breaking away from the downtrend line (2).
Therefore, the key question is whether the price can rise along this channel and rise above 0.37778.
If possible, I recommend finding support near 0.21409.
-
(1D Chart)
To form a channel, the key is to find support near 0.21409 and maintain the price above 0.24481.
To continue the stepwise uptrend, the price is expected to rise above 0.24481-0.27142.
If it falls below 0.21409, it is expected to meet the M-Signal indicator on the 1M chart and re-establish the trend.
The support level is 0.15129-0.16343.
-
Thank you for reading.
I wish you successful trading.
--------------------------------------------------
- This is an explanation of the big picture.
(3-year bull market, 1-year bear market pattern)
I will explain in more detail when the bear market begins.
------------------------------------------------------
DOGECOIN Flips the Script! Higher Prices Likely Ahead (⊙ˍ⊙)Dogecoin has recently made a stunning 62% increase since my last update:
Find the last update here on a bull season ahead for DOGE:
So what's next for Dogecoin? Well, as long as ETH continues to hold it's current position, alts will continue to rally as they take turns with Ethereum to increase, pause and hold, or slightly pullback. This all happens with BTC above $119k, and it the short term Bitcoin is still looking strong.
There's no way that ETH makes a new ATH and DOGE doesn't. It may take some time, but higher prices are likely on the cards for the near term for Dogecoin!
As long as Bitcoin stays in this zone, ALTS will continue to rally :
Dogecoin's 2025 True All-Time High Revealed (Beyond $1.85)Will Dogecoin's bull market also end in exactly two months?
Does this means that all possible growth should be compressed within 8 candles only?
In the last bull market, Dogecoin grew for 420 days a total of 65,527%.
The previous bear market ended June 2022, that's the market bottom for DOGEUSDT after the May 2021 all-time high. Including a period of consolidation, Dogecoin has been rising for 1,155 days. The current uptrend became obvious in October 2023, since 672 days.
Who is to say that the market will grow for a maximum of two months? Why not 3 months or 4 months? The FED? Things are not always what we expect. We cannot predict the future for sure. Maybe we can predict some events but we cannot predict how the market will react to a certain announcement.
Maybe when everybody is thinking that there will be a recession with the stock market crashing and crypto, but crypto instead of crashing becomes ultra bullish. While everything else is down crypto is up. Perfect timing of course.
Dogecoin has been rising for years and it has a great chart. It is still far away from an all-time high but seeing Cardano, we know it will move above December 2024. Seeing XRP and ETH, we know it will continue to grow.
The path is already set.
We have some really interesting targets. I am looking at the full numbers for DOGEUSDT.
The first resistance worth being mentioned is $0.47. This one can be hit within a month.
Then we have the all-time high around $0.74 followed by $1.166. The second one being the main resistance for the current move. If the bull market is extended as previous ones, then we can expect even higher prices. Dogecoin can trade at an amazing $1.85 or $2.55.
Additional details on the chart.
The market looks chilling now, but everything is about to blow up.
Namaste.

GO LONG BOYS!!!!Bitcoin is about to RIP to numbers no one would ever believe. Its also going to do it so fast that most wont be able to get in. I predict that within the next month or so we will daily candles of 10k+ maybe higher.
If you're on the sidelines still waiting for a dump then just stay there, keep waiting, and listening to the echo chamber of a big dump incoming. Fools.
This is just my opinion not financial advice.
