GBPUSD Downtrend ChannelThere was a quite Doji rejection on 4H
With Buyers been sceptical on their decision to move the market further
Due to NFP, tomorrow Dollar will push downward to the proven Support
Wait for another reversal confirmation candle that signifies bearish movement
Doji

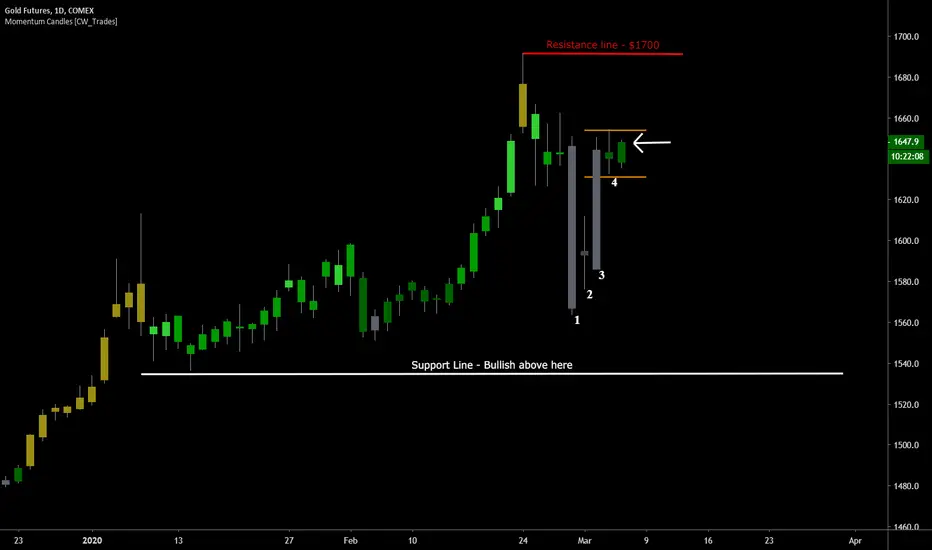
Gold Doji Candles & $1700 On Deck#gold #gc1! – Gold has been trading in the upper end of its three-day range after selling off last week with other global markets, and the reversing back to the upside this week.
Candle 1 shows the selloff back down to $1,560 last week.
Candle 2 is a long-legged doji, or sign of indecisiveness in traders as they pushed price higher and lower during the course of the day, then ultimately closing price near where it opened. Normally the direction after a doji candle indicates the future trend.
Candle 3 shows the reversal back to the upside after trader indecision the previous day.
Candle 4 shows shows trader indecision again at the upper end of the weekly price range.
Orange lines show the upper end of the range and where price is holding for now.
I’m expecting a push higher on today's candle pointed to with the arrow as price is holding within the upper end of its three-day range. Ultimate resistance is shown in red, up near $1700. A push and close above that level would put $1750-$1800 on traders radar going forward on the march back to all-time highs near $2,000.
EUR/USD - ShortI am looking to take this pair to the downside, however, we are still very bullish, today is the first bearish day we have seen.
4HR - We have seen a previous Doji candle and then coming down to touch the double bottom, bouncing off support. I would like to see this close below support, test as resistance to then take the short.
Keeping in mind that we do also have the double top resistance area above that we could potentially touch first. No rush on this I will be watching closely for the right entry.

BEARISH DOJI ON THE MONTHLYThe highlighted 1 spot is looking like trouble. The only bright spot for the bulls is the highlighted 2 section where prior to the last bull run we saw a solid red candle before blasting off. If we don't see bullish continuation in March or April, XRP could be heading a lot lower.
Who knows?
Good luck.

GBPAUD LONGGBPAUD LONG
Overall TP - 120 Pips
I have highlighted three areas on interest where either bullish engulfing candle was formed or morning star doji candle.
Price is currently entering low consolidation.
I believe we will soon see some bullish movement.

EUR USD Strong Supportsseveral buy signals on EURUSD:
1.08900 support line
1.08700 monthly S2 pivot
RSI divergence and over sold
MACD divergence and loosing power
( High bull volume yesterday when price reached 1.08900 that caused a dodgy candle on daily time frame )
watch for the best entry point in lower time frames
feel free to share your opinion, thanks for reading

GBPAUD ShortShould see GBPAUD come down for an overall of 163 pips.
I like the evening star formed on the 4 hour time frame near resistance.
This closed below the previous low high that is highlighted in the eclipse.
This is a nice lower high formation that I think will continue down.

BTC first more significant correction/wick bellow 10250$.BTC first more significant correction/wick bellow 10250$.
So far forming a hammer doji , but we need more information before confirming/assuming a more positive directing.
The situation can easily turn and the hammer doji can transform into a hanging man pattern quite easily. So far staying neural to moderately bullish. Remember not to over leverage your trades as moves between 3-5% will happen more often than you think (especially at resistance).

LTC|USD - Gravestone DojiGreetings. Please leave a Like if you like the idea
Bearish sign on LTC is that price formed a Gravestone Doji at the hard Resistance level. We can expect a correction at least to one of marked levels.
Leaving a "like" costs nothing and really helps me out; please consider it! It's the #1 thing I look at when deciding to work on future content.
Peace Out!
Not a Financial Advice

Dow going up for a small gap fill, then continuation down...I can see the DOW going up to fill the gap and the Daily Doji candle would confirm this a likely possibility. After this plays out I expect to retrace back to 28,000 area, and beyond that eventually would be possible.


Bull break pending, ONTXIf this 4hr candle can close engulfing the doji on ONTX, it could mark the beginning of the bull break. There's also now a hidden RSI bullish divergence. That along with the decreasing volume and the equilibrium pattern I talked about in my last post are great bullish signs!

XAUUSD SHORTSeries of lower higher being created
Daily time frame created a Morningstar for a pullback to continue down.
Take profit 1 = 78 pips
take profit 2 = 140 pips
take profit 3 = 200 pips


Pinbar/Doji retracementPinbar/Doji off of Fibonacci level and previous resistance turned support. Waiting for price action and volume. Setting entry at a break of previous day's high. Pinbar/doji didn't break previous price levels which can be an indication that it may not reverse, though

SP500 - Week 06/01/2020 - Doji FormationPrice Action: Doji Formation
Entry @ market open
TP @ 3143
SL @ 3263

CIMB: Long Term Reversal with Supported Year-LineThank you for your continued support :)
Strategy: Moving Averages Formation
Bias: Bullish
As seen in the chart, the Year-Line is a strong indicator of trend. Around late Feb 2019, The price managed to closed above the Year-Line for a few days before rejecting and continued downward sliding. This time, not only is the price holding comfortably above the Year-Line, it also found support when it tested the Year-Line with a doji candle on the 4th Dec.
Entry: 5.30
Stop-loss: 5.19
1st Target: 5.61
2nd Target: 5.77
Gentle reminder: Plan your trade and trade your plan. Peace out!

XAUUSD - Doji + trendline breakout on 1h timeframeIf a candle closes below last swing low on 1h timeframe, price should at least touch the first take profit.

XAU/USD FORECAST 30 DEC 2019XAU/USD reached fibonacci resistance 0.618 (SELL ZONE) and DOJI candle on D1. On 4H chart, MACD crossed and give a bearish signal.
Risk to Reward 1:2.02

TECFAST, Rebound on Support, Any Meat Left?Bias: Bullish. When the correction hit FOUR classic technical conditions on 29th Nov 2019, the next green candle on 2nd Dec shows promise of a swift rebound. Can you guess what are those FOUR technical tools? Ask us in the comments below! It might be slightly late to the party now, so let the buyer beware.
Stop-loss: 0.385
// The recent low point.
1st target: 0.490
// Previous high as minor resistance.
2nd target: 0.520
// Historical resistance as major resistance.
Gentle reminder: Plan the trade and trade the plan. Trade at your own risk. Stay tune!
Guys, if you like the idea, please "like" it, this will be the best thanks.
If you have any questions or trading ideas, please post them in comments!
Thank you for your support, we appreciate it.

Doji morning star on 4hDoji morning star is building up on 4 hour chart. Lets wait for this candle to finish and confirm that signal.

Hammer emerging on weekly chart, bullish reversalHammer doji emerging on weekly chart after piercing bottom trendline simply showing bullish reversal signal.
