Doji Candlestick: A Key to Market ReversalsAlright, let’s break down the Doji candlestick pattern.
If you're trading crypto, you've probably bumped into this little guy at some point. It’s not a wild trendsetter on its own, but it definitely has something to say about the market’s mood 🤔. The Doji is one of those candlestick patterns you’ll want to pay attention to if you're trying to catch reversals or just understand what's going on in the market.
What is the Doji Candlestick Pattern?
A Doji candlestick pattern forms when the opening and closing prices are almost identical. The body of the candle becomes tiny, while the shadows (the lines extending above and below the body) are long. It might look like a cross, plus sign, or even an “✖️.” The key point is that the market is indecisive, which is why this pattern gets so much attention.
🐂Bullish Doji Candlestick Pattern
So, what happens when you spot a Doji after a downtrend? You might be looking at a potential reversal, signaling that the bears are running out of steam. A bullish Doji candlestick pattern forms when the market closes near the opening price but after a steady downtrend. It’s like the bulls are just waiting for the right moment to step in. But don’t jump in too quickly! A single Doji doesn't mean the market's ready to flip. Look for confirmation in the following candles — ideally, a strong bullish candle that closes above the previous high.
🐻Bearish Doji Candlestick Pattern
Now, flip the script. If you see a bearish Doji candlestick pattern after a nice uptrend, it’s time to pay attention. This signals that the bulls might be running out of energy, and the bears could be gearing up for a push. It’s not an instant signal to sell, but it’s a red flag that the market’s strength is weakening. After spotting the Doji, wait for confirmation — usually in the form of a bearish candle that closes below the previous low.
How to Use the Doji Trading Pattern Effectively?
So you’ve spotted a Doji chart pattern. Now what? This pattern is all about context. If it shows up in the middle of a strong trend, it’s probably just a pause in the action — not a reversal. But, if it appears after a big rally or a significant drop, it could indicate that market sentiment is shifting.
Here’s the key: Confirmation is king. The Doji itself doesn’t tell you where the market is going. It only tells you that the market is uncertain. Look for the next few candles to see if they support a reversal — a bullish follow-up candle after a bearish Doji or a bearish candle after a bullish Doji.
🏁Final Thoughts
The Doji candlestick pattern can be a valuable addition to your trading strategy, offering insights into market sentiment when combined with other indicators. While it highlights moments of indecision, it's essential to exercise caution and not rely solely on a single signal. In trading, context, confirmation, and proper risk management are key. Remember, tools like the Doji are meant to inform your decisions, but ultimately, it's your judgment and strategy that will guide your moves. Happy trading!
Dojis


📊 The Doji Candle Pattern📍What is the Doji Candlestick Pattern?
The Doji Candlestick Pattern refers to a chart pattern consisting of a single candle. This pattern appears when the opening and closing prices of a candle are nearly the same or identical, resulting in a small-bodied candle with upper and lower wicks resembling a "+". Different variations of Doji patterns exist, with unique names like the Long-legged Doji, Gravestone Doji, Dragonfly Doji, and Doji star candlestick pattern. Regardless of the type, all Doji patterns provide traders with four critical data points: the open, close, high, and low prices for the given period. Doji patterns can occur on any timeframe and in any market, making them the foundation of many trading strategies
🔹Long-legged Doji
The Long-legged Doji pattern has an elongated upper and lower wick and a small body
The Long-legged Doji can be interpreted in several ways and works best when viewed in context with price action. It is a potential price reversal signal in a defined up or downtrend. If it occurs in a flat market, it suggests further consolidation.
🔹Dragonfly Doji
The Dragonfly Doji sets up when the candle’s open, close, and high is approximately the same. Visually, the Dragonfly looks like a “T,” as depicted in the image below. This formation suggests that heavy selling was present, but the market has rebounded. As a general rule, the Dragonfly is considered a reversal indicator. A retracement in price is expected when it occurs at the top of a bullish trend.
🔹Gravestone Doji
The Gravestone Doji pattern is the polar opposite of the Dragonfly; it appears as an inverted “T” and signals that heavy buying has given way to selling. The Gravestone Doji is a reversal chart pattern that signals downward or upward pressure may be on the way. The Gravestone suggests that a reversal is possible when observed within a defined uptrend. Within a downtrend, bullish price action may be forthcoming.
🔸Reversals
Doji candlesticks can be a great way to get in or out of the market in trending markets. The Gravestone and Dragonfly are ideal for reversal strategies as they indicate forthcoming upward and downward movements in price.
🔸Breakouts
One of the lowest-risk ways to utilize Dojis in the FX market is to trade breakouts. A breakout is a sudden directional move in price. Dojis often precede breakouts, as they are a signal of indecisiveness. As soon as the market makes up its mind, a significant move may be in the offing.
👤 @AlgoBuddy
📅 Daily Ideas about market update, psychology & indicators
❤️ If you appreciate our work, please like, comment and follow ❤️

NZDCHF DOUBLE BOTTOM - SWING LONG POSSIBILITYWe have had the pair ranging for two month forming two Doji Patterns on MN and a inverted hammer last week. Possible swing long for the pair.

XAGUSD 1D. Update. Target Reached: Retrace Doji candle. Just a quick update. We got the retest of the trend line! Silver went slightly beyond my target price and has formed a Dragonfly/Hammer Doji. I'm no longer in the short trade. Look to see how often on the daily the long tailed Doji candles play out to the upside. Price action candle types helping us anticipate changes. I'm still short inclined and I will wait to see how this develops. But, I'm not giving too much of my gains back to the market.
Summary. Short term long.

BTC - H1 - TRADING IN THE ZONE - AT A GLANCEH1 : Watch the clouds as an important support zone.
2 successives dojis took place which triggered a rebound.
Technical indicators are showing some signs of a recovery.
Resistances levels are the following :
R1 : 56327
R1 : 56713 (currently the downtrend line resistance level)
R3 : 57099
IMPORTANT TO NOTE THAT 57099 IS ALSO THE LEVEL OF THE MID BOLLINGER BAND !
Therefore, in order to invalidate the ongoing tactical bearish price action, BTC need to recover and hold above
57100 and which is the case, focus will be on 78.6% Fib ret @ 57650
Watch M15 for intermediate signal (s)

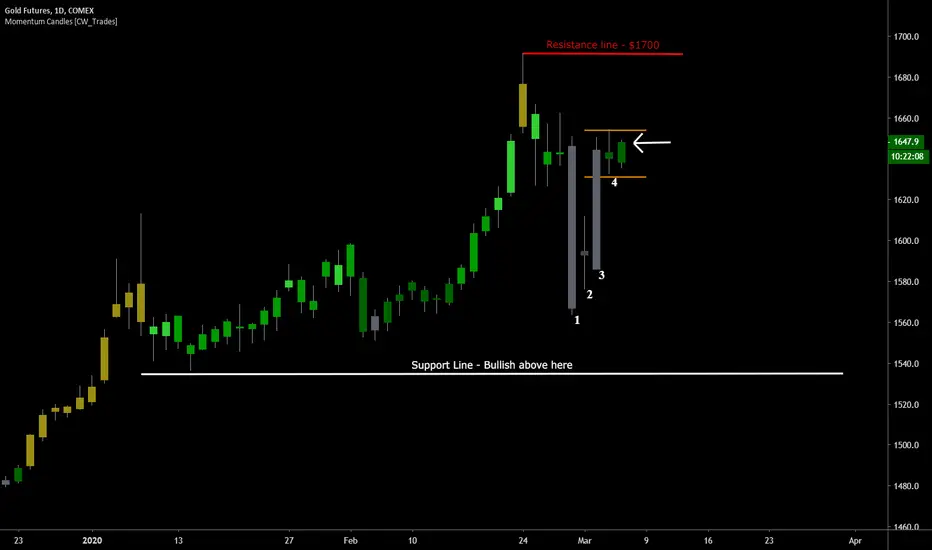
Gold Doji Candles & $1700 On Deck#gold #gc1! – Gold has been trading in the upper end of its three-day range after selling off last week with other global markets, and the reversing back to the upside this week.
Candle 1 shows the selloff back down to $1,560 last week.
Candle 2 is a long-legged doji, or sign of indecisiveness in traders as they pushed price higher and lower during the course of the day, then ultimately closing price near where it opened. Normally the direction after a doji candle indicates the future trend.
Candle 3 shows the reversal back to the upside after trader indecision the previous day.
Candle 4 shows shows trader indecision again at the upper end of the weekly price range.
Orange lines show the upper end of the range and where price is holding for now.
I’m expecting a push higher on today's candle pointed to with the arrow as price is holding within the upper end of its three-day range. Ultimate resistance is shown in red, up near $1700. A push and close above that level would put $1750-$1800 on traders radar going forward on the march back to all-time highs near $2,000.
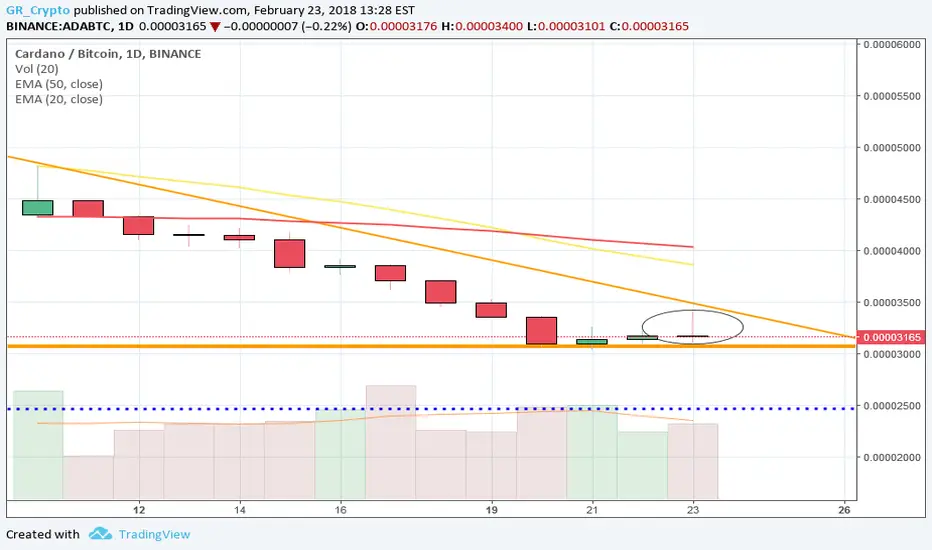
Bitcoin following a red Doji pathMade a bunch of trend lines over a week ago.. Just amazing how they continue to be trendy.
Bitcoin looks to be following the red side of the Doji path:

SHORT - AUDJPY - Reversal Confluence checklist:
-Broke resistance @82.0000 & 200 EMA (looking at a potential reversal to retest. Possible quick 1:1 as price action could retest resistance turned support.
-Doji reversal set up (@83 level)
-MACD divergence
-ATR decelerating
-Chop Index < 60
Please share your thoughts and opinions.
Cheers,
Sang

Confirmed resistance at 370.04th consecutive day of rejection.
Shooting Star and Doji fully formed.
Confirmed resistance area at 370.0.
Market overbought by looking at the Stochastic.
Singapore30 should give us a potential short opportunity.
K.

LTC has lots going for it todaySo the one of the last 4h candles FINALLY closed above the 50 EMA. Prior to that it kept getting pushed below it like a a bully to a kid on the playground. The following 4h candle opened and stayed above the 50 EMA too, so that's great.
We have stayed in a tightening range which is pushing back against the resistance hard, bulls are starting to wake up. We have a bull MACd cross on the daily as well, with a sexy looking doji candle on the weekly chart, all of which are pointing to a bullish breaking point that is going to happen very soon. At least so I imagine. if we break bearish (which I wont eliminate as a possibility) it will probably be because of a lack of bull volume. But, it's starting to show up and may be holding back until just enough pushes us past some of these lines. When it does though, I'm optimistic that it will push us past 175 resistance and help us form some daily higher highs.
Not much new, just wanted to point the break past the 50 EMA and that sexy weekly doji candlestick. Like, comment with feedback, and follow! As always, I'm no professional, but a LTC enthusiast for sure, so DYOR, chart your own crap, and don't take my fin. advice (because that's not what this is at all).
Peace and hair grease.
