DXY ready to drop ?DXY trade setup for today :
Before we look at potential entry in this pair first let’s look at multiple timeframe analysis in this market.
Monthly: 100.24 Monthly resistance price has got rejection strongly from the top
Weekly: Bearish engulfed formation with strong liquidity grab
Daily: A sharp rejection with liquidity grab from the resistance
Entry timeframe 4H : Upon retest of the order block, market has got rejected and potentially breaking out of the market structure to continue to drop to support level.
Possible trade recommendation : Bearish entry with SL above sessions high
Dollar

Fundamental Market Analysis for August 20, 2025 USDJPYThe Japanese yen (JPY) recovered from a slight decline during the Asian session caused by mixed domestic data and on Wednesday showed positive dynamics for the second day in a row against the strengthening US dollar (USD). A government report showed that core orders for machinery and equipment in Japan unexpectedly rose in June. However, this was offset by a decline in Japanese exports in July for the third consecutive month, raising concerns about the outlook for the export-dependent economy. This added to uncertainty about the likely timing of the next interest rate hike by the Bank of Japan (BoJ) and triggered some intraday selling of the Japanese yen.
On the other hand, the US dollar is attracting some follow-up buying for the third day in a row amid a decline in the likelihood of more aggressive easing by the Federal Reserve (Fed). This is proving to be another factor providing some support for the USD/JPY pair. Nevertheless, traders still consider it more likely that the Fed will resume its cycle of rate cuts in September. In contrast, the Bank of Japan is expected to stick to its policy normalization course and raise interest rates before the end of the year. This, in turn, could limit the US dollar's gains and help contain deeper losses for the lower-yielding Japanese yen ahead of the FOMC minutes release.
Trade recommendation: SELL 147.10, SL 148.00, TP 146.20

DJ30 ShortHere is my short setup on the Dow Jones, the bottom grey box is where I will take my first set of profits. BLACKBULL:US30

EURUSD (Daily)EUR/USD Daily Chart shows a clear bullish trend, with demand consistently supporting higher prices. The most probable scenario is a breakout above 1.2000, targeting 1.2202. This aligns perfectly with your DXY analysis, where further USD weakness supports Euro strength.
🔎 Chart Context
• Pair: EUR/USD
• Broker: FXCM
• Timeframe: 1D (Daily)
• Date: 19 August 2025
This chart shows the Euro’s performance against the US Dollar. Since EUR/USD is strongly inversely correlated with the DXY, this analysis complements the DXY bearish outlook.
📊 Key Observations
1. Macro Trend
• EUR/USD bottomed near 1.0200 earlier in 2025.
• Since then, price has established a strong bullish uptrend, breaking through multiple resistance levels.
• Current structure shows higher highs and higher lows, confirming a bullish market bias.
2. Support & Demand Zones
• Key demand zone around 1.1100 – 1.1200, previously a resistance-turned-support.
• A well-defined S/D (supply → demand flip) is visible, showing institutional accumulation.
• Price respected this area on multiple retests, suggesting strong bullish interest.
3. Resistance Zones
• 1.2000: Psychological resistance and liquidity pool.
• 1.2202: Next major projected upside target, marked on the chart.
• Price is consolidating below 1.2000, building energy for a potential breakout.
4. Liquidity Behavior
• Market has absorbed sellers around 1.1600–1.1700, pushing into higher levels.
• Liquidity likely rests above 1.2000, where stop orders are clustered.
• If price clears this, a sweep toward 1.2202 becomes very probable.
5. Projected Path
• Chart projection suggests a bullish continuation:
• Short-term pullback → retest of demand zone (around 1.1600–1.1700).
• Then breakout above 1.2000.
• Final move toward 1.2202 liquidity zone.
📈 Bullish Case (Higher Probability)
• Structure strongly favors bulls.
• Scenario:
• If EUR/USD sustains above 1.1600 demand, breakout above 1.2000 is expected.
• Target 1: 1.2000 (psychological & liquidity).
• Target 2: 1.2202 (projected liquidity sweep).
• This aligns with DXY bearish outlook (as seen in your previous chart).
📉 Bearish Case (Low Probability, Countertrend)
• Only valid if price breaks back below 1.1100 demand zone.
• Downside targets:
• 1.0800 (structural support).
• 1.0500 (deep retracement).
• This would require a sudden USD strength revival, which contradicts current DXY projection.
⚡ Trading Plan
• Long Setup (Preferred):
• Entry: Pullbacks into 1.1600–1.1700 demand zone.
• TP1: 1.2000
• TP2: 1.2202
• Stop-loss: Below 1.1100
• Short Setup (Risky, Countertrend):
• Entry: At 1.2000 liquidity zone if price rejects strongly.
• TP: 1.1600
• Stop: Above 1.2202

Gold Futures | Accumulation in Play – Watching for Manipulation Gold Futures are currently sitting in the Accumulation phase of an AMD sequence. Price is ranging just above the Daily/H4 FVG demand zone (3350–3360) after rejecting supply at 3387–3394.
Here’s what I’m watching:
Accumulation: Current consolidation between 3368–3387.
Manipulation: A clean sweep of yesterday’s low (3368) would complete this phase.
Distribution: If manipulation plays out, I’ll look for price to rotate higher, targeting 3387 → 3404 and potentially higher levels.
⚖️ Bias: Waiting for liquidity run before positioning long.
No need to rush — the sweep is the confirmation. Until then, patient observation.

AUDCAD - OUTLOOKMy current view on AUDCAD. expecting CAD continue to strengthen in the coming weeks, and in-turn, expecting weak AUD in AUDCAD.
"May fortune attend thee, and thy trade prosper." .......L2Earned

SHORT ON GBP/USDGU is ready to fall after a CHOC to the downside from a major supply area.
Dollar is also strong pushing to the upside which will cause pound to fall in this pair.
Looking to catch 200-400 pips on GU.

GC Futures – Will Bulls Defend the Daily/H4 FVG Overlap?Gold Futures opened the week pressing directly into a stacked Daily + H4 FVG demand zone (3350–3360). Price action is sitting just above this level, making it the key battleground for the week.
Support: 3350 (FVG low), 3332 liquidity sweep
Resistance: 3377 → 3394 (prior D-H), 3451 (M-H)
Scenarios: Bounce off demand could target 3380–3394, with a reclaim opening 3420–3450. Failure here points to deeper liquidity at 3332.
Asian session may set the early range, but real direction likely comes during London/NY killzones. Watching closely for reaction inside the FVG overlap.

EURUSD: Support & Resistance Analysis For Next Week 🇪🇺🇺🇸
Here is my structure analysis and important supports & resistances
for EURUSD for next week.
Consider these structures for pullback/breakout trading.
❤️Please, support my work with like, thank you!❤️
I am part of Trade Nation's Influencer program and receive a monthly fee for using their TradingView charts in my analysis.

DXY ready to drop again?DXY has done false breakout in the beginning of the week with strong rejection to the upside. Upon rejection, price has pulled back to 38.2% fib along with daily resistance retest and price has strongly rejected from 98.70 showing further downside with another wave to 98.32 has rejected with strong liquidity candle that continue to drop as 4h, has formed liquidity candle with false breakout at 98.00, there is higher probability to drop to support.

Gold Futures – Waiting for the Flush Before the Long (Asian KillMarket Context:
Gold is sitting right inside a confluence zone — overlapping Daily + H4 Fair Value Gaps at 3,375–3,380. This zone also aligns with the lower boundary of last week’s range (W-L at 3,397).
What I’m Watching:
Going into the Asian Killzone, I’m looking for an impulsive spike down into this FVG.
This move would ideally push below 3,375, tag liquidity, and create DOM excess — the kind of aggressive selling that often marks exhaustion before reversal.
ADX is above 25 and rising, signaling momentum is strong — but we’re at a potential pivot level.
Bullish Setup Criteria:
Flush down into 3,375 or slightly below.
DOM excess showing absorption (stuck sellers).
Strong rejection candle (M1/M5) followed by bullish follow-through.
Targets if Triggered:
T1: 3,397 (Weekly Low)
T2: 3,423 (Daily High)
Stretch: 3,451 (Monthly High)
Invalidation:
1H close below 3,375 without immediate reclaim.
Summary:
Patience is key. I want to see sellers press in during Asia, fail to break down with continuation, and then get run over on a squeeze higher. If we get the right reaction, this could be the start of a strong move into Weekend.

DXY Potential DownsidesHey Traders, in today's trading session we are monitoring DXY for a selling opportunity around 97.900 zone, DXY is trading in a downtrend and currently is in a correction phase in which it is approaching the trend at 97.900 support and resistance area.
Trade safe, Joe.

EURUSD: Important Breakout 🇪🇺🇺🇸
EURUSD keeps rising for the last 2 weeks.
Yesterday, the market went up again and violated
a significant falling trend line
It is another strong bullish signal.
I think that the pair will most likely continue rising
and reach 1.1755 soon.
❤️Please, support my work with like, thank you!❤️
I am part of Trade Nation's Influencer program and receive a monthly fee for using their TradingView charts in my analysis.

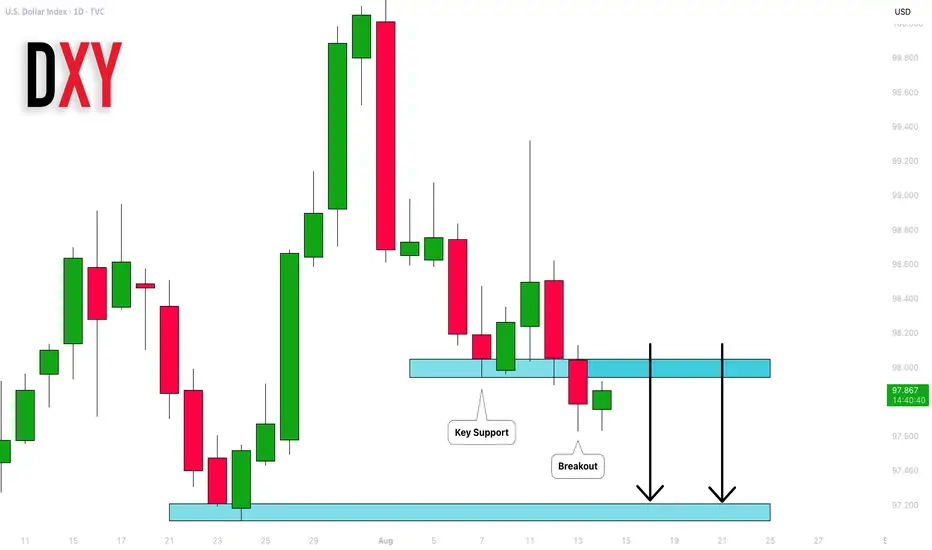
Dollar Index (DXY): Bearish Outlook Explained
US Dollar has a very bearish start of this week.
A violation of a key daily support yesterday leaves
another strong bearish clue.
With a high probability, the market will continue falling
and reach 97.2 support soon.
❤️Please, support my work with like, thank you!❤️
Fundamental Market Analysis for August 14, 2025 GBPUSDEvent to pay attention to today:
15:30 EET. USD - Unemployment Claims
Signs of cooling in the US labor market have pushed futures to expect a series of rate cuts before the end of the year. This, in turn, could lead to a decline in the dollar against the pound sterling. Federal fund futures traders now estimate the probability of a 25 basis point (bp) cut at the September meeting at nearly 94%, compared to 85% before the inflation data was released.
Investors are preparing for the release of the US Producer Price Index (PPI) report on Thursday. The overall PPI is expected to show a 2.5% year-on-year increase in July, while the core PPI is expected to show a 2.9% year-on-year increase for the same period.
Data from the Office for National Statistics (ONS) released on Tuesday showed that the UK unemployment rate remained unchanged at 4.7% for the three months to June, in line with estimates. This is the highest rate since July 2021. Meanwhile, average earnings excluding bonuses remained at 5.0% for the three months to June.
Traders will be watching the UK's second-quarter GDP report closely, as it may provide some clues about the direction of interest rates in the country.
Trading recommendation: BUY 1.3610, SL 1.3570, TP 1.3670

Gold Futures – Bearish Target Hit… But the H4 Gap Still WaitsYesterday’s sessions made their move for the higher bearish target, leaving the H4 & Daily FVG untouched below. This sets up an interesting scenario: will price roll over to fill the gap next, or keep hunting liquidity above?
Key levels and volume profile zones are adjusted for today.
Premium supply zone reached ✅
H4/Daily FVG still in play 📉
Watching London Killzone for impulsive confirmation
Patience is the edge — no clean setup, no trade.

Here is why EURUSD bulls will holdBased on fundamental analysis, the dollar has remained in a risk on mood due to tariffs and the delay of Powell to cut rates. Despite the delay, President Trump has also been threatening the Fed independence making it difficult for the dollar to sustain gains. Technically the pair has been seen to clear sell side liquidity at 1.14500 zones. Therefore, if the pair maintains the momentum it will go to 1.19000

XAUUSD - Daily | UpdateGold is still in the upper range of this consolidation zone. You can see the high of the range is 3430, and the low is 3240 roughly.
Bulls:
Gold has cleared the Bearish FVG, only to pull back into a bullish FVG. If the price is bullish, then we should reject the gap with ease. Gold has just confirmed bullish price action. Look for gold to remain above 3330 and create a higher high.
Bears:
So with that said... If Gold fails to remain bullish above 3330, the price may move to a lower liquidity zone, such as 3300. Watch for gold to give a clear sign of rejection before entering a sell
**New Bearish FVG has form. Possible retest area 3370

Gold Futures: Low ADX Signals Liquidity Play Before TrendGold Futures (MGC) continues to consolidate with ADX below 25 across all timeframes up to the Daily, signaling that the market is not ready to trend just yet.
Yesterday’s session was mostly sideways, building liquidity on both sides of the range. With the H4 and Daily FVG overlap still in play, I’m watching for a potential sweep of yesterday’s low into the Daily FVG zone before any sustained attempt higher.
However, low ADX conditions mean price is more likely to rotate between liquidity pools than run in a clean, one-sided trend. That opens up the possibility of:
Scenario A: Direct sweep of yesterday’s low → fill the Daily FVG → bounce toward midrange.
Scenario B: Fake bullish breakout into untested supply (3,410–3,420) before the low sweep.
Scenario C: Overshoot of the low into the 3,350 HVN before any meaningful reaction.
Plan:
Stay patient, focus on killzone impulsive displacement after liquidity is taken, and keep profit targets tighter — aiming for midrange or HVN instead of chasing extended moves.

AUDUSD: Gold Breakout & DXY Resistance Could Fuel Bulls!!Hey Traders,
In tomorrow’s session, we’re eyeing a buying opportunity on AUDUSD around the 0.65100 zone. The pair remains in an uptrend and is currently in a correction phase, approaching a key support level at 0.65100.
We’re also keeping a bullish bias on Gold, which is attempting to break and hold above 3,400. Given the positive correlation between Gold and AUDUSD, this could lend additional upside momentum to the pair.
Meanwhile, the DXY is approaching the 98.300 resistance. A rejection from this level could serve as a strong catalyst for AUDUSD bulls.
Trade safe, Joe.

EURUSD Under Pressure Ahead of U.S. CPI ReleaseIn line with the dollar’s hold, EURUSD is trading between 1.1580 support and 1.17 resistance, forming a bullish rebound from its 200+ pip drop in July. A clean hold above 1.17 may extend gains toward the 1.18 resistance, with further upside possible toward the 2021 highs — with key levels in sight at 1.20 and 1.24.
On the downside, if the DXY recovery continues, EURUSD may face selling pressure below 1.1580, potentially pulling prices toward 1.1450 and 1.1380. A confirmed break of those levels could open the way for a deeper decline toward 1.12 and 1.11, where renewed bullish positioning may re-emerge.
- Written by Razan Hilal

Is Gold Ready to Break Out from 5-Month Consolidation?Gold has remained in a consolidation phase since April 2025, following its record high of 3500, trading within a narrowing range between 3450 resistance and 3260 support. With tariff-related news easing, price action has softened slightly but continues to hold within the consolidation zone near 3350, awaiting confirmation from the CPI print to either reinforce dollar weakness and rate cut expectations or reverse the current narrative.
Technically, a clean hold above 3400 and 3450 could extend the rally beyond the 3500 record, toward the 3780 level first, and the 4000 checkpoint second.
To the downside, a close below 3260 would open further risk toward 3130 and 2980, potentially offering another long-term accumulation zone.
Written by Razan Hilal, CMT

BTC vs DXY: BTC is going for another topAs we can seen from the chart, BITGET:BTCUSDT and TVC:DXY has a reverse correlation. A bottom for DXY means a top for BTC. From 3 Months timeframe perspective, we can see that we are close to the top of Bitcoin, which is potentially happen in the middle of Q4 2025.
