EURUSD: Bearish Move From Resistance Confirmed 🇪🇺🇺🇸
EURUSD finally retested a broken structure that I showed you earlier.
There is a high chance that the pair will continue retracing from that,
following a formation of a double top pattern and bearish imbalance.
Goal - 1.152
❤️Please, support my work with like, thank you!❤️
I am part of Trade Nation's Influencer program and receive a monthly fee for using their TradingView charts in my analysis.
Dollar

DXY Near 100 as Rate-Cut Odds Fade and Uptrend Remains IntactHey Traders,
In today’s trading session we are monitoring the US Dollar Index (DXY) for a buying opportunity around the 100.000 zone. The Index is trading in a broader uptrend and currently is in a correction phase, approaching the trend support/resistance area near 100.000.
Structure:
The prevailing trend remains bullish, though price is consolidating and retesting the support/resistance level at 100.000. A solid rebound here could signal a resumption of the upward trajectory.
Fundamentals:
Recent commentary from the Federal Reserve indicates that a rate cut in December is increasingly unlikely. This hawkish tilt supports the Dollar and reinforces the up-trend scenario.
Next move:
Watching how price behaves around 100.000 — if the level holds, the bias remains bullish; a break below would call structural risk into question.
Trade safe,
Joe.

URUSD Faces Pressure Near 1.15100 as DXY Holds Strong Above 100!Hey Traders,
In today’s trading session we are monitoring EURUSD for a selling opportunity around the 1.15100 zone. The pair is trading within a broader downtrend and is currently in a correction phase, approaching the trend resistance at 1.15100.
Structure:
EURUSD continues to form lower highs and lower lows, suggesting that sellers remain in control. The 1.15100 zone stands as a key resistance where bearish momentum could resume.
Fundamentals:
This setup aligns with the recent DXY analysis, where the Dollar Index is holding firm around 100.000 after hawkish Fed remarks downplayed the likelihood of a December rate cut. A resilient Dollar backdrop strengthens the bearish case for EURUSD as policy divergence continues to favor the greenback.
Next move:
We’ll be watching price action at 1.15100 for potential rejection and continuation lower.
Trade safe,
Joe.

DXY Daily Outlook — Bullish Order Flow Toward Equal HighsHello traders 👋
On the DXY daily chart, we can clearly see that price showed a strong bullish reaction after grabbing liquidity below 96.37, initiating a bullish order flow that, in my view, is still in progress.
The equal highs above the current price act as a potential draw on liquidity and serve as my first bullish target.
However, keep an eye on the trendline liquidity forming below the current price — there’s a possibility that price may sweep this liquidity before continuing higher.
Overall, my bias remains bullish for now.
💌It is my honor to share your comments with me💌
🔎 DYOR
💡Wait for the update!

DXY Bullish Continuation Risks Challenge the 100.20-ResistanceOn the daily chart, the DXY’s rebound from its 17-year support near 96 resembles an inverted head-and-shoulders breakout, currently testing the 100.20 resistance.
A confirmed close above this level would complete the pattern, targeting the 101.80 and 103.40 levels — moves that could potentially pressure GBPUSD toward 1.2940 and 1.2740, as detailed in the following charts.
From the downside, if the DXY retreats below 99.40, the selling pressure on major currencies may ease. In that scenario, the DXY is expected to retest the neckline and validate the inverted head-and-shoulders formation, with the trendline connecting consecutive lower highs from May to August, between 98.50 and 98.00.
- Razan Hilal, CMT

DXY & final liquidityFundamental Analysis :
Based on the current macroeconomic backdrop, the U.S. Dollar Index (DXY) appears to be entering a short-term corrective move to the upside, potentially toward the 100–101 liquidity zone, before resuming its broader bearish trend.
This aligns with the visible Head & Shoulders structure and the small Quasimodo (QM) zone that’s likely to attract liquidity before a larger downside move.
Short-Term View (Correction Toward 101):
Recent U.S. employment and retail sales data have shown relative strength, leading markets to delay expectations for Fed rate cuts.
U.S. 10-year Treasury yields have seen a mild recovery, prompting short-term dollar demand as investors rebalance risk exposure.
The Federal Reserve’s “data-dependent” stance keeps the market uncertain ahead of the next inflation releases, providing a temporary bid for the dollar.
➤ This corrective phase corresponds to the small QM zone (100–101) where liquidity collection and retesting of previous resistance are likely.
Medium- to Long-Term View (Bearish Reversal After 101):
Core inflation (PCE) continues to trend lower, approaching the Fed’s 2.5% target range.
Labor market softness is becoming more visible through higher unemployment and slowing wage growth.
The probability of rate cuts beginning in early 2026 is increasing, which would significantly reduce the dollar’s yield advantage.
Meanwhile, other major economies (Europe, China, Japan) are stabilizing, which could rebalance global demand away from the USD.
Additionally, rising U.S. government debt and fiscal deficit concerns are weighing on real yields and long-term dollar sentiment.
➤ These factors suggest that once liquidity is collected near 101, DXY could begin a new bearish leg toward the 95–92.5 demand zone.
The current upward move in the dollar is likely a final liquidity grab before the next major decline.
From a fundamental perspective, this aligns with short-term resilience in economic data, followed by an eventual shift toward monetary easing and weaker growth momentum — perfectly in line with technical scenario.

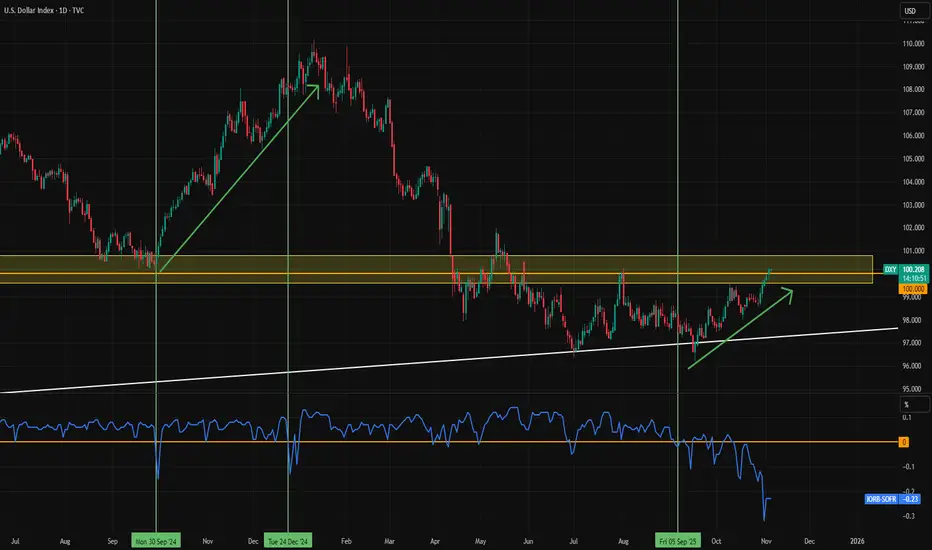
Dollar Rises Amid Record US Shutdown and Liquidity ShortageThe dollar index is climbing as the US faces its longest government shutdown on record. The FRED:SOFR rate is trading 0.23 percentage points above the FRED:IORB , signaling a liquidity shortage. Unfortunately, TradingView data doesn’t cover the 2019 liquidity crunch, but the current situation looks similar.
Earlier this week, Logan highlighted the elevated repo rate and noted that the Fed may need to step in and purchase assets if conditions persist. The liquidity shortage is putting upward pressure on the dollar index. A breakout above 101 could accelerate that pressure further.
If the US shutdown ends, renewed government spending could ease the liquidity strain, allowing the dollar to retreat. Until then, upward momentum is likely to continue.
Could reduced Fed rate-cut expectations keep the dollar strong?
The dollar index extended its gains as the Fed’s increasingly cautious stance on additional rate cuts strengthened sentiment.
Dallas Fed President Logan noted that without clear evidence of inflation falling or a sharp cooling in the labor market, another rate cut in December would be difficult to justify. Similarly, Cleveland Fed President Hammack emphasized the need to maintain a degree of tightening to bring inflation back to target.
Meanwhile, the federal government shutdown reached its 35th day, tying the record from Trump’s first term. The CBO estimated that the shutdown has already shaved about 1% off Q4 GDP, with the impact potentially widening to 2% by the end of November if it continues.
DXY extended its uptrend, briefly testing the resistance at 100.20. Diverging bullish EMAs indicate a potential extension of bullish momentum. If DXY breaches above 100.20, the index may advance toward the following resistance at 100.50. Conversely, if DXY breaks below 100.00, the index could retreat toward the next support at 99.50.

Waiting on the Sweep – ADP Should Provide the CatalystChoppy week so far with price distributing and grinding lower. Last week’s low still hasn’t been taken, so my macro target remains the same. I’m looking for ADP tomorrow during NY session to provide the volatility needed to run liquidity and complete that sweep.
Not predicting direction on the release itself — I’ll be waiting for a liquidity grab and displacement before considering an entry. If price runs stops above today’s Asia high or drives directly into last week’s low, I’ll be watching for the post-news retrace to an FVG/structural level to participate.
Patience here — the move is close, but confirmation > anticipation.

SHORT ON USD/CHFusd/chf has broken a major high and is over brought.
Currently getting multiple rejections from creating new highs.
Dxy is also set to fall.
I will be selling USD/CHF to the next level of demand/support looking to catch 100-150 pips.

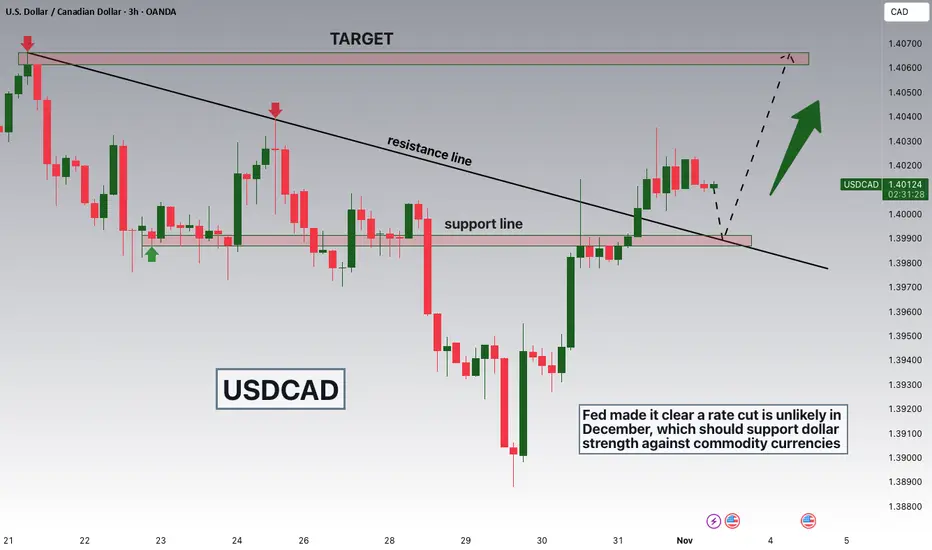
USDCAD Breakout and Potential RetraceHey Traders, in today's trading session we are monitoring USDCAD for a buying opportunity around 1.39900 zone, USDCAD was trading in a downtrend and successfully managed to break it out. Currently is in a correction phase in which it is approaching the retrace area at 1.39900 support and resistance area.
Fundamentally fed made it clear that a rate cut is unlikely in December which should strengthen the dollar against commodity currency!
Trade safe, Joe.
After a long pause, I'm backIt's been a minute since I've posted or traded. As it happens trading drew me back. Let's see the first position I've taken.
We've got ourselves a downtrend on euro-dollar since sep, and around the 1.15 area is my trade. Is it risky? Yes. But, I'll only give it 2-3 options to be able to break further down or need an extra super strong signal of bullish momentum to change my view.
Initial stop will be very close: 1.1545
First tp is @1.1454
RR is 1:2.

Dollar Index (DXY): Confirmed BoS
Dollar Index keeps following our plan.
The market closed on Friday, breaking a previous local high
and setting a new higher high higher close with a confirmed BoS.
We can expect more growth and a highly probable test of 100.0 level soon.
❤️Please, support my work with like, thank you!❤️
I am part of Trade Nation's Influencer program and receive a monthly fee for using their TradingView charts in my analysis.

Gold Futures (MGCZ2025) — Weekly FVG Magnet & Potential ReversalPrice has been respecting Standard Deviation levels beautifully across the H4, Daily, and Weekly timeframes. The market recently rejected the H4 FVG and is now hovering mid-range, with a Weekly Fair Value Gap left open below.
This imbalance could attract price early in the week, creating a liquidity grab and possible weekly low before Gold flips bullish again.
Key Levels:
🟤 H4 FVG rejection zone: 4,040 – 4,080
🔵 Weekly FVG target: 3,880 – 3,900
⚫ Weekly High: 4,124
⚫ Weekly Low: 3,901
Narrative:
I’m expecting price to push into the Weekly FVG discount zone early in the week — potentially aligning with high-impact financial news — and then reverse bullish for a mid-week or end-of-week rally.
Watch For:
Price displacement or BOS near the Weekly FVG
Killzone reactions (London & NY)
Volume and order flow confirmation before entering
Bias: Short-term bearish → medium-term bullish
Invalidation: Sustained trade below 3,842 (Weekly Lows & -1σ zone breach)

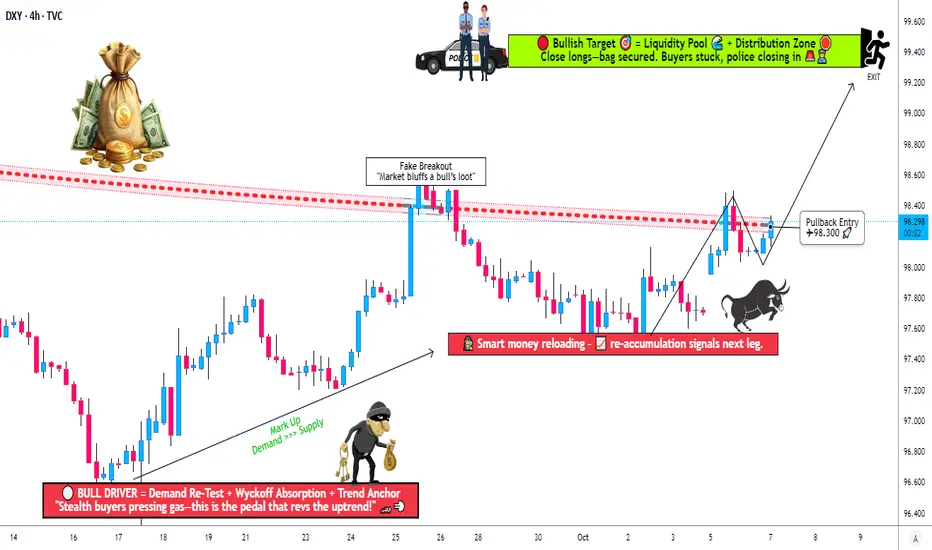
DXY Breakout Confirmed — How Far Can Bulls Run?💰 Thief’s Heist: DXY Bull Raid in Progress ⚡ Layered Entry Strategy!
📈 Setup Summary
Asset: DXY Dollar Index (Cash)
📊 Bias / Plan: BULLISH — 0.786 Triangular Moving Average was breached by buyers → trend confirmation in progress 🚀
🎯 Thief’s Game Plan (Swing / Day Trade)
🕵️ Entry Plan — “Layered Thief Style”:
💎 Any price level entry is valid — flexibility is the Thief’s advantage!
🔹 Sample Limit Layers:
• 97.800
• 98.000
• 98.200
(💡 You can increase or reduce layers based on your own style — stack smartly!)
🧨 Stop Loss (Thief SL):
⚠️ 97.400 → This is the “Thief SL Zone”
👉 But you’re the mastermind — set your own SL if you prefer!
💰 Target Zone (TP):
🚧 Police Barricade at ~99.400 — strong resistance area + oversold trap likely
💨 Thieves escape with bags before the trap closes!
⚙️ Take profit partially or fully at your own comfort — be swift, be smart 🦅
🧩 Market Insight & Technical Reasoning
✅ 786 Triangular MA breach confirms bullish structure
✅ DXY strength often follows Treasury Yield push 📈
✅ Strong USD = Weak Gold & EUR/USD usually
✅ Oversold readings hint buyers ready to counter attack
🔗 Correlation Watchlist (Related Pairs)
Keep an eye on these for confirmation 🔍
💶 FX:EURUSD → usually inverse to DXY
💷 FX:GBPUSD → tracks EUR/USD correlation
💴 FX:USDJPY → directly correlates with DXY
🥇 Gold ( OANDA:XAUUSD ) → moves opposite to DXY
💵 TVC:US10Y Yields → rising yields = bullish DXY
💡 Key Tip:
When EUR/USD & GBP/USD drop sharply + yields rise → DXY often continues its rally 🧭
⚠️ Notes & Thief Disclaimers
👑 Dear Ladies & Gentlemen (Thief OGs):
I’m not recommending my SL or TP — make your own risk rules 💼
You can make money, take money, or just watch the play unfold 🎭
This is a “Thief Style” strategy, shared for fun & educational inspiration only 🧠
Always manage risk & protect capital first — thieves survive by escaping, not over-staying 💨
✨ “If you find value in my analysis, a 👍 and 🚀 boost is much appreciated — it helps me share more setups with the community!”
Disclaimer: this is thief style trading strategy just for fun
#DXY #USDIndex #Dollar #Forex #LayeredEntry #SwingTrade #DayTrade #ThiefStrategy #TrendBreak #SmartMoney #TechnicalAnalysis #USD #TradingView #FXStrategy
Is the Gold Bull Market Over? Gold has had a double digit correction form the all time high.
Pulling back just over 11% is very healthy if the bull market trend is to resume.
On an intra day 4 hour time frame gold is still looking very weak.
However the weekly pattern was able to hold a key weekly bullish level.
Gold is at a very tricky inflection point so i would personally wait until you get some key breakout or breakdown signals.
Look towards your miners to see if they are gaining additional liquidity. They will often lead.

NZDUSD Faces Pressure as Hawkish Fed Supports Dollar Strength!!!Hey Traders, in tomorrow’s trading session we are monitoring NZDUSD for a selling opportunity around the 0.57450 zone. The pair is trading within a broader downtrend and is currently in a correction phase, approaching the trendline and resistance area at 0.57450.
From a fundamental perspective, the Federal Reserve’s recent hawkish remarks—hinting that rate cuts in December are unlikely—have provided renewed support for the U.S. Dollar, adding downside pressure to risk-linked currencies like the NZD.
If the pair rejects the 0.57450 zone with strong bearish momentum, further continuation toward recent lows could be expected.
Trade safe,
Joe

EURUSD: Support & Resistance Analysis For Next Week 🇪🇺🇺🇸
Here is my latest structure analysis and
important supports & resistances for EURUSD for next week.
Consider these structures for pullback/breakout trading.
❤️Please, support my work with like, thank you!❤️
I am part of Trade Nation's Influencer program and receive a monthly fee for using their TradingView charts in my analysis.

Multiple time Standard Deviation PlaybackGoing over a playback looking at how a Standard Dev indicator works in finding levels of support and resistance. This helps to fins good areas to take profit or where price might just turn around. Good Pivotal points.

DXY Continuing the bullish trend?DXY Weekly Outlook
The dollar has been bullish over the past few weeks, continuing to break structure to the upside. I expect this momentum to carry on a bit further, but as price approaches a strong supply zone, we could see some short-term downside.
This potential pullback would likely cause a temporary push-up for EU and GU before the dollar resumes its bullish move overall.
I don’t trade the dollar directly, but I use it as confluence for my main pairs — and right now, it aligns perfectly with my EU and GU outlooks.
Key Levels:
Possible bullish reaction around 99.600
Potential bearish reaction around 100.000 (psychological level)

Gold Futures (MGCZ25) – Monthly Close SetupPrice has ranged all week between 4040 and 3930. With an H4 FVG still sitting above, we might see one last liquidity grab before the next directional move.
⚖️ Neutral bias for now — watching for clean displacement at range extremes.
📍 If price reclaims 4040 → possible push into the H4 FVG.
📍 If it rejects and drops below 4020 → lower FVG fills toward 3930 could be next.
#Gold #Futures #ICT #MarketStructure #NOFOMO

Stronger dollar, ETF outflows: buy only confirmed dips__________________________________________________________________________________
Market Overview
__________________________________________________________________________________
BTC is consolidating after a reject below 115–116k, holding above 111.7k/110k in a corrective pullback within a still-up 12H/1D trend. Near-term macro flows (firmer USD, ETF outflows) cap bounces for now.
Momentum: Mildly bearish/corrective 📉 — pullback from 115–116k; upside capped until 114.6k is reclaimed.
Key levels:
- Resistances (HTF/4H) : 112.7k–114.6k (4H/1D supply), 115.4k–115.6k (1D pivot), 119.9k–120.45k (HTF).
- Supports (HTF/LTF) : 111.7k (HTF pivot), 110k (intraday shelf), 108.5k–107.4k (HTF + ISPD 30m zone).
Volumes: Very high on 1H/30m during the selloff; 1D volumes normal.
Multi-timeframe signals: 1D/12H Up; 6H/4H/1H/30m corrective; 2H basing — 111.7k/110k defense is key; a firm reclaim above 112.7k would aid bulls.
Risk On / Risk Off Indicator: NEUTRAL SELL — aligns with near-term hesitation and favors confirmed signals at support.
__________________________________________________________________________________
Trading Playbook
__________________________________________________________________________________
Primary trend constructive but capped by 114.6–116k; favor confirmed buy-the-dip and tactical sells on clear rejections.
Global bias: Cautious neutral-sell; tactical invalidation on a clean reclaim/close > 114.6k.
Opportunities:
- Buy: Confirmed bounce at 111.7k/110k (wick + 2H/4H close), target 112.7k then 114.6k.
- Deep buy: 108.5k–107.4k with 12H/1D bullish rejection; add above 112.7k.
- Tactical sell: Rejection at 112.7k–114.6k with rising sell volume, target 111.7k then 110k.
Risk zones / invalidations: Acceptance below 107.4k opens 105k then 102.7–102.9k; daily close > 115.6k invalidates shorts and unlocks 120k.
Macro catalysts (Twitter, Perplexity, news):
- Fed: 25 bps cut, QT ends Dec 1; near-term hawkish tone, firmer DXY.
- US BTC ETFs: notable daily outflow — headwind for follow-through.
- Synchronized light easing (HKMA, Saudi) + Eurozone GDP beat — mixed macro signal.
Action plan:
- Entry: 108.5k–107.4k on a strong 12H/1D bullish rejection.
- Stop: ~0.8–1.0% below 107.2k (or confirmed close below the floor).
- TP1: 111.7k; TP2: 112.7k–113.0k; TP3: 114.6k; Approx R/R: ~2.0–3.0R depending on execution.
__________________________________________________________________________________
Multi-Timeframe Insights
__________________________________________________________________________________
HTFs (12H/1D) remain up, while LTFs correct and probe nearby supports.
1D/12H: Uptrend with controlled pullback; 114.5–116k acts as ceiling; 111.7k is the key hold.
6H/4H/1H/30m: Corrective pressure, sellers active into 112.7k–114.6k; a flush to 108.5k–107.4k can offer better asymmetry.
2H: Attempting to base above 110k; a firm reclaim over 112.7k would improve MTF confluence.
Major signals: LTF very high sell volume vs normal 1D — wait for clean confirmations before adding risk.
__________________________________________________________________________________
Macro & On-Chain Drivers
__________________________________________________________________________________
Macro tilts cautiously risk-off near term (firmer dollar, ETF outflows) even as medium-term policy shifts are supportive.
Macro events: Fed -25 bps and QT to end Dec 1, near-term hawkish tone; DXY firmer; light synchronized easing (HKMA, Saudi) and better Eurozone GDP.
Bitcoin analysis: US ETF net outflows weigh on rallies; ~111.2k support watched and ~120k pivot as the gateway to 130k+ if reclaimed.
On-chain data: Elevated LTH distribution, STH stress; reclaiming ~113k STH cost basis would aid momentum.
Expected impact: Confirms a “buy dips on confirmation” bias while keeping size conservative until USD/flows improve.
__________________________________________________________________________________
Key Takeaways
__________________________________________________________________________________
Corrective consolidation below 114.6–116k with 111.7k/110k as first defense.
- Overall trend: HTF bullish, short-term neutral/bearish.
- Top setup: Confirmed dip-buy at 108.5k–107.4k, add on reclaim > 112.7k.
- Key macro factor: Firmer DXY and ETF outflows cap upside momentum.
Patience and disciplined execution on clean signals — that’s how to win this range.

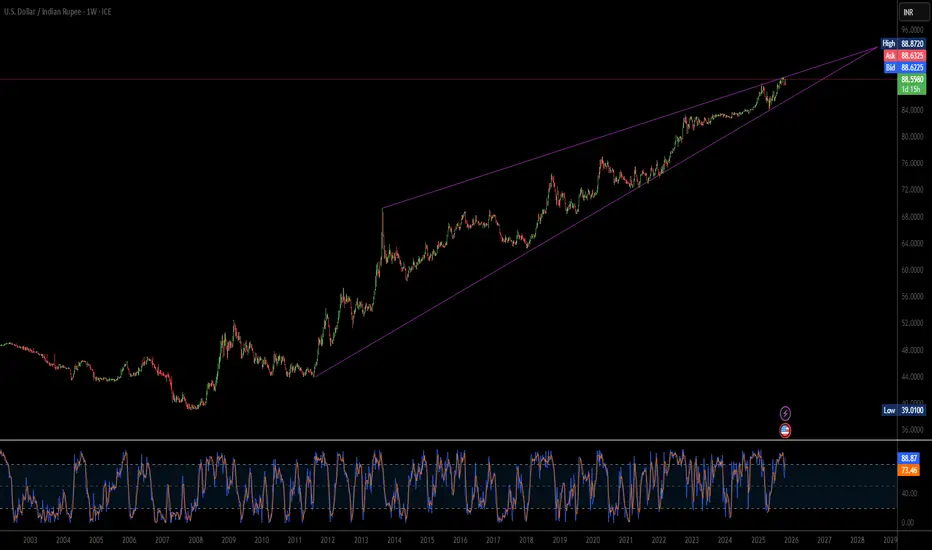
Why Is The Rupee Falling When The Dollar Is Weak?The Indian Rupee (INR) is exhibiting a pronounced, sustained weakness against the US Dollar (USD), pushing the USD/INR pair toward the 88.60 level, even as the global US Dollar Index (DXY) shows signs of softness. This resilience in the USD/INR confirms that domestic and structural headwinds—rather than external dollar strength—are primarily responsible for the Rupee's depreciation. A deep analysis across strategic, economic, and technological domains reveals that geopolitical delays and cautious monetary policy abroad are significantly outweighing any temporary relief from global dollar flows.
The central source of this structural weakness stems from two major factors: geopolitical uncertainty and macroeconomic policy divergence. The persistent delay in finalizing a comprehensive trade agreement between the US and India fuels Foreign Institutional Investor (FII) anxiety, leading to hesitant capital inflows. While FIIs showed a brief surge in buying, overall conviction remains low without a clear trade resolution. Concurrently, the US Federal Reserve's commitment to a "higher-for-longer" interest rate floor, despite a recent cut, strengthens the relative appeal of the USD. This policy stance attracts global capital to US assets, thereby limiting liquidity and increasing the cost of holding the INR.
Furthermore, India’s technological landscape adds to the structural demand for the USD. Low domestic Research & Development (R&D) investment and a heavy reliance on foreign patents mean the nation must spend more USD to import essential high-tech equipment and intellectual property. This technological deficit creates a persistent, structural requirement for foreign currency, putting continuous pressure on the Rupee. From a technical analysis perspective, the USD/INR pair's decisive hold above the 20-day Exponential Moving Average (EMA) confirms the market's bullish bias, suggesting the current trend is robust and targeting the all-time high of 89.12.
In essence, the Rupee's struggle is a complex interplay of internal and external structural factors. Until a major trade deal is confirmed, capital inflows become more decisive, or India's technological import needs stabilize, the market will continue to favor the USD. Traders must recognize that the technical path of least resistance for the USD/INR is upward, driven by these fundamental geopolitical and economic asymmetries rather than temporary movements in the global dollar index.