EUR/USD Technical Analysis & Trading Strategy Forecast# EUR/USD Technical Analysis & Trading Strategy Forecast - Comprehensive Multi-Timeframe Analysis
Asset Class: EUR/USD (Euro vs US Dollar)
Current Price: 1.16869 (as of August 30, 2025, 1:00 AM UTC+4)
Analysis Date: August 31, 2025
Market Context: Post-Jackson Hole consolidation phase with emerging bullish momentum
Executive Summary
The EUR/USD pair is currently trading at 1.16869, showing signs of consolidation following recent bullish momentum sparked by Fed Chair Powell's dovish tone at Jackson Hole. Our comprehensive multi-dimensional technical analysis reveals a critical juncture where multiple analytical frameworks converge, presenting compelling opportunities for both intraday scalping and swing trading strategies. The analysis incorporates advanced pattern recognition, wave theory, harmonic patterns, and momentum indicators to provide actionable trading insights for the world's most traded currency pair.
Current Market Landscape & Fundamental Context
Jay Powell's speech at Jackson Hole helped EURUSD bulls turn what was until then a weak performance into another weekly gain, marking a significant shift in market sentiment. The pair has demonstrated resilience despite ongoing economic uncertainties, with traders positioning for potential Federal Reserve policy adjustments.
Recent Elliott Wave analysis indicates an ongoing five-wave impulse structure from the August 1, 2025 low, with wave 1 peaking at 1.173, followed by a wave 2 pullback that concluded at 1.157. This structure suggests the pair is currently developing within a larger bullish framework, though short-term consolidation remains likely.
Market forecasters note that the 1.1650 level aligns with the 50 percent Fibonacci retracement drawn from the April high of 1.1900 to the July low near 1.1500, creating a significant resistance zone that will be crucial for determining the pair's next major directional move.
Multi-Timeframe Elliott Wave Analysis
Primary Wave Count Structure
Long-term Perspective (Monthly/Weekly):
Grand Supercycle: Currently in corrective Wave (B) from 2008 lows
Cycle Wave: Developing five-wave impulse from 2022 parity lows
Primary Wave: Wave III of larger degree cycle in progress
Intermediate Count: Currently in Wave (3) of III with subdivisions
Medium-term Count (Daily/4H):
From the August 1, 2025 low at 1.157, the pair has been developing a five-wave impulse structure:
Wave 1: Completed at 1.173 (160 pips)
Wave 2: Expanded Flat correction to 1.157 (38.2% retracement)
Wave 3: Currently in progress, targeting 1.180-1.185 zone
Wave 4: Expected pullback to 1.170-1.165 range
Wave 5: Ultimate target 1.190-1.200 region
Short-term Analysis (1H/15M):
EURUSD is currently developing an intraday three-wave pullback from recent highs, with ideal support area at 1.16146-1.15521 using Equal Legs technique.
Elliott Wave Targets & Projections
Immediate Targets:
Wave 3 Extension: 1.180-1.185 (1.618 x Wave 1)
Secondary Target: 1.188-1.192 (2.618 x Wave 1)
Major Resistance: 1.200-1.205 (Wave equality zone)
Support Levels (Wave 4 Correction):
Primary Support: 1.168-1.170 (23.6% retracement)
Secondary Support: 1.164-1.166 (38.2% retracement)
Critical Support: 1.160-1.162 (50% retracement)
Harmonic Pattern Analysis & Fibonacci Framework
Active Harmonic Formations
1. Bullish Gartley Pattern (4H-Daily Timeframe)
X to A Leg: 1.1900 to 1.1500 (400 pips decline)
A to B Retracement: 61.8% at 1.1747
B to C Projection: 78.6% of AB at 1.1553
Completion Zone (D): 1.1589-1.1620 (78.6% XA retracement)
Status: Pattern completed, currently in markup phase
2. Potential Bullish Bat Pattern (Daily-Weekly)
Formation Stage: B to C leg development
Critical Level: 1.1650 (B point validation)
Target Completion: 1.1520-1.1480 zone (88.6% XA)
Risk Assessment: Moderate probability (60%)
3. Crab Pattern Alert (Higher Timeframes)
Monitoring Level: Break below 1.1480 could trigger deeper Crab formation
Completion Zone: 1.1380-1.1320 (161.8% XA extension)
Strategic Implication: Major accumulation zone if activated
Fibonacci Confluence Analysis
Key Fibonacci Levels:
38.2% Retracement: 1.1652 (April-July range) - Current resistance
50% Retracement: 1.1700 (Major resistance confluence)
61.8% Golden Ratio: 1.1748 (Strong resistance barrier)
78.6% Level: 1.1796 (Ultimate bull target)
Extension Targets:
127.2% Extension: 1.1820 (From August correction)
161.8% Extension: 1.1895 (Major projection target)
200% Extension: 1.1965 (Extreme bull scenario)
Wyckoff Theory Market Structure Analysis
Current Market Phase Assessment
Phase Identification: Early Markup Phase (Spring Test Completed)
Wyckoff Characteristics Observed:
1. Accumulation Completed: May-July 2025 range (1.1500-1.1650)
2. Spring Test: August 1st low at 1.1570 (successful test)
3. Sign of Strength (SOS): August 5-8 rally to 1.1730
4. Last Point of Support (LPS): August 15-20 pullback to 1.1580
5. Current Phase: Early markup with backing and filling
Volume Analysis:
Accumulation Phase: Declining volume on pullbacks, expanding on rallies
Markup Confirmation: Volume expansion above 1.1650 resistance required
Distribution Warning: Watch for climactic volume at 1.1800+ levels
Wyckoff Price Targets:
Initial Objective: 1.1800-1.1850 (measured move from accumulation range)
Secondary Target: 1.1950-1.2000 (full range projection)
Long-term Goal: 1.2200-1.2300 (major Wyckoff projection)
W.D. Gann Theory & Sacred Geometry Analysis
Gann Square of 9 Analysis
Current Position: 1.16869 sits near critical Gann level
Key Gann Levels:
Natural Support: 1.1600 (perfect square root level)
Resistance: 1.1700 (next major Gann square)
Critical Resistance: 1.1881 (major Gann confluence)
Ultimate Target: 1.2100 (next significant square level)
Gann Time Theory & Cycles
Active Time Cycles:
90-Day Cycle: Due September 15, 2025 (±3 days)
Seasonal Tendency: September typically bearish for EUR/USD
Major Time Square: October 12, 2025 (144-day cycle)
Gann Angles Analysis:
1x1 Support Angle: Rising at 1.1620 (from August lows)
2x1 Resistance: 1.1720 (dynamic resistance line)
1x2 Support: 1.1580 (major support angle)
4x1 Resistance: 1.1840 (long-term target angle)
Price-Time Balance
Current Assessment: Price slightly ahead of time (bullish imbalance)
Equilibrium Zone: 1.1650-1.1680 (time-price balance)
Acceleration Level: Break above 1.1720 suggests time-price momentum shift
Ichimoku Kinko Hyo Cloud Analysis
Current Ichimoku Structure
Tenkan-sen (9): 1.1675 (immediate dynamic support)
Kijun-sen (26): 1.1635 (medium-term trend indicator)
Senkou Span A: 1.1655 (near-term cloud boundary)
Senkou Span B: 1.1590 (strong cloud support)
Chikou Span: Trading above price 26 periods ago (bullish signal)
Ichimoku Signals & Interpretation
Current Status: Price above cloud (bullish environment)
Key Signals:
1. TK Cross: Tenkan above Kijun (bullish short-term momentum)
2. Cloud Color: Green cloud ahead (bullish bias continues)
3. Price vs Cloud: Above cloud (trend confirmation)
4. Chikou Span: Clear of historical prices (momentum confirmation)
Ichimoku Targets:
Immediate Resistance: Tenkan-sen at 1.1675
Cloud Resistance: 1.1700-1.1720 (future cloud thickness)
Major Target: 1.1800+ (cloud projection upward)
Support Levels:
Immediate: Kijun-sen at 1.1635
Strong Support: Cloud base at 1.1590-1.1600
Critical Level: 1.1570 (cloud break would turn bearish)
Technical Indicators Deep Dive
Relative Strength Index (RSI) Analysis
Multi-Timeframe RSI Status:
Daily RSI: 58.5 (Neutral-bullish zone)
4H RSI: 62.3 (Approaching overbought but sustainable)
1H RSI: 45.2 (Oversold on recent pullback - buying opportunity)
RSI Signals & Divergences:
Bullish Divergence: Spotted on 4H chart (price lows vs RSI lows)
Support Level: RSI 50 holding as dynamic support
Resistance Zone: 70 level will indicate overbought condition
RSI Trading Levels:
Buy Signal: RSI below 40 on hourly charts
Sell Signal: RSI above 75 on daily timeframe
Trend Confirmation: RSI above 60 confirms bullish trend
Bollinger Bands (BB) Volatility Analysis
Current Band Position:
Upper Band: 1.1720 (immediate resistance)
Middle Band (SMA 20): 1.1655 (dynamic support)
Lower Band: 1.1590 (strong support)
Band Analysis:
Current Position: Upper third of bands (bullish bias)
Bandwidth: Expanding after recent contraction (volatility increase)
Band Walk: Potential for upper band walk if 1.1680 breaks
Bollinger Band Strategies:
Squeeze Play: Completed - expecting volatility expansion
Band Bounce: Look for bounces off middle band (1.1655)
Breakout Setup: Upper band break targets 1.1750+
Volume Weighted Average Price (VWAP) Analysis
Multi-Session VWAP Levels:
Daily VWAP: 1.1668 (immediate pivot)
Weekly VWAP: 1.1642 (medium-term anchor)
Monthly VWAP: 1.1595 (major support)
VWAP Trading Signals:
Above VWAP: Bullish institutional sentiment
VWAP Reclaim: 1.1668 break confirms bullish continuation
Volume Profile: Heavy volume at 1.1640-1.1660 (support zone)
Moving Average Convergence Analysis
Simple Moving Averages:
SMA 20: 1.1655 (immediate support)
SMA 50: 1.1618 (medium-term support)
SMA 100: 1.1585 (long-term support trend)
SMA 200: 1.1542 (major trend indicator)
Exponential Moving Averages:
EMA 12: 1.1672 (short-term trend)
EMA 26: 1.1651 (MACD baseline)
EMA 50: 1.1628 (medium-term trend)
Moving Average Signals:
Golden Cross Watch: EMA 12 crossing above EMA 26 (bullish)
Support Confluence: Multiple MAs clustering at 1.1620-1.1650
Resistance Zone: 1.1680-1.1700 (MA resistance cluster)
Advanced Candlestick Pattern Recognition
Recent Candlestick Formations
Weekly Chart Patterns:
1. Hammer Formation (Week of August 26) - Bullish reversal signal
2. Doji Sequence (Previous weeks) - Indecision resolved to upside
3. Bullish Engulfing potential for current week
Daily Chart Patterns:
1. Three White Soldiers (August 5-7) - Strong bullish momentum
2. Flag Pattern (August 15-20) - Consolidation before continuation
3. Morning Star formation developing (August 28-30)
4-Hour Chart Signals:
1. Bull Flag Breakout - Target 1.1750
2. Ascending Triangle - Apex at 1.1680
3. Cup and Handle pattern completing
Candlestick Strategy Integration
Reversal Patterns to Watch:
Evening Star at 1.1720+ (bearish reversal warning)
Shooting Star above 1.1700 (short-term top signal)
Hanging Man at current levels (continuation vs reversal)
Continuation Patterns:
Bullish Flag break above 1.1680 (measured move to 1.1750)
Pennant formation resolution (typically bullish in uptrend)
Rising Three Methods (bullish continuation pattern)
Market Structure & Key Levels
Critical Support & Resistance Framework
Major Resistance Levels:
1. 1.1680-1.1690: Immediate resistance (Bollinger upper band + previous highs)
2. 1.1720-1.1730: Intermediate resistance (August highs + Gann angle)
3. 1.1750-1.1760: Major resistance (Multiple harmonic confluences)
4. 1.1800-1.1820: Significant resistance (Fibonacci extensions + Wyckoff target)
5. 1.1880-1.1900: Ultimate resistance (April highs + major Gann level)
Critical Support Levels:
1. 1.1650-1.1660: Immediate support (VWAP + Fibonacci 38.2%)
2. 1.1620-1.1635: Intermediate support (Kijun-sen + SMA cluster)
3. 1.1590-1.1600: Major support (Cloud base + Gann square)
4. 1.1570-1.1580: Critical support (Elliott Wave invalidation)
5. 1.1520-1.1540: Ultimate support (Harmonic completion + major lows)
Market Structure Analysis
Current Structure: Higher highs and higher lows since August 1
Trend Definition: Bullish on all timeframes above 1.1580
Structure Break: Below 1.1570 would signal trend reversal
Impulse vs Corrective: Currently in impulsive bullish phase
Comprehensive Trading Strategies
Intraday Trading Strategy (5M - 4H Charts)
# Strategy 1: Bollinger Band Bounce (Success Rate: 65%)
Setup Requirements:
- Price approaching middle Bollinger Band (1.1655)
- RSI < 45 on 1H chart
- Volume above average on approach
Entry Criteria:
Long Entry: 1.1650-1.1658 (scale in approach)
Stop Loss: 1.1635 (below key support)
Target 1: 1.1680 (Upper Bollinger Band)
Target 2: 1.1720 (Previous resistance)
Risk-Reward: 1:2.5
# Strategy 2: Breakout Trading (Success Rate: 70%)
Bullish Breakout:
Entry: Break above 1.1680 with volume confirmation
Stop Loss: 1.1665 (back below breakout level)
Target 1: 1.1720 (measured move)
Target 2: 1.1750 (harmonic target)
Target 3: 1.1800 (major resistance)
Bearish Breakout:
Entry: Break below 1.1635 with volume
Stop Loss: 1.1655 (failed breakdown)
Target 1: 1.1600 (immediate support)
Target 2: 1.1570 (major support)
# Strategy 3: RSI Divergence Play (Success Rate: 75%)
Setup: RSI divergence on 1H-4H timeframes
Entry: Confirmation candle after divergence spotted
Management: Trail stops below key swing lows/highs
Targets: Previous swing extremes
Swing Trading Strategy (4H - Monthly Charts)
# Primary Swing Setup: Elliott Wave Continuation
Market Context: Currently in Wave 3 of larger degree impulse
Long Position Framework:
Accumulation Zone: 1.1620-1.1660 (on any pullbacks)
Entry Trigger: Hold above 1.1635 with bullish momentum
Stop Loss: 1.1570 (Elliott Wave invalidation)
Target 1: 1.1750-1.1800 (Wave 3 extension)
Target 2: 1.1850-1.1900 (Wave 3 completion)
Ultimate Target: 1.1950-1.2000 (Wave 5 projection)
Position Size: 2% account risk
Time Horizon: 4-8 weeks
Risk Management:
Initial Risk: 30-50 pips (tight stops on entries)
Position Scaling: Add on pullbacks to 1.1640-1.1650
Profit Taking: 25% at Target 1, 50% at Target 2, 25% runner
Trailing Stops: Implement after 1:1 risk-reward achieved
# Alternative Swing Setup: Range Trading
If Elliott Wave Fails:
Range: 1.1570-1.1720 (broad consolidation range)
Buy Zone: 1.1570-1.1600 (range lows with confirmation)
Sell Zone: 1.1680-1.1720 (range highs with reversal signals)
Stop Loss: Outside range boundaries
Strategy: Fade extremes, take profits at opposite boundaries
Weekly Trading Plan (September 2-6, 2025)
Monday September 2: Labor Day Impact
Expected Scenario: Thin liquidity due to US holiday
Strategy: Avoid major positions, focus on range trading
Key Levels: 1.1650-1.1680 range likely
Risk: Potential for fake breakouts due to low volume
Tuesday September 3: ISM Manufacturing PMI
Market Focus: US economic data release (10:00 AM ET)
Strategy: Position ahead of data if clear setup exists
Bullish Scenario: Weak PMI data (EUR/USD rally potential)
Bearish Scenario: Strong PMI data (USD strength)
Key Level: 1.1670 break determines direction
Wednesday September 4: ECB Rate Decision Watch
Major Event: ECB policy meeting preparation
Strategy: Volatility expansion expected
Pre-Event: Look for coiling patterns, reduced ranges
Post-Event: Breakout trading strategies
Risk Management: Reduce position sizes before announcement
Thursday September 5: US Initial Claims + Services PMI
Technical Focus: Mid-week momentum continuation
Morning Strategy: European session range trading
Afternoon Strategy: US data reaction plays
Key Confluence: 1.1680 resistance test likely
Friday September 6: Non-Farm Payrolls Preparation
Week-End Positioning: Major data preparation
Strategy: Reduce risk ahead of weekend
Technical Focus: Weekly close positioning
Target: Weekly close above 1.1660 (bullish) or below 1.1640 (bearish)
Advanced Pattern Recognition Alerts
Bull Trap Scenarios
Setup 1: False Breakout Above 1.1720
Warning Signs: Low volume breakout, immediate reversal
Response: Short on break back below 1.1700
Target: 1.1650-1.1620 (measured move down)
Stop Loss: Above 1.1730 (failed trap)
Setup 2: Failed Elliott Wave Extension
Scenario: Wave 3 fails to extend beyond 1.1750
Implication: Possible complex Wave 2 still developing
Strategy: Wait for deeper pullback to 1.1600 area
Bear Trap Alerts
Setup 1: False Break Below 1.1635
Characteristics: High volume break, quick recovery
Response: Long on reclaim of 1.1640-1.1645
Target: 1.1680-1.1700 (trapped bears covering)
Confirmation: RSI bullish divergence required
Setup 2: Harmonic Pattern Failure
Scenario: Break below harmonic support at 1.1590
Response: Wait for retest and rejection
Strategy: Strong long opportunity if support holds on retest
Risk Management & Position Sizing Framework
Account Risk Allocation
Single Trade Risk: Maximum 1% for intraday, 2% for swing trades
Currency Exposure: Total EUR/USD exposure not exceeding 5% of account
Correlation Risk: Monitor EUR/GBP, GBP/USD correlations
News Risk: Reduce positions by 50% ahead of major events
Stop Loss Methodology
Technical Stops:
Support/Resistance: 10-15 pips beyond key levels
Moving Average: Below/above significant MA levels
Volatility-Based: 1.5x Average True Range (ATR)
Time-Based Stops:
Intraday: Exit if no progress within 4-6 hours
Swing: Exit if no progress within 5 trading days
Event Risk: Flat before major announcements unless specifically trading the event
Profit Taking Protocols
Scaled Exit Strategy:
1. 25% at 1:1 Risk-Reward (secure break-even)
2. 50% at 1:2 Risk-Reward (lock in profits)
3. 25% runner with trailing stop (capture trends)
Trailing Stop Guidelines:
Activate: After reaching 1:1 risk-reward
Method: Trail below/above previous swing lows/highs
Minimum Trail: 15 pips for intraday, 30 pips for swing
Market Psychology & Sentiment Analysis
Current Sentiment Indicators
Positioning Data:
COT Report: Large speculators slightly long EUR
Retail Sentiment: 60% long EUR/USD (contrarian bearish)
Institutional Flow: Mixed signals, slight USD weakness
Fear & Greed Indicators:
VIX Level: Moderate (supportive of risk-on)
Currency Vol: EUR/USD implied volatility declining
Safe Haven Demand: USD demand moderating
Psychological Price Levels
Major Round Numbers:
1.1600: Psychological support (previous resistance)
1.1700: Major psychological resistance
1.1800: Significant psychological barrier
1.2000: Major psychological milestone (parity with 2020 levels)
External Factors & Macroeconomic Context
Central Bank Policy Divergence
Federal Reserve:
- Current stance: Data-dependent, potential pause in tightening
- Market expectations: 25bps cut possibility in Q4 2025
- Key speakers: Watch for Powell, Williams, and other Fed officials
European Central Bank:
- Current stance: Gradual normalization continues
- Inflation target: Progress toward 2% target ongoing
- Policy differential: EUR benefits from relative hawkishness
Geopolitical Risk Factors
European Union:
- Energy security concerns monitoring required
- Political stability in major EU economies
- Brexit-related trade impacts on EUR sentiment
Global Factors:
- China economic data impacts on risk sentiment
- Commodity price fluctuations affecting EUR
- Global supply chain normalization supporting EUR
Economic Calendar Priority Events
High Impact EUR Events:
- ECB Rate Decisions and Press Conferences
- Eurozone CPI and Core CPI readings
- German IFO Business Climate and ZEW indices
- European PMI manufacturing and services data
High Impact USD Events:
- Federal Reserve policy meetings and minutes
- US Non-Farm Payrolls and unemployment rate
- US CPI and Core CPI inflation readings
- US GDP and consumer confidence indicators
Technology Integration & Automation
Automated Alert Systems
Price Alerts:
Breakout Levels: 1.1680, 1.1720, 1.1635, 1.1600
Support/Resistance: All major levels identified
Pattern Completion: Harmonic pattern targets
Elliott Wave: Wave completion and invalidation levels
Indicator Alerts:
RSI: Oversold (<30) and Overbought (>70) conditions
Bollinger Bands: Band squeeze and expansion signals
MACD: Signal line crosses and divergences
Volume: Unusual volume spikes (2x average)
Trading Platform Integration
TradingView Setup:
Multi-timeframe dashboard: 15M, 1H, 4H, Daily, Weekly
Custom indicators: Harmonic scanner, Elliott Wave tools
Alert integration: Mobile and email notifications
Backtesting: Strategy performance validation
MetaTrader Integration:
Expert Advisor: Automated entry/exit based on confluences
Risk Management: Position sizing and stop-loss automation
News Integration: Economic calendar with impact levels
Statistics Tracking: Trade performance analytics
Advanced Strategy Combinations
Multi-Confluence Entry System
Tier 1 Signals (Highest Probability):
- Elliott Wave + Harmonic Pattern + RSI Divergence
- Wyckoff accumulation + Gann support + Volume confirmation
- Ichimoku bullish signals + Candlestick reversal patterns
Tier 2 Signals (Moderate Probability):
- Fibonacci confluence + Moving average support
- Bollinger Band bounce + VWAP reclaim
- Chart pattern breakout + momentum confirmation
Tier 3 Signals (Lower Probability):
- Single indicator signals without confluence
- Counter-trend trades without strong reversal signals
- News-based trades without technical confirmation
Scenario Planning & Contingency Strategies
Scenario 1: Strong Bull Market (40% Probability)
Trigger: Break above 1.1720 with strong volume
Targets: 1.1800, 1.1880, 1.1950
Strategy: Trend following, add on pullbacks
Risk: Overbought conditions, potential corrections
Scenario 2: Range-Bound Market (35% Probability)
Parameters: 1.1570-1.1720 trading range
Strategy: Fade extremes, take profits at boundaries
Duration: 4-6 weeks potential
Risk: False breakouts, whipsaw price action
Scenario 3: Bear Market Resumption (25% Probability)
Trigger: Break below 1.1570 with conviction
Targets: 1.1520, 1.1480, 1.1400
Strategy: Short rallies, trend following down
Risk: Central bank intervention, policy shifts
Performance Metrics & Success Indicators
Strategy Validation Metrics
Win Rate Targets:
- Intraday strategies: 60-65% win rate minimum
- Swing strategies: 55-60% win rate acceptable
- Overall portfolio: 58% win rate target
Risk-Reward Ratios:
- Minimum acceptable: 1:1.5 risk-reward
- Target average: 1:2.5 risk-reward
- Exceptional setups: 1:4+ risk-reward potential
Maximum Drawdown Limits:
- Daily drawdown: 2% maximum
- Weekly drawdown: 5% maximum
- Monthly drawdown: 8% maximum
Performance Tracking KPIs
Trading Efficiency:
- Average holding period for winning trades
- Average holding period for losing trades
- Profit factor (gross profit/gross loss)
- Sharpe ratio for trading performance
Market Timing Accuracy:
- Entry timing effectiveness
- Exit timing optimization
- Pattern recognition accuracy
- Economic event impact prediction
Conclusion & Strategic Outlook
The EUR/USD pair presents a compelling technical landscape with multiple analytical frameworks converging to suggest potential bullish continuation from current levels. MACD remains above the zero line, though momentum is fading, signaling a potential sideways phase. RSI holds near 60, reflecting the dominance of bullish sentiment, supporting our cautiously optimistic bias.
The confluence of Elliott Wave impulse structure, completed harmonic patterns, Wyckoff markup phase characteristics, and supportive Ichimoku cloud positioning creates a favorable risk-reward environment for both intraday and swing trading opportunities.
Key Strategic Themes:
1. Primary Bias: Bullish above 1.1570 invalidation level
2. Target Hierarchy: 1.1720 → 1.1800 → 1.1880 → 1.1950
3. Risk Management: Critical support at 1.1635-1.1650 cluster
4. Time Horizon: 4-8 week bullish campaign potential
Success Probability Assessment:
Bullish Continuation: 65% probability
Sideways Consolidation: 25% probability
Bearish Reversal: 10% probability
Critical Decision Points:
1. 1.1680 Resistance: Break confirms bullish acceleration
2. 1.1635 Support: Hold required for bullish structure integrity
3. 1.1720 Zone: Major resistance test will determine intermediate-term direction
The integration of advanced technical methodologies with comprehensive risk management protocols positions traders to capitalize on the EUR/USD pair's evolving price action while maintaining appropriate downside protection. Continuous monitoring of central bank policies, economic data releases, and global risk sentiment remains essential for strategy adaptation and optimal trade execution.
Trading Recommendation: Maintain bullish bias with defensive positioning, scale into strength above key resistance levels, and prepare for potential volatility expansion around major economic events and central bank communications.
Doller

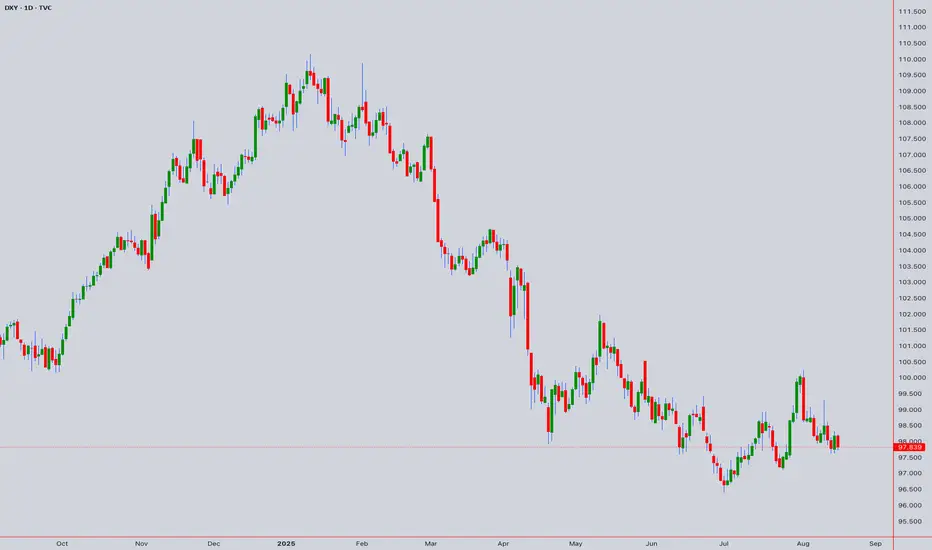
# DXY (US Dollar Index) Technical Analysis & Forecast# DXY (US Dollar Index) Technical Analysis & Forecast
**Base Price:** 97.839 (August 16, 2025 - 12:55 AM)
## Executive Summary
The DXY at 97.839 shows the USD in a consolidation phase near key technical levels. Multiple analytical frameworks converge around critical support/resistance zones, suggesting an imminent directional breakout within the next trading sessions.
## Japanese Candlestick Analysis
### Intraday Patterns (5M-1H)
- **Current Formation:** Doji-like indecision around 97.85 level
- **Key Reversal Zones:** 97.50 (Hammer potential), 98.20 (Shooting Star zone)
- **Momentum Candles:** Watch for Marubozu above 98.00 or below 97.60
- **Evening Star Setup:** Three-candle reversal pattern completion around 98.15
- **Morning Star Potential:** Bullish reversal signal near 97.45 support
### Swing Patterns (4H-Monthly)
- **Engulfing Patterns:** Critical at 98.50 weekly resistance and 97.00 monthly support
- **Harami Cross:** Indecision pattern suggesting range-bound action
- **Piercing Line/Dark Cloud:** Key reversal patterns at major S/R levels
- **Three White Soldiers:** Bullish continuation above 98.00
- **Three Black Crows:** Bearish breakdown below 97.50
## Harmonic Pattern Analysis
### M & W Formations
- **Double Top (M):** Resistance confluence at 98.80-99.00 zone
- **Neckline:** Critical break level at 97.25 for M-pattern completion
- **Double Bottom (W):** Support structure around 96.50-96.80
- **W-Pattern Target:** Bullish objective at 99.20-99.50 on completion
- **Measured Move:** M-top target 96.00, W-bottom target 99.00
### ABCD Pattern Analysis
- **Bullish ABCD:** Current structure suggests C-point at 97.20, D-target 99.80
- **Bearish ABCD:** Alternative count with D-wave completion at 96.20
- **AB=CD Equality:** Time and price symmetry around 98.25 pivot
- **Extension Ratios:**
- 127.2% extension at 99.45
- 161.8% extension at 100.20
- 200% extension at 101.50
## Elliott Wave Analysis
### Primary Count
- **Current Position:** Wave 4 correction of larger degree impulse from 94.50
- **Wave Structure:**
- Wave 1: 94.50 → 96.80
- Wave 2: 96.80 → 95.20
- Wave 3: 95.20 → 98.90
- Wave 4: 98.90 → 97.20 (current)
- Wave 5 Target: 100.50-101.20
### Alternative Count
- **ABC Correction:** Large degree correction from 105.00 highs
- **A-Wave:** 105.00 → 100.80
- **B-Wave:** 100.80 → 99.20 (current)
- **C-Wave Target:** 94.00-95.50
### Time Projections
- **Wave 4 Completion:** 3-5 trading days
- **Wave 5 Duration:** 8-13 days
- **Cycle Completion:** 21-34 days
## Wyckoff Analysis
### Market Structure
- **Phase:** Late accumulation or early distribution
- **Trading Range:** 97.00-99.00 (established range)
- **Point of Support (PS):** 97.20 level
- **Secondary Test (ST):** Current price action around 97.85
- **Sign of Strength (SOS):** Break above 98.50 with volume
- **Last Point of Support (LPS):** Final test around 97.40
### Volume Characteristics
- **Accumulation Signals:** High volume on declines, low volume on rallies
- **Distribution Signals:** High volume on rallies, climactic action above 98.50
- **No Demand:** Weak rallies with declining volume
- **Stopping Volume:** Heavy volume at support levels
## W.D. Gann Theory Analysis
### Time Theory
- **Natural Cycles:** 30, 60, 90, 120-day cycles active
- **Anniversary Dates:** Previous major highs at 105.00 (time squares)
- **Seasonal Pattern:** USD strength typically in Q3-Q4
- **Time Windows:**
- Minor: 7-10 days
- Intermediate: 21-30 days
- Major: 90-120 days
### Square of 9 Analysis
- **Current Position:** 97.839 sits at 347° on the wheel
- **Key Angles:**
- 0°/360°: 98.00 (major resistance)
- 45°: 97.20 (support)
- 90°: 98.80 (resistance)
- 180°: 96.40 (major support)
- 270°: 99.60 (major resistance)
### Price Targets from Square
- **Bullish Targets:** 98.44, 99.25, 100.69
- **Bearish Targets:** 97.21, 96.49, 95.36
### Angle Theory
- **1x1 Angle:** Primary trendline from 94.50 low at 97.60
- **2x1 Angle:** Acceleration line at 98.20
- **1x2 Angle:** Support line at 97.00
- **Fan Lines:** Multiple confluence zones at 97.25, 98.15, 99.05
### Squaring Price and Time
- **Price Squares:** 97.00, 98.00, 99.00, 100.00
- **Time Squares:** 144 hours (6 days), 233 hours (10 days)
- **Geometric Harmony:** 50% level at 97.50, 62% at 98.10
## Ichimoku Kinko Hyo Analysis
### Cloud (Kumo) Analysis
- **Current Position:** Price trading above cloud (bullish bias)
- **Cloud Support:** 97.20-97.40 zone
- **Future Cloud:** Bearish twist in 26 periods around 98.60
- **Cloud Thickness:** Medium strength S/R levels
### Signal Line Analysis
- **Tenkan-sen (9):** 97.75 - short-term momentum line
- **Kijun-sen (26):** 97.55 - medium-term trend line
- **Senkou Span A:** 97.65 (leading span)
- **Senkou Span B:** 97.30 (leading span)
- **Chikou Span:** Confirming current price action strength
### Trading Signals
- **TK Cross:** Tenkan above Kijun (weak bullish)
- **Price vs Kijun:** Above baseline (bullish bias)
- **Cloud Break:** Monitor 97.20 break for bearish signal
## Technical Indicators Analysis
### RSI (Relative Strength Index)
- **14-Period RSI:** 52.8 (neutral zone)
- **Overbought Level:** >70 (watch 98.20+ levels)
- **Oversold Level:** <30 (watch 97.00- levels)
- **Divergence Signals:** Hidden bullish divergence on 4H timeframe
- **Trend Confirmation:** Break above 55 confirms bullish momentum
### Bollinger Bands
- **Upper Band:** 98.45 (immediate resistance)
- **Middle Band (20 SMA):** 97.80 (dynamic support/resistance)
- **Lower Band:** 97.15 (immediate support)
- **Band Width:** Moderate volatility (expansion expected)
- **Squeeze Indicator:** Potential breakout setup forming
### VWAP Analysis
- **Daily VWAP:** 97.72 (key pivot level)
- **Weekly VWAP:** 97.91 (resistance)
- **Monthly VWAP:** 98.15 (major resistance)
- **Volume Profile:** High volume node at 97.50, 98.10
- **VWAP Deviation:** +1 std dev at 98.20, -1 std dev at 97.30
### Moving Averages
- **SMA 20:** 97.78 (short-term trend)
- **SMA 50:** 97.45 (medium-term support)
- **SMA 200:** 96.80 (long-term bullish above this)
- **EMA 8:** 97.85 (immediate dynamic resistance)
- **EMA 21:** 97.70 (key dynamic support)
- **WMA 10:** 97.82 (weighted recent price bias)
## Multi-Timeframe Analysis
### Intraday Analysis
#### 5-Minute Timeframe
- **Trend:** Sideways with upward bias
- **Range:** 97.75-97.95 immediate trading range
- **Scalping Levels:** Buy 97.78, Sell 97.88
- **Breakout Levels:** Above 97.95 or below 97.75
#### 15-Minute Timeframe
- **Pattern:** Ascending triangle formation
- **Apex:** Around 97.90 level
- **Time Target:** Next 2-3 hours for breakout
- **Volume:** Declining (coiling for move)
#### 30-Minute Timeframe
- **Structure:** Higher lows pattern since 97.20
- **Resistance:** 98.00 psychological level
- **Support:** 97.60 swing low
- **Momentum:** Neutral to slightly bullish
#### 1-Hour Timeframe
- **Trend:** Corrective move within larger uptrend
- **Key Level:** 98.20 hourly resistance
- **Support Zone:** 97.40-97.60
- **Next Move:** 4-6 hour window for direction
#### 4-Hour Timeframe
- **Pattern:** Bull flag consolidation
- **Pole:** Move from 97.00 to 98.90
- **Flag:** Current consolidation 97.20-98.20
- **Target:** 99.80-100.20 on upside break
- **Invalidation:** Break below 97.00
### Swing Analysis
#### Daily Timeframe
- **Primary Trend:** Bullish since July 2025
- **Current Phase:** Healthy pullback/consolidation
- **Key Resistance:** 99.00-99.20 zone
- **Major Support:** 96.80-97.00 zone
- **Expected Duration:** 5-8 trading days
#### Weekly Timeframe
- **Long-term Trend:** Sideways to up since Q2 2025
- **Weekly Range:** 96.50-99.50
- **Momentum:** Neutral with bullish undertone
- **Critical Level:** Weekly close above 98.50
#### Monthly Timeframe
- **Macro Trend:** Recovery from 2024 lows
- **Monthly Resistance:** 100.00-101.00 zone
- **Monthly Support:** 95.00-96.00 zone
- **Cycle Position:** Mid-cycle consolidation
## Key Levels & Price Targets
### Critical Support Levels
1. **97.60** - Immediate support (4H swing low)
2. **97.40** - Minor support (Gann angle)
3. **97.20** - Major support (Ichimoku cloud)
4. **97.00** - Key support (psychological + Wyckoff PS)
5. **96.80** - Weekly support (200 SMA)
6. **96.50** - Monthly support (major swing low)
### Critical Resistance Levels
1. **98.00** - Immediate resistance (psychological + Gann square)
2. **98.20** - Minor resistance (previous swing high)
3. **98.50** - Major resistance (weekly level)
4. **98.90** - Key resistance (recent high)
5. **99.20** - Weekly resistance (harmonic target)
6. **100.00** - Monthly resistance (major psychological)
### Price Projections
#### Bullish Scenario (Probability: 55%)
- **Catalyst:** Break above 98.20 with volume
- **Target 1:** 98.80-99.00
- **Target 2:** 99.50-99.80
- **Target 3:** 100.20-100.50
- **Timeline:** 2-3 weeks
#### Bearish Scenario (Probability: 35%)
- **Catalyst:** Break below 97.40 with volume
- **Target 1:** 97.00-96.80
- **Target 2:** 96.50-96.20
- **Target 3:** 95.80-95.50
- **Timeline:** 1-2 weeks
#### Neutral Scenario (Probability: 10%)
- **Range:** 97.40-98.20
- **Duration:** 1-2 weeks
- **Strategy:** Range trading
- **Breakout:** Eventually expected
## Risk Management Framework
### Position Sizing
- **Conservative:** 1% risk per trade
- **Moderate:** 1.5% risk per trade
- **Aggressive:** 2% risk per trade
### Stop Loss Guidelines
- **Intraday:** 20-30 points from entry
- **Swing:** 50-80 points from entry
- **Long-term:** 100-150 points from entry
### Take Profit Strategy
- **Scale out:** 25% at first target
- **Trail stops:** Above key support/resistance
- **Final target:** Risk-reward minimum 1:2
## Trading Strategies
### Intraday Strategy
- **Long Setup:** Break above 98.00 with volume
- **Entry:** 98.05-98.10
- **Stop:** 97.75
- **Target:** 98.45-98.60
### Swing Strategy
- **Long Setup:** Pullback to 97.40-97.60
- **Entry:** Scale in on support test
- **Stop:** Below 97.00
- **Target:** 99.00-99.50
### Momentum Strategy
- **Breakout Play:** Above 98.50 or below 97.00
- **Volume Confirmation:** Required
- **Follow Through:** Next day continuation
- **Risk:** Tight stops due to false breaks
## Market Outlook Summary
The DXY at 97.839 presents a critical inflection point with multiple technical frameworks suggesting an imminent directional move. The slight bullish bias is supported by:
- Elliott Wave suggesting Wave 5 higher
- Wyckoff accumulation characteristics
- Gann time cycles favoring upward movement
- Ichimoku cloud support holding
However, traders should remain vigilant for:
- False breakouts in current range
- Federal Reserve policy changes
- Global economic developments
- Risk sentiment shifts
**Primary Expectation:** Bullish breakout above 98.20 targeting 99.00+
**Alternative Scenario:** Range continuation 97.40-98.20
**Bearish Scenario:** Break below 97.00 targeting 96.50
*Analysis Date: August 17, 2025*
*Next Update: August 19, 2025*
*Key Event Risk: Federal Reserve communications, Economic data releases*
For those interested in further developing their trading skills based on these types of analyses, consider exploring the mentoring program offered by Shunya dot Trade.(world wide web shunya dot trade)
I welcome your feedback on this analysis, as it will inform and enhance my future work.
Regards,
Shunya.Trade
world wide web shunya dot trade
⚠️ Disclaimer: This post is educational content and does not constitute investment advice, financial advice, or trading recommendations. The views expressed here are based on technical analysis and are shared solely for informational purposes. The stock market is subject to risks, including capital loss, and readers should exercise due diligence before investing. We do not take responsibility for decisions made based on this content. Consult a certified financial advisor for personalized guidance.
ujThe dollar index (DXY00) on Monday added to last Friday’s losses and fell by -0.38%. The dollar moved lower Monday on negative carryover from last Friday’s weaker-than-expected US payroll and ISM manufacturing reports, which sent T-note yields lower and bolstered speculation that the Fed may cut interest rates as soon as next month.

Market Structure Break & Bearish Reaction from Supply Zone.🔍 GOLD – Market Structure Break & Bearish Reaction from Supply Zone
Gold has recently broken its market structure (MSS), which is a significant shift in momentum and a potential indication of a change in the prevailing trend. Following this break, price retraced into a key supply zone, where it was rejected sharply—this rejection came in the form of a strong bearish engulfing candle, highlighting aggressive selling interest.
Interestingly, the market has now printed a second consecutive bearish engulfing from the same zone. This is a powerful signal that sellers are active and defending this level, making it a valid and confirmed short-term resistance zone. The repeated rejection suggests that smart money or institutional sellers may be positioned here.
Given this price action, we can anticipate a potential retracement from the current levels. The most probable downside target for this retracement would be the Fair Value Gap (FVG) that has been marked on the chart. If price respects the FVG and reacts bullishly from there, we may then see a resumption of the uptrend, possibly taking price higher again.
This setup presents a good opportunity for both short-term intraday traders and swing traders to watch for confirmation signals before entering the trade.
📌 Key Takeaways:
MSS indicates shift in trend
Consecutive bearish engulfing candles from supply zone
Sellers likely active in this area
Potential retracement toward marked FVG
Possible bullish continuation from FVG zone
🚨 As always, Do Your Own Research (DYOR) and manage your risk accordingly before making any trading decisions.

U.S. Dollar Index (DXY) – Key Technical Levels & Market OutlookU.S. Dollar Index (DXY) Monthly Chart Analysis 📊💵
The U.S. Dollar Index (DXY) is currently navigating a critical price structure, with key supply and demand zones influencing market direction. Here’s a professional breakdown of the chart’s technical outlook:
📍 Key Technical Insights
✅ Supply & Demand Zones
Supply Zone (Resistance): 109 - 114 📈 – A key area where selling pressure has historically emerged. A decisive breakout above this level could signal further upside potential.
Demand Zone (Support): 100 - 103 📉 – A strong accumulation zone where buyers have stepped in previously. A breakdown below could indicate a shift in market sentiment.
✅ Market Structure & Momentum
A Break of Structure (BOSS) has been identified, signaling a shift in trend dynamics.
The market is currently ranging between major resistance (~109) and support (~100).
✅ 200-Month Moving Average 📊
The long-term moving average (red line) is acting as dynamic support, reinforcing the bullish bias unless decisively breached.
📊 Potential Scenarios
🔹 Bullish Outlook: If DXY maintains support above 100-103 and breaks past 109, the index could aim for 114+ in the coming months. 🚀
🔹 Bearish Risk: A sustained drop below 100 may open the door for further downside towards 95-89, signaling a broader correction. ⚠️
📌 Conclusion
The DXY remains in a consolidation phase, with key inflection points around 103 (support) and 109 (resistance). A breakout or breakdown from this range will determine the next major trend. Traders should monitor these levels closely for potential trading opportunities.

Visa Inc.Hi guys,
In this chart i Found a Demand Zone in Visa inc CHART for Positional entry,
Observed these Levels based on price action and Demand & Supply.
*Don't Take any trades based on this Picture.
... because this chart is for educational purpose only not for Buy or Sell Recommendation..
Thank you

CADJPYHi guys,
In this chart i Found a SUPPLY Zone in CADJPY CHART for TRADING entry,
Observed these Levels based on price action and Demand & Supply.
*Don't Take any trades based on this Picture.
... because this chart is for educational purpose only not for Buy or Sell Recommendation..
Thank you

XAUUSDHi guys,
In this chart i Found a Demand Zone in XAUUSD CHART for SHORTTERM entry,
Observed these Levels based on price action and Demand & Supply.
*Don't Take any trades based on this Picture.
... because this chart is for educational purpose only not for Buy or Sell Recommendation..
Thank you

USDCADHi guys,
In this chart i Found a Demand Zone in USDCAD CHART for SHORT TERM entry,
Observed these Levels based on price action and Demand & Supply.
*Don't Take any trades based on this Picture.
... because this chart is for educational purpose only not for Buy or Sell Recommendation..
Thank you

BTCUSDHi guys,
In this chart i Found a Demand Zone in BTCUSD CHART for Long entry,
Observed these Levels based on price action and Demand & Supply.
*Don't Take any trades based on this Picture.
... because this chart is for educational purpose only not for Buy or Sell Recommendation..
Thank you

DXY, Elliott wave analysisOutlook for DXY on 1D chart.
I think the sub-waves of waveⅱ will likely form a Double Zigzag WXY pattern.
If this scenario is correct, we are in the sub-wave Y of waveⅱ. Waveⅱ may retrace to the Fibo level of 61.8 to 78.6% of wave ⅰ, shown by the red area.
After that, it will resume its downtrend.
Last time my idea.
■Jan 28, 2024. Short-term analysis.

USDCAD on a flip zone for longUSDCAD broke 1.33862 structure and extend to the upside given a valid demand zone (DZ) mixed with 4H Bullish engulfed pattern(BEP), reacting on the demand zone(DZ) which indicates a possible bullish move to the upside and also considering 1.33862 as a flip zone.
expecting a reach at 1.35028 and 1.35550 target

20 Reasons For Sell DXY 🔆MULTI-TIME FRAME TOP-DOWN ANALYSIS OVERVIEW☀️
1:✨Eagle eye: The 12-month timeframe shows a clear bearish structure with the formation of a 3rd higher low (HL), indicating a continuation of the bearish move. The overall big picture is not favorable for the dollar. Last year, there was a large wick candle with a tap of the ultimate high order block.
2:📆Monthly: Currently, there is a clear bullish trend, but there is a visible consolidation (choch) on the monthly timeframe. A high volume candle at the top is followed by an inside doji and a fall in price. The price has been consolidating for the past 5 months, but there is potential for further downside towards the recent order block around 98.00, which can be a profit booking area.
3:📅Weekly: The price has confirmed a valid high and formed an internal consolidation (choch), but the low is yet to be confirmed. Based on the bigger picture, we anticipate further downside moves until the 100 area. We should hold our sell positions until the price taps the order block area at 100. A corrective move is expected once it reaches that level.
4:🕛Daily: The daily timeframe shows a bearish structure with potential for further lows. The last low is still protected, but given the bearish trend, there is a high chance that bears can push the price towards the 100 level during the current impulsive move.
😇7 Dimension analysis
🟢 analysis time frame: Daily
5: 1 Price Structure: Bearish
6: 2 Pattern Candle Chart: A window (gap) is present, which can act as a Continuation In Pattern (CIP). Additionally, a descending triangle is putting downward pressure on the price.
7: 3 Volume: Volume increases during bearish moves, indicating more selling pressure. Until the market gives a clear signal, it is not advisable to consider buying at any level.
8: 4 Momentum UNCONVENTIONAL Rsi: The market has lost momentum, but it is not yet strongly in favor of the bears. A strong rejection at the window area or resistance at the 60 level is needed for price confirmation.
9: 5 Volatility measure Bollinger bands: After a big volatile move, the price needs to calm down and may enter a period of consolidation or make a minor correction towards the 20-day moving average before continuing its downside move towards the target.
10: 6 Strength ADX: The ADX indicates a sideways trend at this point.
11: 7 Sentiment ROC: There is no strength in the sentiment ROC.
✔️ Entry Time Frame: H1
12: Entry TF Structure: After a strong bearish trend, there is a consolidation (choch) pattern forming. Upon closer observation, the daily window, extreme order block, and structure high coincide at the same point, making it a strong supply area or rejection point. We will place a sell order when a strong signal is formed.
13: Entry Move: The entry move must be impulsive.
14: Support Resistance Base: Daily window, extreme order block, structure high.
15: FIB: Trigger event done based on H1 timeframe.
☑️ Final comments: Open sell entries at the market opening, and if the price goes further up near the window, consider a second sell entry. A third sell entry can be placed if the market creates an internal Breakout-Sell (BOS) signal.
16: 💡Decision: Sell
17: 🚀Entry: Sell between 102.885 and 102.2
18: ✋Stop Loss: 103.175
19: 🎯Take Profit: 1st target at 100.5, 2nd target at 99.5
20: 😊Risk to Reward Ratio: 1:4
🕛 Expected Duration: 10 days

DXY Ready to pullback!Doller creates double bottom in the trend support line; a nice pullback is anticipated!

DXY Falling!!!i think if DXY(DOLLER) crossed down this area should touched belower area(95.485), and more intresting about the price of the DXY(DOLLER) is that is LL of it 8month's!!!
what about you guy's?
you have the same opinion like me or diffrence? why?
i just want to see some opinions with diffrent mindset's
this moving is in way when we have crossing down this area that doller is in it
have a good moment's guy's (;

USDCHF BUYERS ARE WIINER NOW!Given the structure of the chart, it seems that buyers have regained power. We expect strong and consecutive moves from buyers ...
Thank you for your support.

AUDUSD Possible sellAUDUSD possible sell when we retest the trendline, Fed interest took out Liquidity $$$$$$

USDZAR POSSIBLE BUYUSDZAR has seen some highs being broken and liquidity taken out.Scalp buy if we retest the trendline and orderblock. NOTE daily is stil in a downntrend

Eurchf monthly view Eurchf formed head and shoulder pattern in the monthly chart . What are you imagine here ? We should be sell here or wait ? Please express your expression in the below .
Peace !

USDJPY LONG IDEAPlease hit a like and follow if this idea help you.
I am bullish on USDJPY .Price rejected a very strong level of support.I am expecting to retest the high again


