EWA-tokyo
Plus■Outlook for DXY on 1W chart. We are in sub-wave iii of the upper degree wave C. The sub-waves of wave iii will form a 5-wave impulse. If the assumptions of this scenario are correct, the sub-wave (3) of wave iii should start soon.
■Outlook for the EURUSD 1W chart. Currently, we are in sub-wave ⅱ of wave (ⅲ). Sub-wave ⅱ is expected to complete soon. After that, sub-wave ⅲ will start. It is anticipated that sub-wave ⅲ will form a five-wave impulse. If the assumptions of this scenario are correct, sub-wave ⅲ is likely to break through several channel lines and resistance lines, and I...
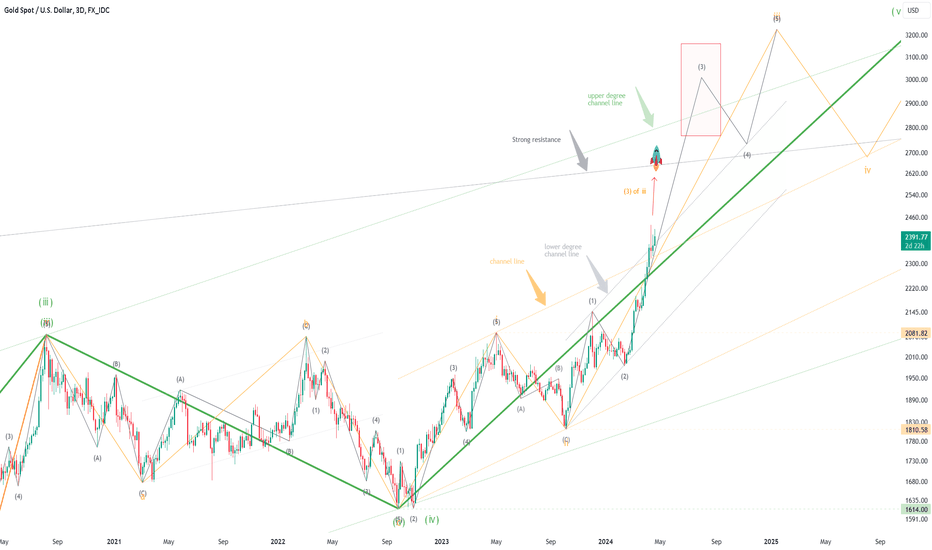
■Outlook of XAUUSD on 3D chart. We are currently in sub-wave ⅲ of the upper degree wave (ⅴ). I think that sub-waves of wave ⅲ will form a 5-wave impulse. so, we are in sub-wave (3) of wave ⅲ. If the assumptions of this scenario are correct, I think that sub-wave (3) will continue to be bullish, supported by two channel lines. Last time my idea. ■Apr 13, 2024....
■Outlook of XAUUSD on 3D chart. I think We are in sub-wave 1 of wave (ⅲ). Wave (ⅲ), shown by the orange line, will probably become a 3rd wave extension impulse. If the assumption of this scenario is correct, If it can break through a channel line, it will probably become strongly Bullish. ■Outlook of XAUUSD on 3D chart. Apr 13.2024 ■Outlook of Dow(DJI) on 3D...
■Outlook of XAUUSD on 3D chart. I think We are in sub-wave (3) of wave ⅲ. Wave ⅲ, shown by the orange line, will probably become a 3rd wave extension impulse. Sub-wave (3) is supported by two channel lines, and the trend will continue. Last time my idea. ■Feb 13, 2024. 1M, Long-term analysis.
Outlook for DJI on 1M chart. We are probably in sub-wave (c) of wave A. I think the sub-waves of wave A might form an expanded flat or Running flat. If this scenario is correct, It will probably crash. Last time my idea. ■Feb 10, 2024. middle-term analysis.
Outlook for DJI on 3-day chart. Lower-degree wave (4) has already been completed and the final wave (5) has started. I think wave (5) will be completed soon, and upper-degree wave (b) will also be completed. The next phase is upper-degree wave (c). It will probably crash.
Outlook for DJI on 12h chart. I will update my ideas from last time. I think we are on sub-wave 5 of wave (5). This sub-wave is the last motive wave. If this scenario is correct, upper-degree wave (b) of c will be completed soon. The next phase is upper-degree wave (c). It will probably crash. Last time my idea. ■Feb 10, 2024. middle-term analysis. ■Jan 27,...
Outlook for DXY on 4h chart. There have been no changes since the last update. we are in wave Y of a Double Zigzag WXY pattern. If the assumption of this scenario is correct, wave Y will be completed soon. At the same time wave Y completes, Upper-degree wave ⅱ will complete. next phase is upper-degree wave ⅲ. it will resume its downtrend. Last time my...
■Outlook of XAUUSD on 1M chart. We are in sub-wave (ii) of wave 5. Wave 5, shown by the green line, will probably become a 5th wave extension impulse. The sub-wave of wave 5 is shown by the orange line. I think the sub-waves of wave (ii) are probably a Double three pattern (W, X, Y). Sub-wave (ii) will continue for some time. After wave (ii) is completed,...
Outlook for DXY on 1D chart. I think the sub-waves of waveⅱ will likely form a Double Zigzag WXY pattern. If this scenario is correct, we are in the sub-wave Y of waveⅱ. Waveⅱ may retrace to the Fibo level of 61.8 to 78.6% of wave ⅰ, shown by the red area. After that, it will resume its downtrend. Last time my idea. ■Jan 28, 2024. Short-term analysis.
Outlook of XAGUSD on 1D chart. We are probably in sub-wave (Y) of waveⅱ. If the assumption of this scenario is correct, The lower degree of sub-wave (Y) might form Triangle pattern. I think the corrective wave will continue for a while. ◆ Another scenario, Jan 27, 2024.
Outlook for DJI on 4h chart. There has been no changes since the last update. I think we are on sub-wave 5 of wave (5). If this scenario is correct, Upper-degree wave (b) of c will complete. next phase is upper-degree wave (c). It will probably crash. Last time my idea. ■Jan 27, 2024. middle-term analysis.
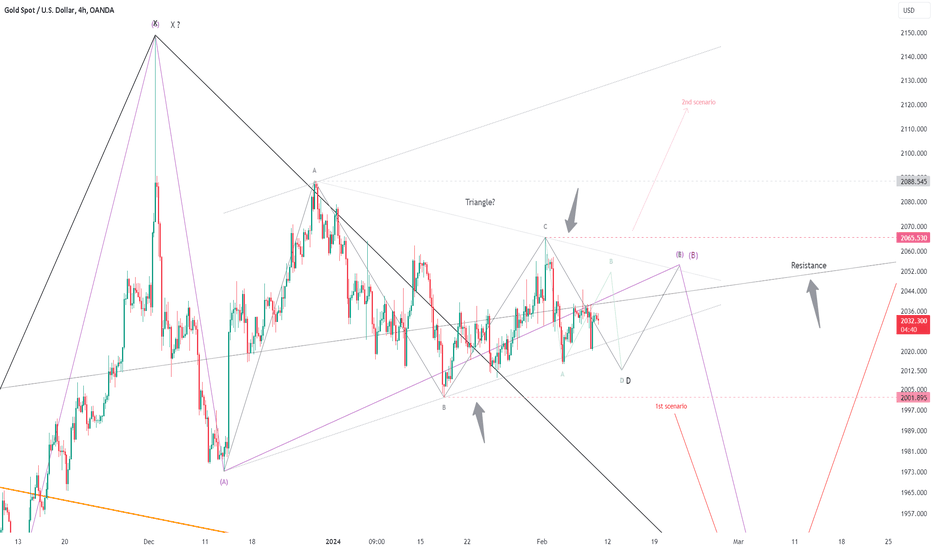
Outlook for XAUUSD(Gold) on 1D chart. There has been no changes since the last update. I think the sub-waves of wave (B) are likely to become a Triangle pattern. If this scenario is correct, we are probably in sub-wave D of wave (B), so the corrective wave will continue for some time.
Outlook for XAUUSD(Gold) on 4h chart. There has been no changes since the last update. I think the sub-waves of wave (B) are likely to become a Triangle pattern. If this scenario is correct, we are probably in sub-wave D of wave (B), so the corrective wave will continue for some time. Last time my idea. ■Feb 7, 2024. Short-term analysis. ■Feb 2, 2024....
Outlook for DJI on 4h chart. There has been no changes since the last update. I think we are on sub-wave (5) of wave C. If this scenario is correct, At the same time wave (5) completes, Upper-degree wave (b) will complete. next phase is upper-degree wave (c). It will probably crash. Last time my idea. ■Jan 27, 2024. middle-term analysis.
Outlook for XAUUSD(Gold) on 1D chart. There has been no changes since the last update. I think the sub-waves of wave (B) might form a Triangle on resistance line. If this scenario is correct, we are probably in sub-wave D of wave(B), so the corrective wave will continue for some time. Last time my idea. ■Feb 2, 2024. Short-term analysis. ■Jan 27, 2024....
Outlook for Natural Gas on 4h chart. There have been no changes since the last update. sub-wave 5 of wave C may already be completed. If the assumption of this scenario is correct, Upper-degree wave (c) will be started. I think Sub-waves of wave (c) will form a five-wave Impulse. Last time my idea. ■Feb 1, 2024. Short-term analysis. ■Jan 30, 2024. Short-term analysis.


