BTC DOMINANCE – MARKET STRUCTURE UPDATE. BTC DOMINANCE – MARKET STRUCTURE UPDATE
Current: ~59.8%
BTC Dominance is compressing inside a rising wedge, right below a major resistance zone.
Resistance: 60.5% – 60.8%
Support: 59.2% – 58.8%
Major Breakdown Zone: 57.5%
If BTC.D fails near 60.5–60.8%,
Expect Dominance drop toward 58%–57.5%
ALTCOINS likely to outperform (Altseason push) 🚀
Price is near the wedge apex → volatility incoming
Cloud + trendline rejection favors a fake breakout/rejection
Dominancebtc

USDT.D – 1D Chart UpdateUSDT.D – 1D Chart Update
Structure forming a rising wedge
Rejection near 6.6% resistance
Momentum weakening below trendline
Breakdown scenario: drop toward 4.4%–4.2% zone (marked)
👉 Falling USDT dominance = bullish for BTC & Altcoins
Wait for confirmation. Not financial advice.

$ETH about to outperform BitcoinHey traders!
These last three months have been marked by a sticky uncertainty. During this cycle, one thing has been very clear: Bitcoin has continuously outperformed all altcoins (including Ethereum).
However… is it finally time for Ethereum and the altcoins to enter a rally?
The truth is that this uncertainty was purely liquidity-driven, and with the current rate cuts and the slowdown in QT, medium- to long-term liquidity is likely to expand.
As we all know, this tends to benefit higher-risk assets — meaning $ETH.
That’s why, unless we see a crash, I believe it’s likely we’ll get a clearly bullish move this December and even into January (including for altcoins).

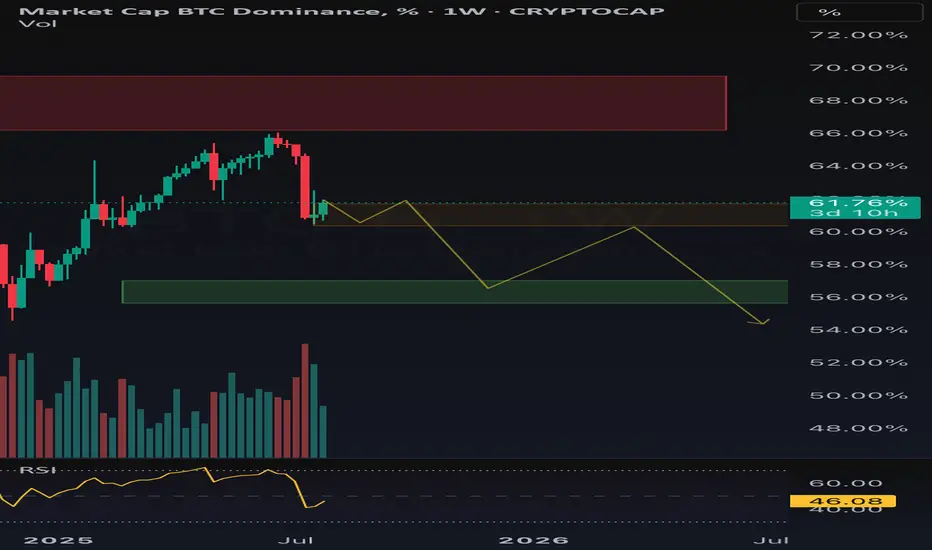
BTC Dominance Weekly Chart Analysis.BTC Dominance Weekly Chart Analysis.
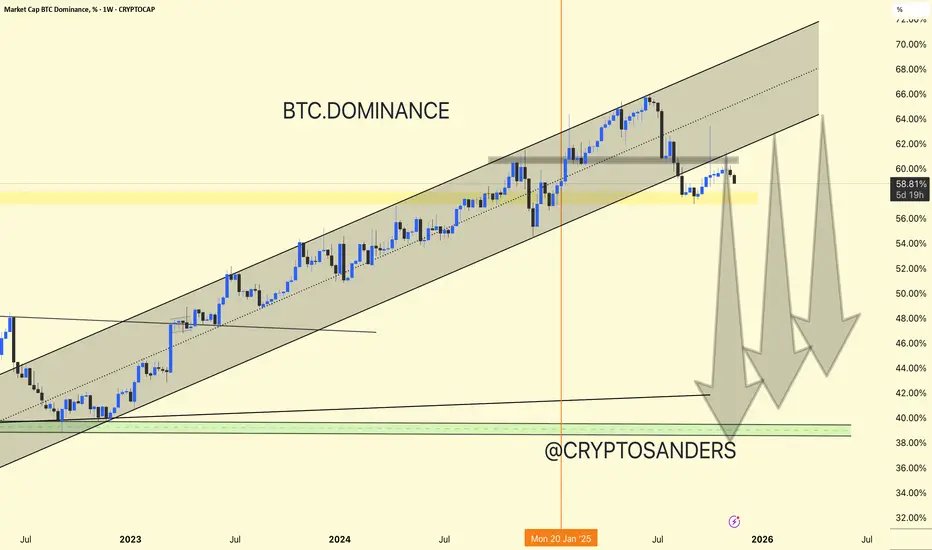
BTC Dominance (% of total crypto market cap) spent most of 2023–2025 in a strong uptrend, forming a rising channel.
Recent Reversal: After peaking above 68%, dominance has broken below the lower channel boundary and is currently retesting previous support-turned-resistance near 60%.
Dominance is hovering above the important yellow horizontal zone (~58%). A sustained move below this could accelerate the downtrend, with further downside targets near the green zone around 40–42%.
Projection: The chart indicates the possibility of a large “altcoin season” ahead (altcoins outperforming BTC) if dominance continues lower. Sharp arrows mark multiple possible legs down, hinting at a prolonged reduction in BTC’s share.
Summary:
BTC.D has broken its major uptrend channel and is now vulnerable. If support at 58% breaks, expect capital rotation into altcoins to intensify, possibly pushing dominance as low as 40% over the coming months
DYOR | NFA
BTC Dominance at Resistance! Alt Season Possible? Folks, take note! The BTC Dominance is currently hovering at a crucial resistance level
If it decides to drop, then brace yourself for an Alts Rally during an Uptrend. But if it breaks out, the Alts may either tumble or move sideways based on the Market Momentum

USDT Dominance - Weekly Chart Overview !!USDT Dominance - Weekly Chart Overview
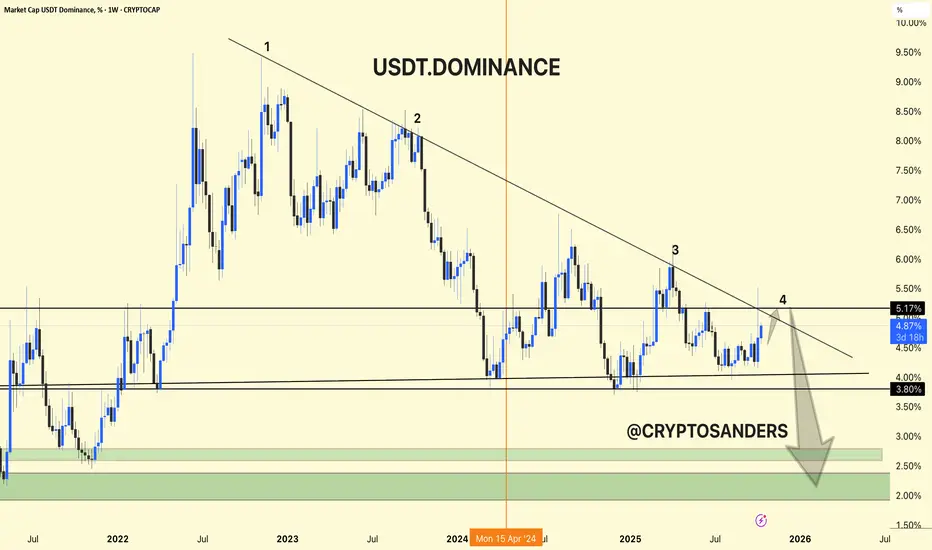
Current Level: 4.88%
Trend Structure: The chart clearly forms an aspect ratio pattern, consisting of a series of lower highs and lower lows since mid-2022.
Ascending Telgero/Declining Channel - Continuous pressure is being displayed from the ascending Telgero.
1. Key Resistance Area (5.0%–5.2%)
USDT Dominant is currently undergoing a restart test of the ascending critical line, which has acted as strong resistance several times in the past.
Every time the price retests this trend line, it corrects – indicating a shift of funds from stablecoins to crypto assets.
If the price does not close above 5.2%, it could trigger the next bearish move to the downside.
2. Support Levels
First Support: Around 3.8% – a key chocolate demand area.
Key support zone: Between 2.0%-2.5% (green zone applied).
This level is typical of the Initial Petroleum Model and historically marks major crypto bull runs.
3. Uptrend Outlook
The large downward arrow on the chart indicates a continuation of the slope.
If dominance is below 3.8%, it could move towards the 2-2.5% zone, which indicates that traders are shifting investments from USDT to BTC and altcoins – a bullish trend for the crypto market.
This means that traders are selling crypto and holding stablecoins → risk-off, fear in the market.
When USDT dominance falls:
It means that money is flowing from stablecoins to BTC and altcoins → risk-off sentiment, confidence is returning.
DYOR | NFA
BTC.D 1D – Altseason on the HorizonHi fellow traders,
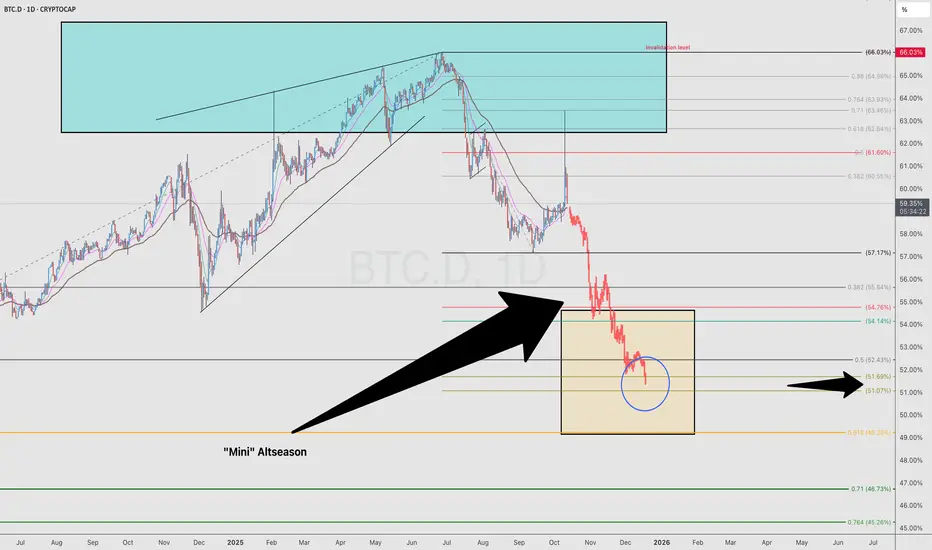
On the 1D BTC.D chart, I am applying Elliott Wave principles and broader market structure to highlight a potential move down toward the 51.7% dominance level. This zone aligns perfectly with the 0.5 Fibonacci retracement and could mark the next key turning point for Bitcoin dominance.
If this scenario plays out, we may witness a “mini” Altseason — a phase where capital begins rotating out of Bitcoin and into altcoins, sparking stronger rallies across the broader crypto market.
This setup isn’t a trade but a macro expectation, and it could serve as a powerful signal for increased altcoin strength in the coming weeks.
Stay alert — things could get very exciting from here.
Good luck and trade safe!
BTC.D (Dominance at Critical Fibonacci Confluence) 2025 Weekly
**Summary:**
Bitcoin Dominance (BTC.D) is testing a major Fibonacci confluence near the 66% level. This zone historically acts as a major pivot and may signal either a continued dominance rally or a potential reversal setting the stage for altseason. We use three layered Fibonacci retracements to outline dominant trend zones, key resistances, and projected targets.
**Chart Context:**
This chart uses **three distinct Fibonacci retracements** to map the historical and projected behavior of BTC dominance:
1. **Primary Fib** (100% to 0%): Captures the macro move from BTC.D \~100% down to its 0% level at \~0%, which aligns with the first altseason (2018–2019).
2. **Secondary Fib** (100% to 38.88%): Maps the first bearish wave to identify potential recovery levels. BTC.D retraced up to the 61.8% (\~73.68%) but failed to break further.
3. **Third or the Current Fib** (73.68% to 38.88%): Maps the latest bearish fall in BTC.D. As of now, BTC.D is hovering at the 78.6% retracement level of this move, indicating heavy resistance.
**Key Technical Observations:**
* **1st TP (Resistance):** 66% — Strong Fibonacci confluence zone:
* Fib2 48.6% ≈ Fib3 78.6%
* Major reversal zone historically
* **2nd TP (Support):** 52.25% — Multi-Fib confluence:
* Fib1 48.6%, Fib2 61.8%, Fib3 38.2%
* **3rd TP (Ultimate Support):** 38.88% — Historical BTC.D bottom, aligned with the first altseason.
* Intermediate Fibonacci confluences between 48%–60% serve as layered support during decline phases.
**Indicators:**
* No external indicators used; pure multi-frame Fibonacci confluence.
* Price action structure and historical patterns highlight potential market rotation zones.
**Fundamental Context:**
The current phase of the market reflects increasing speculative activity in altcoins while Bitcoin consolidates. Historically, high BTC.D correlates with Bitcoin-led rallies, while a sharp drop often triggers altseason.
* Growing inflows into ETH, SOL, and possible now XRP, and mid-cap alts suggest capital rotation.
* If BTC.D faces rejection from 66%, the market could enter a new altseason phase.
* Macro tailwinds (e.g., easing monetary policy, risk-on sentiment) support altcoin performance in the medium term.
**Philosophical or Narrative View:**
BTC.D acts as a barometer of market risk preference. As confidence expands beyond Bitcoin, money flows into altcoins—like tributaries branching off the main river. The rejection from major confluences signals this psychological shift, marking phases of creative decentralization.
**Related Reference Charts:**
* TOTAL3 Fibonacci Setup (Altcoin market excluding BTC & ETH):
* TOTAL2 Correction Probabilities:
**Bias & Strategy Implication:**
* **Primary Bias:** Bearish rejection from 66% followed by correction to 52% and potentially 38.88%.
* **Alternative Scenario:** Brief breach above 66% before reversal.
* Traders may consider rotating into altcoin exposure if BTC.D confirms reversal at the confluence zone.
**Time Horizon:**
* Mid to Long Term (1–6 months outlook)
* Weekly timeframe tracking
**Notes & Disclaimers:**
* This analysis is for educational purposes. Market conditions may evolve rapidly.
* Use proper risk management when acting on dominance signals.

BTC.D ON SUPPORT. Following my previous outlook: #BTC.D is now sitting right on key support around 57% 🎯
Upper resistance/retest zone: 60.00% - 60.50%
Looks like we could see a bullish retracement coming for the #alts market! 👀🚀
(bull cycle phase?)

USDT.D 1H Analysis !!USDT.D 1H Analysis
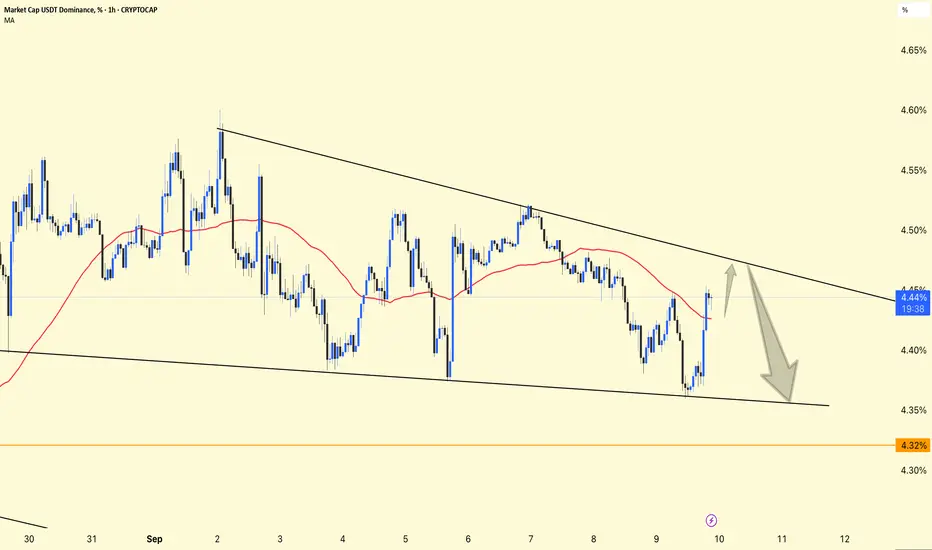
Price is consolidating inside a descending triangle (lower highs + flat bottom).
Currently sitting around 4.44%.
50MA (red) is acting as dynamic resistance, keeping pressure on dominance.
Support Zone
Key support lies near 4.35% (triangle bottom).
A breakdown below this zone could send dominance lower toward 4.32% (orange line).
Resistance
The upper trendline around 4.48%–4.50% is the first big resistance.
Break above → short-term relief rally in dominance.
📈 Outlook
Bullish case: If USDT.D breaks above 4.48%, dominance may rise toward 4.55%–4.60%, usually bearish for crypto prices.
Bearish case: If it rejects and breaks below 4.35%, we can see a move toward 4.32%, which would support bullish momentum in BTC/altcoins.
👉 In simple terms:
Watch 4.48% (resistance) and 4.35% (support).
A breakout = bearish for crypto.
A breakdown = bullish for crypto.
Dominance breaking down signals Altseason is here !!There is no doubt in my mind that an Altseason is now in progress !
The May2025 low has been taken out.
Now things will start accelerating.
We could have a backtest of the resistance at 63.13 % (dotted fuxia line).
But we also could not !!
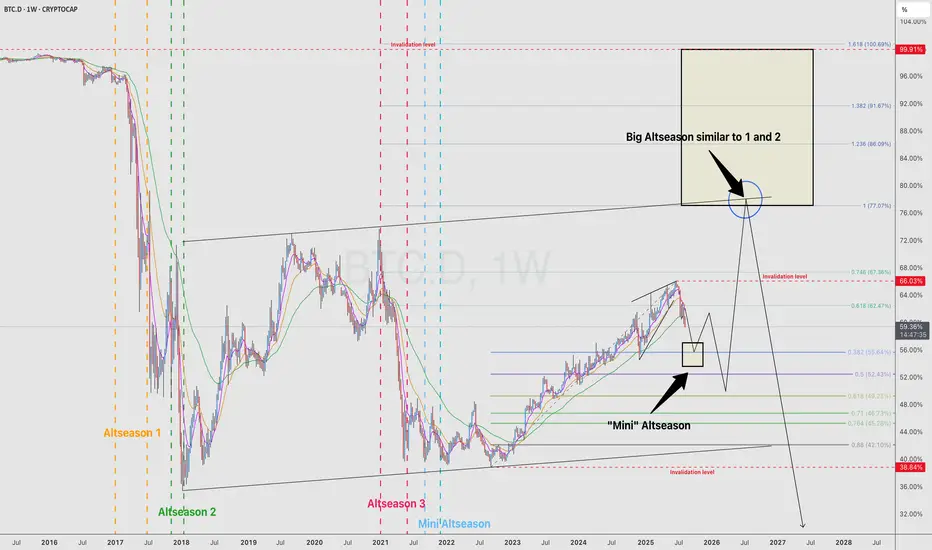
BTC.D, expected roadmap!Hi fellow traders,
On this chart I’m analyzing the Bitcoin Dominance (BTC.D) on the weekly timeframe using Elliott Wave principles.
Looking at the structure, I expect a major corrective phase to unfold in the coming years. Historically, we have seen two big Altseasons (1 and 2), followed by smaller rallies. My projection suggests we could first experience a “Mini-Altseason” when BTC.D enters the lower golden box, before heading higher again.
This move up could then create the conditions for a much larger Altseason, similar in magnitude to the previous major ones, once BTC.D reaches the higher golden box zone.
Mini Altseason: Potential short-term relief for alts as dominance corrects lower into the first golden box.
Big Altseason: A larger, more powerful move, expected after BTC.D completes a strong retracement into the upper golden box region.
The invalidation levels are clearly marked, and as long as the structure remains intact, I expect BTC.D to respect these Fibonacci-based zones and follow this corrective path.
This analysis indicates that while we may see a temporary bounce in BTC.D the long-term outlook still favors another significant Altseason ahead.
Good luck and trade safe!
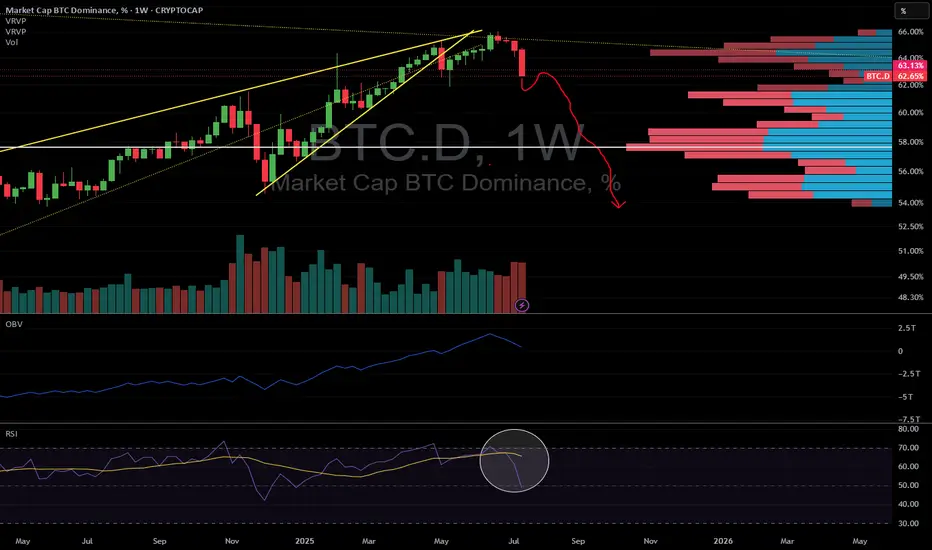
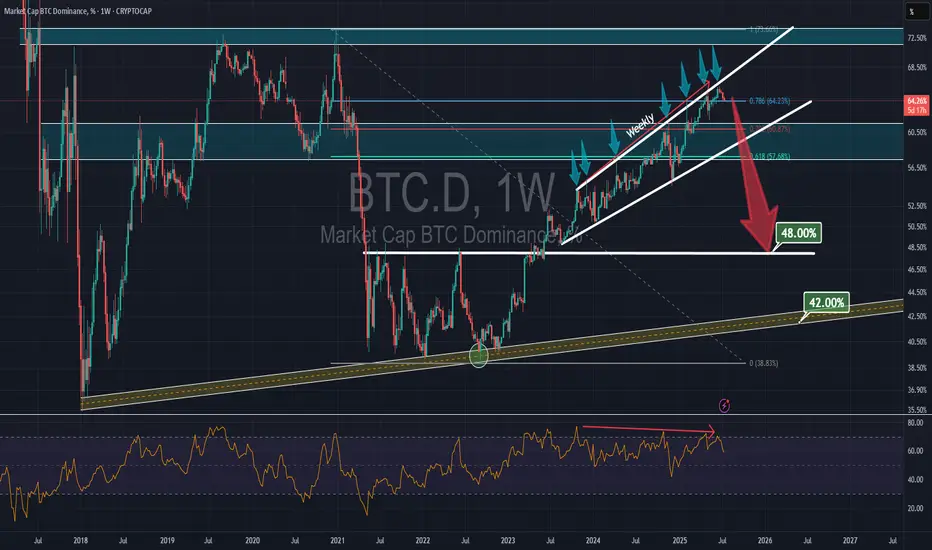
BTC-DOM- BTC dominance can't keep rising indefinitely.
-If we see a BTC dip, BTC dominance could climb to around 66% (71.8% Fibonacci), but in my opinion, that’s likely the maximum.
- If BTC surges too quickly and too high, altcoins will be suppressed, causing BTC dominance to potentially rise also to around 66%. However, once again, I believe that's would be the max.
- After any of both cases, altcoins will start to moon fly.
- 36-bar, 1096-day uptrend on the BTC dominance chart. That’s a significant duration from 2018 to 2021. The timespan from 2022 to 2025 could mirror the previous one.
- Take note also on the Bearish Divergence between the trend and the RSI. ( i will post weekly graphic also to show a more clear view ).
- An uptrend of this length indicates strong, sustained interest in BTC compared to altcoins. However, long-term trends like this are prone to exhaustion.
For now, just hold your alts and practice golden patience.
Happy Tr4Ding !

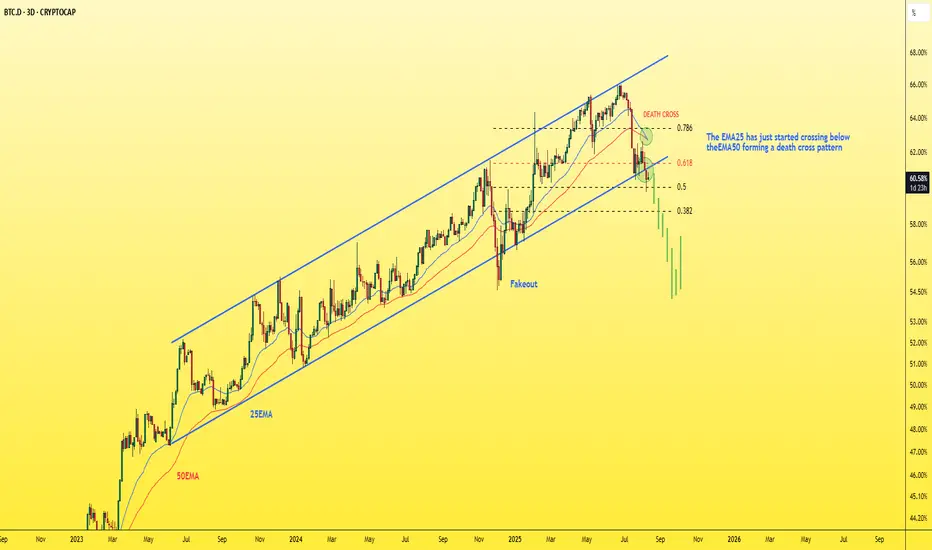
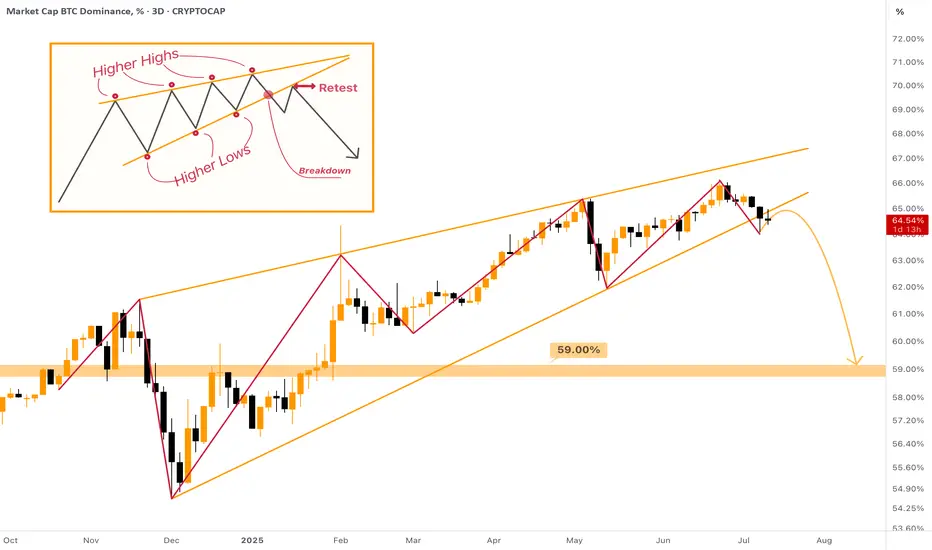
Dominance - Deep dive into Dominance chart!Did you know that dominance is on the verge of collapsing in the coming days? Let me tell you why.
🔸On the 3-day dominance chart:
- We have the beginning of a break of the ascending channel, a close below it, and a retest.
- There’s also a break of an important support level at 0.618 Fibonacci, followed by a retest, and it’s currently trading below it.
- Plus, we have a death cross where the EMA25 crossed below the EMA50.
That’s three confirmations on one chart — can you imagine?
The coming days will likely see a strong pump in altcoins. Remember my words.
Best Regards:
Ceciliones🎯
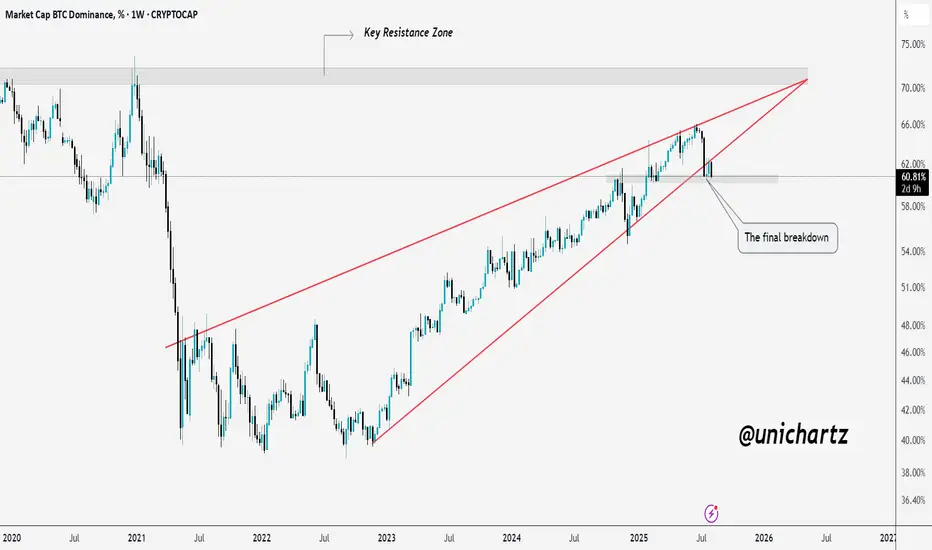
Altcoin Bulls Watching This Retest CloselyBTC Dominance has cleanly retested the breakdown from its rising wedge pattern after failing to break the key resistance zone.
This retest is a critical point if sellers maintain control here, dominance could trend lower toward the next support range, potentially sparking an altcoin relief rally.
However, a reclaim above this breakdown zone would invalidate the bearish setup and shift momentum back in Bitcoin’s favor.
DYOR, NFA
$BTC.D WeeklyConsidering that from the red zone, there has been a strong pullback accompanied by volume, I will continue my projection where these are the weekly targets for CRYPTOCAP:BTC.D
All these points have been calculated using FIB
is AltSeason Started ????"The altcoin season has likely begun! We're currently witnessing Bitcoin's dominance chart breaking down at a critical juncture, and this cycle may surpass even our most optimistic expectations. The technical signals are remarkably clear and verifiable for most seasoned traders. In these market conditions, the wisest strategy is to hold strong with conviction – maintain your positions and trust in the assets you've carefully accumulated. This could very well be the start of an extended altcoin rally that rewards patience and strategic positioning. #AltSeason #CryptoMarket #BTCDominance #HODLStrategy"

Bitcoin DOMINANCE dropssssBTC dominance has been within a rising channel since October 2023, showing a significant bearish divergence on the weekly RSI. After the seventh rejection from the channel's top, it may drop to the major support at 48%.
Rising Wedge on Bitcoin Dominance - [BROKEN DOWNWARDS] The MASSIVE Rising Wedge on Bitcoin Dominance was broken downwards during the past week, most likely the 1W candle will also close below the support of the wedge.
What does it mean? The dominance will dump from 64% to at least 59%. This move can already provide us with the huge Altcoin Season! After this there more likely be a small correction towards 60%, and then we can freely dump further towards 54% zone.
I expect not only small cap, but major altcoins to be sent to new highs as well. Mark my words & be prepared for the last opportunity of this bull cycle!
BTC Dominance (BTC.D) — Weekly Failed AuctionChart Context
• Instrument: CRYPTOCAP:BTC.D
• Time-frame: 1-Week
• *Key vLevels (dashed):
• 68 % – 2021 supply pivot
• 66-68 % zone – recorded a Weekly Failed Auction (wick above, close back below)
• 62.50 % – mid-range support / prior breakout shelf
Failed Auction at the Top
Price wicked into the 66-68 % vLevel but closed lower.
On a weekly chart that pattern often marks exhaustion; bulls couldn’t maintain control.
First Support = 62.50 %
If BTC.D trades < 62.50 % and closes a weekly bar there, odds rise that capital rotates out of BTC and into alt-coins.
Historically this breakdown triggers the early stages of alt-season (see 2021 analogue).
Invalidation
Weekly close > 68 % negates the failed auction and points to renewed BTC strength (alts lag).
How I’ll trade / allocate
Spot BTC bias – overweight BTC while dominance holds > 62 %.
Alt-coin rotation – shift 20-35 % into high-conviction alts only after a confirmed weekly close < 62 % and follow-through below 60 %.
Risk checks – trim alt exposure back to cash/BTC if dominance reclaims 62 % after a breakdown (failed alt-season).

BEARISH DOM + BULLISH CAP = ALT SEASONsimple TA analysis with simple arithmetic operation :
decline of bitcoin Dominance with the rise of market capitale = the season of altcoins and price explosions.
the year 2025 will be profitable, enjoy the summer
CRYPTOCAP:BTC.D CRYPTOCAP:TOTAL BINANCE:BTCUSDT INDEX:BTCUSD BITFINEX:BTCUSD COINBASE:BTCUSD

Phoneix is coming backdoes not include financial advice.
the graph is back to its 2019 appearance
let's see if he can spread his wings this time

Dominance is currently engaged in a battle to move downward.Bitcoin dominance is currently in a strong downward battle, facing increasing pressure from altcoins which are gaining momentum. Despite some resistance trying to push dominance higher, the overall trend suggests a weakening grip of Bitcoin over the crypto market. This decline indicates growing investor interest in alternative cryptocurrencies, especially as sector-specific tokens and new projects start to outperform BTC. If this downward movement continues and breaks key support levels, we could see a more significant rotation into altcoins, fueling a broader rally across the market.
