#DOT/USDT Ready to go higher#DOT
The price is moving in a descending channel on the 1-hour timeframe. It has reached the lower boundary and is heading towards breaking above it, with a retest of the upper boundary expected.
We have a downtrend on the RSI indicator, which has reached near the lower boundary, and an upward rebound is expected.
There is a key support zone in green at 1.77. The price has bounced from this zone multiple times and is expected to bounce again.
We have a trend towards stability above the 100-period moving average, as we are moving close to it, which supports the upward movement.
Entry price: 1.80
First target: 1.83
Second target: 1.86
Third target: 1.90
Stop loss: Below the support zone in green.
Don't forget a simple thing: capital management.
For inquiries, please leave a comment.
Thank you.
DOTBTC

#DOT/USDT : BUY LOW#DOT
The price is moving in a descending channel on the 1-hour timeframe. It has reached the lower boundary and is heading towards breaking above it, with a retest of the upper boundary expected.
We have a downtrend on the RSI indicator, which has reached near the lower boundary, and an upward rebound is expected.
There is a key support zone in green at 1.72. The price has bounced from this zone multiple times and is expected to bounce again.
We have a trend towards consolidation above the 100-period moving average, as we are moving close to it, which supports the upward movement.
Entry price: 1.76
First target: 1.75
Second target: 1.82
Third target: 1.88
Don't forget a simple principle: money management.
Place your stop-loss below the support zone in green.
For any questions, please leave a comment.
Thank you.

DOT/USD SSL taken → ( upside )Potential bullish expansion
A pullback into supply is expected for mitigation
This is a long-term expectation, anticipated by early 2026 (Q1)
(This is not financial advice. Trade at your own risk)

#DOT/USDT :BUY LOW#DOT
The price is moving within an ascending channel on the 1-hour timeframe and is adhering to it well. It is poised to break out strongly and retest the channel.
We have a downtrend line on the RSI indicator that is about to break and retest, which supports the upward move.
There is a key support zone in green at the price of 2.22, representing a strong support point.
We have a trend to stabilize above the 100-period moving average.
Entry price: 2.27
First target: 2.33
Second target: 2.41
Third target: 2.51
Don't forget a simple money management rule:
Place your stop-loss order below the support zone in green.
Once the first target is reached, save some money and then change your stop-loss order to an entry order.
For any questions, please leave a comment.
Thank you.

$DOT \ PolkadotCRYPTOCAP:DOT \ Polkadot 🔃
Polkadot has been accumulating for a long time in both USD and CRYPTOCAP:BTC pairs and is gathering strength above the demand zone.
With the RSI supporting this movement, DOT is preparing for a new upward phase. The sleeping giant, which has been quiet for a long time, seems to be waking up soon.

DOT USD at the bottomDOT is at the bottom where the Wyckoff Accumulation Pattern was formed and it is in the final stages and I expect to start rising from these levels. The first target will be the top of the pattern at a price of $10. Breaking the top will open the way to the distant targets. I note that a huge limit has been set by Polkadot DAO on the network, as the total supply of tokens that will be minted has been changed. A ceiling has been set for it at 2.1 billion DOTs , unlike what was previously there was no ceiling, as the number of tokens was be around 5billion DOT in the year 2050.
Long-term targets:
22$
36$
60$
90$
140$

DOT USD bull market
DOT is at the bottom where the Wyckoff Accumulation Pattern was formed and it is in the final stages and I expect to start rising from these levels. The first target will be the top of the pattern at a price of $10. Breaking the top will open the way to the distant targets. I note that a huge limit has been set by Polkadot governance (DAO) on the network, as the total supply of tokens that will be minted has been changed. A ceiling has been set for it at 2.1 billion DOTs , unlike what was previously there was no ceiling, as the number of tokens was be around 5billion DOT in the year 2050.
Long-term targets:
22$
36$
60$
90$
140$

DOT ; Boring movementsHello friends
According to the decline we have, you can see that the price has created an ascending channel and is slowly rising.
But there is an important resistance in its way, which it has hit once and caused a price correction, and the price is gathering strength to rise again.
Now, if this resistance is reliably broken and the price stabilizes above it, the price can move to the specified targets.
*Trade safely with us*

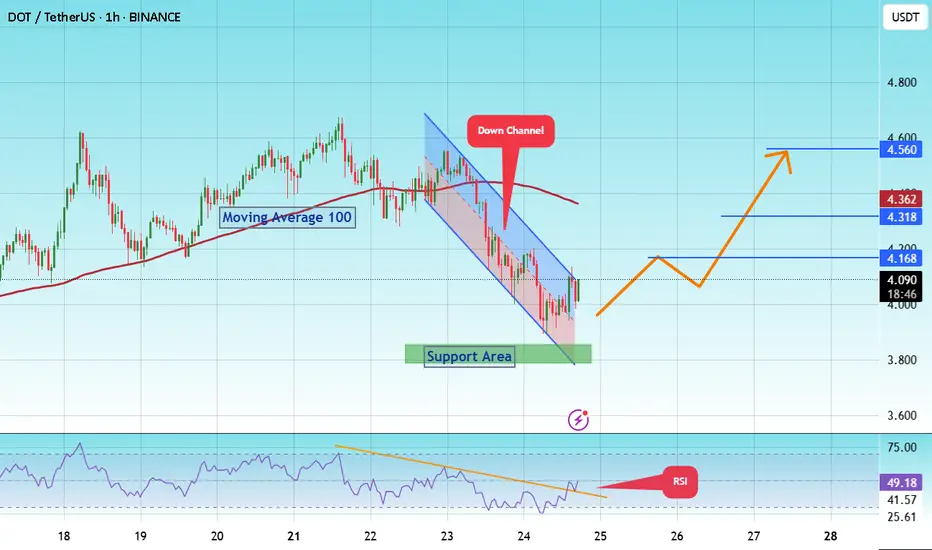
#DOT/Eyes 15% Rally, Targeting Key $ 4.560 Resistance Level#DOT
The price is moving within a descending channel on the 1-hour frame and is expected to break and continue upward.
We have a trend to stabilize above the 100 moving average once again.
We have a downtrend on the RSI indicator that supports the upward break.
We have a support area at the lower limit of the channel at 3,870, acting as strong support from which the price can rebound.
We have a major support area in green that pushed the price higher at 3,800.
Entry price: 4.084
First target: 4.168
Second target: 4.318
Third target: 4.560
To manage risk, don't forget stop loss and capital management.
When you reach the first target, save some profits and then change your stop order to an entry order.
For inquiries, please comment.
Thank you.
DOT; BUY OR SELL?Hello friends
Given the good growth we had, the price has formed a triangle, and if the triangle breaks, the price can move to the specified targets.
If the price falls, we have two excellent support areas that the price will definitely react to.
*Trade safely with us*

DOTUSDT - The Monster!It would be a shame if you’ve lost hope in DOT like many others have recently.
This is a strong project with a large market cap, and in every bullish season, it delivers solid performance — not explosive, but consistent. A moment will come when you’ll regret not buying it at $4.
From an investment perspective, its minimum long-term target is $40, while its more conservative mid-term target is $10.
Currently, the coin has broken out of a falling wedge pattern with a successful retest and has crossed above the 25 EMA on the 3-day chart.
These are all bullish indicators and a clear opportunity, especially with a nearby stop loss at $3.5.
Best regards:
Ceciliones🎯

Price floor: The opportunity to buy has arrived.Hello friends🙌
According to the decline we had, you can see that the price has reached its historical low, which has given good profits whenever it reaches this low. Now, with capital and risk management, we can buy within the limits of the low and move with it to the specified targets.
🔥Follow us for more signals🔥
*Trade safely with us*

DOTUSDT - A Sleeping Giant in the Bull Market?Polkadot (DOT) has always been one of the leading assets during bull markets
A $10 target now seems inevitable after a clean breakout above the main trendline, followed by a successful retest.🎯
This $10 level has historically acted as a major resistance zone, often manipulated during each bull cycle — price touches it, then sharply pulls back.
But the big question is:
Will DOT break this psychological barrier this time?
Why not?
With many investors losing faith in the crypto market and considering leaving altogether, this might actually be the perfect setup for a massive price explosion.
Historically, the craziest pumps tend to come when confidence is at its lowest.🚀
Best regards Ceciliones 🎯
DOT Will Pump 200% Next Few MonthsWe are headed to 12$ - 11$ over this year - Profiting 200%
STOP LOSS : Dailly Close Bellow 3.30$ (-15%)
Low Risq Big WIN!
Not Financial Advice , But I'm in Baby ;)
CRYPTOCAP:DOT BINANCE:DOTUSDT COINBASE:DOTM2025 BYBIT:DOTUSDT.P BYBIT:DOTUSDT COINBASE:DOTUSDT BINANCE:DOTBTC

#DOT/USDT#DOT
The price is moving within a descending channel on the 1-hour frame, adhering well to it, and is heading towards a strong breakout and retest.
We are experiencing a rebound from the lower boundary of the descending channel, which is support at 4.120.
We are experiencing a downtrend on the RSI indicator, which is about to break and retest, supporting the upward trend.
We are heading towards stability above the 100 Moving Average.
Entry price: 4.170
First target: 4.220
Second target: 4.246
Third target: 4.323

Move your BTC to DOT Hi,
I think it's a good time to convert part of your BTC to DOT.
I would move 50% of my BTC portfolio to DOT right now.
This is just for fun, to hit play on the future and see how correct or wrong I was :)
Thanks!
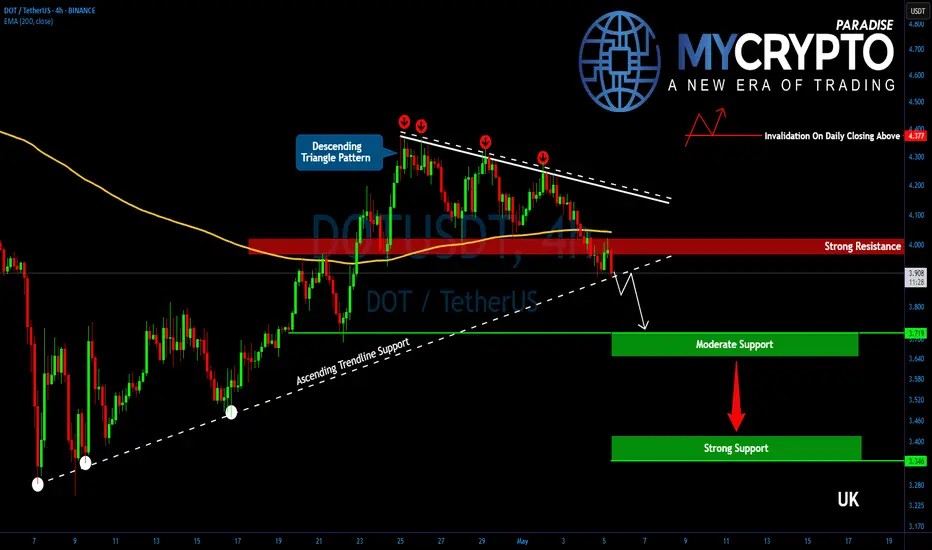
DOTUSDT Is Hanging by a Thread! Breakdown Ahead?Yello, Paradisers! Is #DOT about to hit new yearly lows? The structure is getting ugly again—don’t get caught off guard as this setup is starting to turn dangerous fast.
💎After a brief and weak corrective bounce, DOTUSDT is once again losing steam. The price has already broken down from a descending triangle—a bearish continuation pattern—and is now threatening to breach its key ascending support level. Momentum is shifting aggressively back in favor of the bears.
💎#DOTUSDT is now hanging to the critical $3.90 support level. A decisive breakdown below this zone would likely trigger another wave of selling pressure, opening the door for a drop toward the next moderate support range at $3.72 to $3.65. While this area could attract some short-term profit-taking, the broader trend remains clearly vulnerable, with bearish momentum continuing to dominate.
💎Should bearish pressure continue, and it’s highly likely at this stage that DOT could fall all the way toward the stronger support zone between $3.40 and $3.35. This region marks the 52-week low, and it's where bulls might step in to defend and attempt a meaningful rebound.
💎Additionally, the 2-hour EMA-200 has shown itself to be a strong trend guide. Every time DOT traded above it, bulls had a slight edge. But now that price has once again broken below this moving average, momentum is back with the bears.
Paradisers, strive for consistency, not quick profits. Treat the market as a businessman, not as a gambler.
MyCryptoParadise
iFeel the success🌴
DOTUSDT - U should have some DOT in ur portfolio3D chart shows breakout a falling wedge pattern after a drop of 70% ... this is a strong buy signal
so keep ur eye on it! ... target is 12$
Best regards Ceciliones🎯

DOT the most important historical support!DOT / USDT
The price just toke the liquidity and come back above the most important suppprt level in dot chart with long green wick (strong buy action)
As long as the price continues to close above the current level we think for strong bounce in the coming weeks
However, if and only if the price lose this level on HTF DOT will make new lows
Conclusion: this support acts as DO or DIE for future price action … bullish as long as it stay above it but if it lost on HTF it will into strong bearish
Note: many coins have same chart
Best of wishes

#DOT/USDT#DOT
The price is moving within a descending channel on the 1-hour frame, adhering well to it, and is heading towards a strong breakout and retest.
We are seeing a bounce from the lower boundary of the descending channel, which is support at 4.05.
We have a downtrend on the RSI indicator that is about to be broken and retested, which supports the upward trend.
We are looking for stability above the 100 moving average.
Entry price: 4.08
First target: 4.10
Second target: 4.15
Third target: 4.20

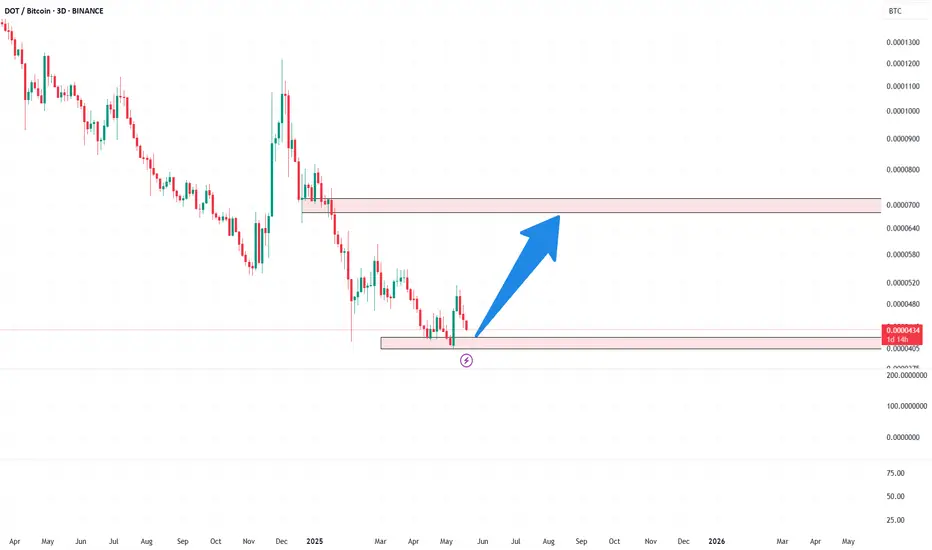
Polkadot Vs Bitcoin —Augmented Reality—1,000X Better Than Fiat!DOTBTC peaked in May 2021, it will soon be exactly four years.
The bear market bottom and lowest price was hit 3-February 2025. This week, we have a double-bottom.
A double-bottom is a bullish signal and points to a change of trend. There is another bullish signal hidden within this signal.
The low 3-Feb. was set at 0.00004134, this week (14-Apr.) it was 0.00004167, slightly higher.
The 3-Feb. session closed as a hammer, a reversal signal on its own.
The current session is also a hammer and the week closes tomorrow. Current prices or higher and a very strong bullish signal is confirmed. Lower prices wouldn't change anything, the bottom is in.
There isn't much data before 2021. The 2021 bull market here was cut short. It is hard to make any predictions and projections about how high prices can go for this pair. I can be making a huge mistake by underestimating the market, but there is nothing to go by as I work with the chart.
Here we have almost 12X potential. This wouldn't be too surprising for a Cryptocurrency trading pair within a bull market, it would be somewhat normal to see this kind of growth. That's why the mistake can be aiming too low but soon we will know.
Compared to USDT pairs, here we have to buy and hold and wait to see how the market will develop because anything goes. It can happen that these pairs peak before Bitcoin and then Bitcoin produces a final run which ends the bull market, or, these pairs produce a correction while Bitcoin prints its All-Time High, when the ATH is in, the Altcoins vs Bitcoin pairs produce a final run bigger anything we've seen before. Since Bitcoin is now worth trillions, when this money moves around the Altcoins can blow up. The second scenario is the prefered but I don't have any way of knowing which one of the two will be the case. It can happen that some pairs follow the first scenario and other pairs the second one; the ones following the second one will be the luckiest one, these can ending reaching highs in proportions that are very hard to understand. 30, 40, 50 or even 60X.
Right it is early because we are literally at bottom prices, but this wont' be forever the case. In just a few months, the sentiment will be so different that it will be hard to recall the feeling you are having today. You will be so high and feeling nice, that you might end up making more commitments than the ones you can handle, that is how good things will get.
It will become really good, make no mistake. It will be awesome. I can't wait to show you, you will be surprise and you will be so happy with the results, you will be so happy, that you will love Cryptocurrency for years to come. You will be able to hold through the entire bear market and you will be able to participate in each cycle for as long as the Internet is on. This will be our bank account, trading will be our job. Easy passive income with maximum growth.
Cryptocurrencies pay at least 1,000 times more than fiat currencies.
Thanks a lot for your continued support.
Namaste.

DOT/USD "Polkadot vs U.S Dollar" Crypto Heist (Scalping / Day)🌟Hi! Hola! Ola! Bonjour! Hallo! Marhaba!🌟
Dear Money Makers & Robbers, 🤑 💰💸✈️
Based on 🔥Thief Trading style technical and fundamental analysis🔥, here is our master plan to heist the DOT/USD "Polkadot vs U.S Dollar" Crypto Market. Please adhere to the strategy I've outlined in the chart, which emphasizes long entry. Our aim is to escape near the high-risk MA Zone. Risky level, overbought market, consolidation, trend reversal, trap at the level where traders and bearish robbers are stronger. 🏆💸"Take profit and treat yourself, traders. You deserve it!💪🏆🎉
Entry 📈 : "The vault is wide open! Swipe the Bullish loot at any price - the heist is on!
however I advise to Place buy limit orders within a 15 or 30 minute timeframe nearest or swing low or high level for pullback entries.
Stop Loss 🛑:
📍 Thief SL placed at the recent/swing low level Using the 4H timeframe (3.450) Scalping/Day trade basis.
📍 SL is based on your risk of the trade, lot size and how many multiple orders you have to take.
🏴☠️Target 🎯: 4.000
💰💵💸DOT/USD "Polkadot vs U.S Dollar" Crypto Market Heist Plan (Day / Scalping Trade) is currently experiencing a bullishness,., driven by several key factors.☝☝☝
📰🗞️Get & Read the Fundamental, Macro, COT Report, On Chain Analysis, Sentimental Outlook, Intermarket Analysis, Future trend targets.. go ahead to check 👉👉👉🔗
⚠️Trading Alert : News Releases and Position Management 📰 🗞️ 🚫🚏
As a reminder, news releases can have a significant impact on market prices and volatility. To minimize potential losses and protect your running positions,
we recommend the following:
Avoid taking new trades during news releases
Use trailing stop-loss orders to protect your running positions and lock in profits
💖Supporting our robbery plan 💥Hit the Boost Button💥 will enable us to effortlessly make and steal money 💰💵. Boost the strength of our robbery team. Every day in this market make money with ease by using the Thief Trading Style.🏆💪🤝❤️🎉🚀
I'll see you soon with another heist plan, so stay tuned 🤑🐱👤🤗🤩

#DOT/USDT#DOT
The price is moving within a descending channel on the 1-hour frame, adhering well to it, and is heading for a strong breakout and retest.
We are seeing a bounce from the lower boundary of the descending channel, which is support at 4.40.
We have a downtrend on the RSI indicator that is about to be broken and retested, supporting the upward trend.
We are looking for stability above the 100 Moving Average.
Entry price: 4.43
First target: 4.50
Second target: 4.57
Third target: 4.64
