1W Polkadot (DOT): Full updates & thoughts on the chain Technical situation (chart)
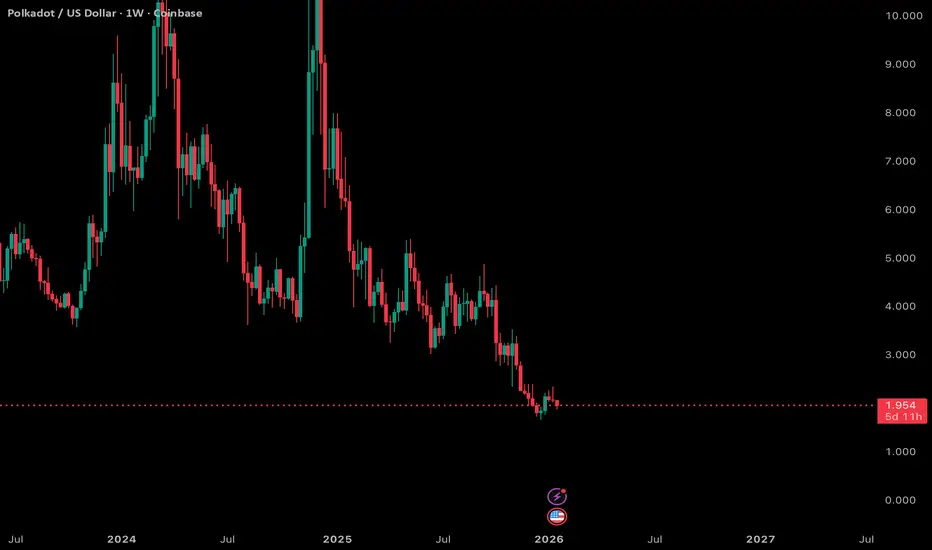
On the weekly, DOT is still struggling to show sustainable strength. Price continues to sit near the low end of the range around ~2.0, failing to make meaningful higher highs or clear range expansion. This looks like more consolidation and distribution pressure rather than a clean breakout, and recent candles confirm a bearish tone with lower peaks and no strong follow-through. Price action is choppy and defensive, reflecting weak conviction from buyers.
Regarding upgrades and fundamentals
Polkadot has a long roadmap of structural upgrades that are intended to boost the network’s utility and developer appeal. The ecosystem is transitioning to Polkadot 2.0 with features like Agile Coretime, Async Backing, and Elastic Scaling fully rolling out, which are designed to improve performance and flexibility for parachains. A hard cap on DOT supply and stepped-down issuance is also being introduced starting in 2026, reducing inflation over time. Smart contract support and increased Ethereum compatibility are targeted, potentially lowering friction for dApp developers and deployment.
CoinMarketCap
+1
Additionally, the Join-Accumulate Machine (JAM) architecture and new identity (“Individuality”) tooling are part of the broader 2026 roadmap, making Polkadot more scalable and feature-rich.
CoinMarketCap
There are also ecosystem developments like bridges (e.g., Hyperbridge enabling multi-chain connectivity) and improvements to developer tooling, which bolster long-term fundamentals.
Wikipedia
So what does that mean right now?
I looked at the chart through the lens of these upcoming upgrades to see whether news flow is already reflected in price. The short answer: not really — at least not yet. Despite strong on-chain activity and a clear roadmap, DOT price has been weak and range-bound. In fact, it’s down significantly over the past year even as the protocol continues to build out features.
Nasdaq
This divergence between fundamentals and price action is typical in environments where upgrades are slow to translate into actual adoption and utility — especially when broader market sentiment is range-bound or bearish for altcoins.
Overall take
From a technical perspective, DOT looks a bit bearish and indecisive right now, trapped at lows with no clear breakout structure. The long-term fundamental backdrop (protocol upgrades, supply cap, smart contract support) is constructive, but price isn’t yet reflecting that optimism. It’s a classic case of tech building ahead of price action, and until the market starts valuing those upgrades — likely via adoption, volume growth, or real activity metrics — the chart remains choppy and tilted bearish near current levels.
DOTUSD
DOTUSD -> Potential Wyckoff Accumulation DOTUSD -> Potential Wyckoff Accumulation
This looks like a Model 1 Wyckoff Accumulation to me. It is evident on the monthly timeframe, but more clear on the weekly.
If this is the case, currently we would be in the wyckoff spring phase.
What do you think?

#DOT/USDT Ready to go higher#DOT
The price is moving in a descending channel on the 1-hour timeframe. It has reached the lower boundary and is heading towards breaking above it, with a retest of the upper boundary expected.
We have a downtrend on the RSI indicator, which has reached near the lower boundary, and an upward rebound is expected.
There is a key support zone in green at 1.77. The price has bounced from this zone multiple times and is expected to bounce again.
We have a trend towards stability above the 100-period moving average, as we are moving close to it, which supports the upward movement.
Entry price: 1.80
First target: 1.83
Second target: 1.86
Third target: 1.90
Stop loss: Below the support zone in green.
Don't forget a simple thing: capital management.
For inquiries, please leave a comment.
Thank you.

#DOT/USDT : BUY LOW#DOT
The price is moving in a descending channel on the 1-hour timeframe. It has reached the lower boundary and is heading towards breaking above it, with a retest of the upper boundary expected.
We have a downtrend on the RSI indicator, which has reached near the lower boundary, and an upward rebound is expected.
There is a key support zone in green at 1.72. The price has bounced from this zone multiple times and is expected to bounce again.
We have a trend towards consolidation above the 100-period moving average, as we are moving close to it, which supports the upward movement.
Entry price: 1.76
First target: 1.75
Second target: 1.82
Third target: 1.88
Don't forget a simple principle: money management.
Place your stop-loss below the support zone in green.
For any questions, please leave a comment.
Thank you.

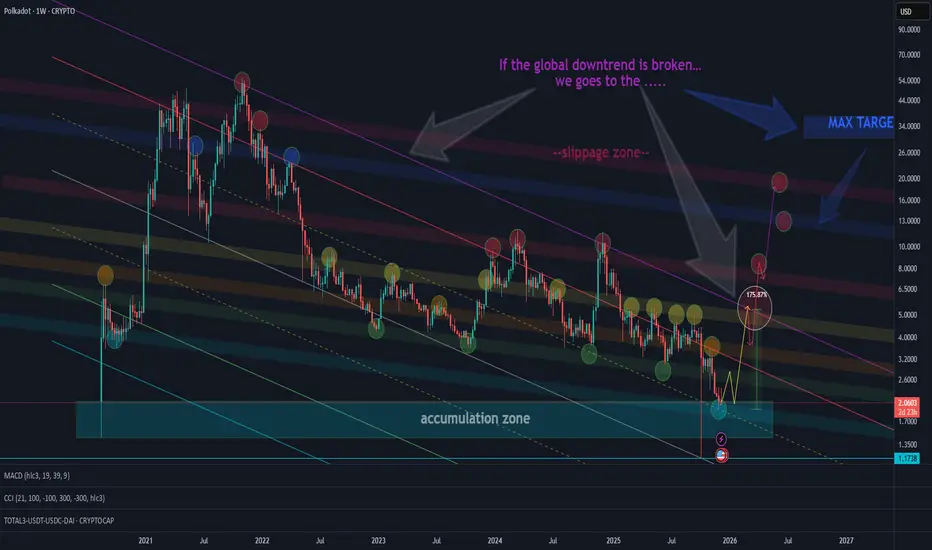
POLKADOT DOT DOTUSD 1W TFThe chart shows support and resistance levels as well as the targets up to the global descending channel.
If the global downtrend is broken - the maximum target is the blue zone.
The red zone represents a short-squeeze area originating from the blue zone — which may or may not occur and the squeeze could also happen earlier.
At the moment we are in the accumulation zone of the asset.
#DOT/USDT :BUY LOW#DOT
The price is moving within an ascending channel on the 1-hour timeframe and is adhering to it well. It is poised to break out strongly and retest the channel.
We have a downtrend line on the RSI indicator that is about to break and retest, which supports the upward move.
There is a key support zone in green at the price of 2.22, representing a strong support point.
We have a trend to stabilize above the 100-period moving average.
Entry price: 2.27
First target: 2.33
Second target: 2.41
Third target: 2.51
Don't forget a simple money management rule:
Place your stop-loss order below the support zone in green.
Once the first target is reached, save some money and then change your stop-loss order to an entry order.
For any questions, please leave a comment.
Thank you.

POLKADOT – LONG SETUP - LOADING SHORT SQUEEZE POTENTIALTraders,
$Polkadot is close to forming a high probability long setup, but it is not confirmed yet.
Here is the compact breakdown.
WHY DOT IS SETTING UP
Since 08 November price has been grinding down
Spot CVD, Coin Margined CVD and Stablecoin Margined CVD all fell with price which confirms real sell pressure
On 21 November the lows were swept
Today price tapped 2.220, the pivot level, and reacted
But we are still trading below 2.250, which means the squeeze setup is not active yet
Why the sweep matters
On Bybit around 915k Coin Margined short contracts opened into the low.
Coin Margined shorts use DOT as collateral which means when DOT rises they take a double hit.
The short loses value and their collateral also loses value.
This makes them far easier to liquidate once price reverses.
But price must reclaim the key level to trigger this effect.
THE KEY LEVELS
2.220 = the pivot
This is where price reacted
This is the 1.113 extension of the 04 November to 08 November move
This marks the completion of the downside rotation
2.250 = the trigger
This is the level price must reclaim and trade above
Above 2.250 shorts begin to go underwater
Above 2.250 the squeeze becomes active
Until $Polkadot trades above 2.250 the setup remains unconfirmed.
GAMEPLAN
Wait for two 30 minute candle closes above 2.250
This confirms the reclaim and activates the long setup
Look for a retest of the 2.240 to 2.250 zone
If buyers defend that retest it is the clean entry
As long as DOT stays below 2.250 this is only a potential setup
Falling back under 2.200 weakens the idea and requires reassessment
TARGETS IF CONFIRMED
If $Polkadot reclaims 2.250 the upside targets are:
3.675
3.877
4.063
4.327
Each level is a point to reassess momentum and structure.
FINAL VIEW
DOT swept the lows and trapped a large block of Coin Margined shorts.
The pivot at 2.220 has been touched, but the real trigger is 2.250.
Only once price reclaims and trades above 2.250 does the squeeze structure become active.
Until then it remains a potential high probability setup that requires confirmation.
Until the candles speak again,
ThetaNomad
-----------
If this helped you read the flow, drop a like and a comment
None of this is financial advice

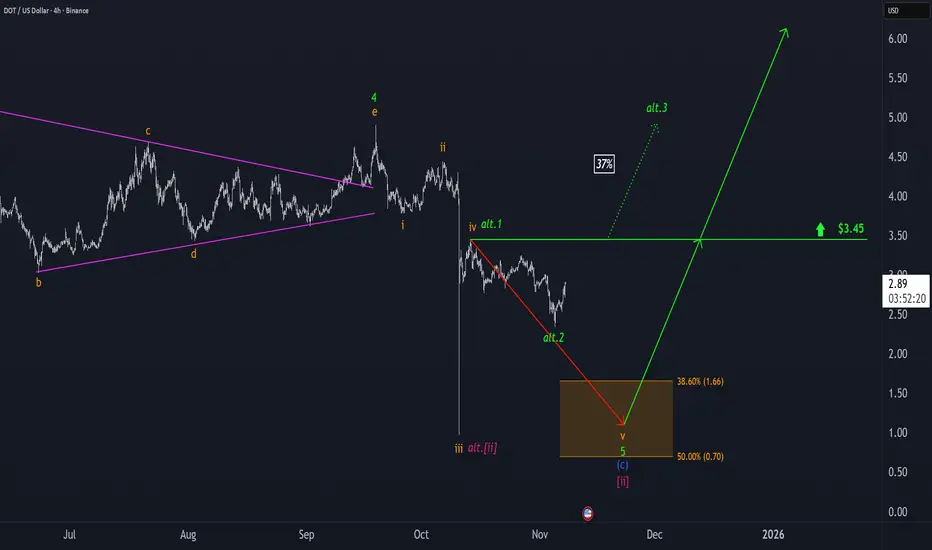
Polkadot: Ready to Bounce Straight Back Up?For now, we continue to expect that DOT will be sold off into our orange Target Zone between $1.66 and $0.70—which could offer attractive long entry opportunities – and complete magenta wave . However, we estimate there’s a 37% chance that the significant low is already in place and that the altcoin could break out directly above resistance at $3.45; in this scenario, our Target Zone would no longer be relevant.
DOT/Polkadot DropDOT is facing a supply zone (the green area), and the neckline (green) on the RSI has been broken. When the blue line breaks and the RSI pulls back to its broken neckline, that's one of the optimal entry points. This is because stop hunting is highly likely in supply and demand zones, I've drawn the probable path of movement. BINANCE:DOTUSDT

DOT - Up or Down?Afternoon fellow traders,
So, will UP or DOWN be the destine for Polkadot?
I gotta say, whole lotta ppl shorting thinking BTC will close that gap at 111k bucks give or take, but if that were to happen, I think we could just touch the support trendline and break up, now problem is, even if it breaks upwards, it could just fake it and come back down aggressively.
Anyway, regardless of the end result, theres money to be made both ways! Take advantage!
Trade thirsty, my friends!

DOTUSD | Bearish Rejection at Overlap ResistanceDOT/USD is rising towards the sell entry, which is an overlap resistance and could reverse from this level to the downside.
Sell entry is at 3.065, which is an overlap resistance.
Stop loss is at 3.277, which is a swing high resistance that aligns with the 161.8% Fibonacci extension.
Take profit is at 2.806, which is an overlap support.
Stratos Markets Limited (tradu.com ):
CFDs are complex instruments and come with a high risk of losing money rapidly due to leverage. 68% of retail investor accounts lose money when trading CFDs with this provider. You should consider whether you understand how CFDs work and whether you can afford to take the high risk of losing your money.
Stratos Europe Ltd (tradu.com ):
CFDs are complex instruments and come with a high risk of losing money rapidly due to leverage. 70% of retail investor accounts lose money when trading CFDs with this provider. You should consider whether you understand how CFDs work and whether you can afford to take the high risk of losing your money.

Polkadot: Short-Term Rally Before Potential Drop into Target ZonDOT is currently expected to move toward the high of wave iv in orange, according to our primary scenario. We continue to anticipate that this move will remain below the resistance level at $3.78. Afterward, we are primarily preparing for a wave v sell-off into the orange Target Zone ($1.66 – $0.70). In this range, we expect to see the low of wave in magenta, which should signal a potential long-term trend reversal to the upside. There is still a 30% probability that the correction low has already been completed as wave alt. in magenta. However, this alternative would only be definitively confirmed by a significant breakout above the $3.78 level.

DOTUSD Can this Channel save it from complete obsolescence?Polkadot (DOTUSD) has been trading within a Channel Down since the December 26 2022 Low and it only broke momentarily during last Friday's flash crash. Having recovered instantly above it and closing the 1W candle inside the pattern, it technically counts as a Lower Low.
The last two Lower Lows (both inside 2025), delivered rebound that hit tested the 1W MA50 (blue trend-line). As a result, the obvious technical Target on the medium-term is the 1W MA50 and our (a but more conservative) estimation is $4.600, which is right on the 0.382 Fibonacci Channel level. Of course that's assuming the market doesn't close any 1W candles below the Channel Down. The current price levels offer an excellent Risk/ Reward ratio on this.
If the 1W MA50 breaks, we can see an even more aggressive extension towards the top (Lower Highs trend-line) of the Channel Down. The best indicator for a Sell Signal in that scenario is the 1W RSI Resistance Zone. It has priced the last three major Highs since 2023. Naturally the 1W MA200 (orange trend-line) is the obvious long-term Resistance and potential Target in that scenario but can go even as high as 9.5000 if we repeat the previous +225.10% Bullish Leg.
-------------------------------------------------------------------------------
** Please LIKE 👍, FOLLOW ✅, SHARE 🙌 and COMMENT ✍ if you enjoy this idea! Also share your ideas and charts in the comments section below! This is best way to keep it relevant, support us, keep the content here free and allow the idea to reach as many people as possible. **
-------------------------------------------------------------------------------
💸💸💸💸💸💸
👇 👇 👇 👇 👇 👇

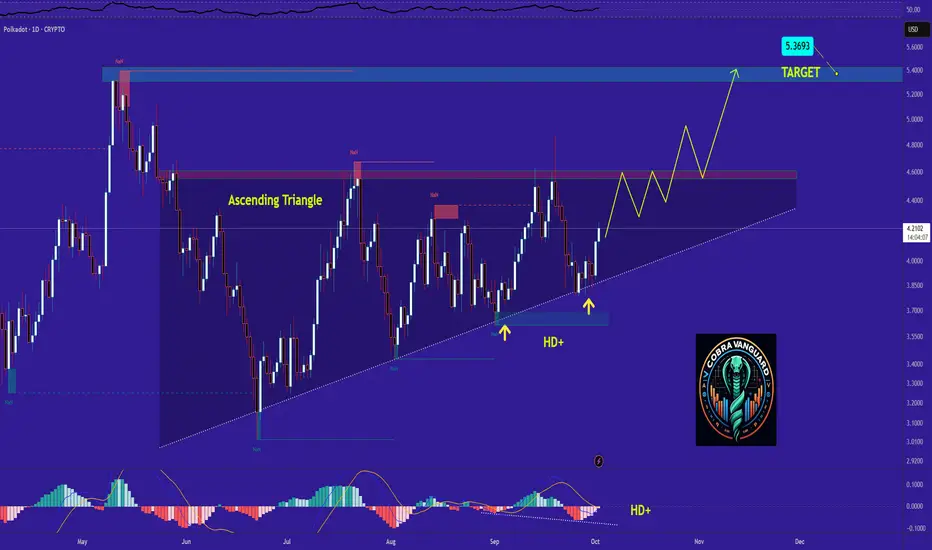
DOT's situation+next targets and expected movementsThe price on the daily timeframe is within an ascending triangle, which can be promising. If the price breaks this pattern with bullish candles, it could easily rise by the distance of AB=CD, If my view is correct, DOT will rise to $5 .
And if this pattern is correct and breaks, higher targets are possible.

$DOT \ PolkadotCRYPTOCAP:DOT \ Polkadot 🔃
Polkadot has been accumulating for a long time in both USD and CRYPTOCAP:BTC pairs and is gathering strength above the demand zone.
With the RSI supporting this movement, DOT is preparing for a new upward phase. The sleeping giant, which has been quiet for a long time, seems to be waking up soon.

Can DOT/USDT Sustain Its Bullish Momentum This Week?🎯 DOT/USDT: The Kijun Breakout Heist 💎 | Swing/Day Trade Setup
📊 Market Overview: POLKADOT vs TETHER
The DOT/USDT pair is flashing some serious bullish signals, and this setup is looking too good to ignore! We've got a Kijun moving average breakout brewing alongside a CCI momentum oscillator golden cross — the kind of technical alignment that makes traders smile. 😏
🎯 The "Thief Strategy" Game Plan
Trading Style: Swing/Day Trade Hybrid
Bias: BULLISH 🚀
Confirmation: Kijun MA breakout + CCI golden cross momentum surge
💰 Entry Strategy: The Layered Limit Order Approach
Here's where it gets interesting. Instead of market buying like a rookie, we're using multiple limit orders (the "layering strategy") to scale into this position like professionals:
Suggested Entry Layers:
🎯 Layer 1: $4.150
🎯 Layer 2: $4.200
🎯 Layer 3: $4.250
You can add more layers based on your position size and risk appetite. The beauty of layering? You average into the move instead of gambling on one entry!
🛡️ Risk Management Zone
Stop Loss: $4.050 🚨
⚠️ IMPORTANT DISCLAIMER:
Dear Ladies & Gentlemen (Thief OG's) — this is MY stop loss level based on MY analysis. You are NOT obligated to use this level. Trading is YOUR responsibility, YOUR risk, YOUR reward. Set YOUR own stop loss based on YOUR risk tolerance. Manage your money, take your profits, and protect your capital at your own discretion.
🎯 Profit Target: Know When to Exit the Heist
Target Zone: $4.600 💰
This target aligns with:
Strong historical resistance
Overbought RSI/CCI conditions (potential trap zone)
Natural profit-taking area
🚨 Exit Strategy Reminder:
Dear Ladies & Gentlemen (Thief OG's) — this is MY target based on MY technical analysis. You are NOT required to follow this target. Take profits when YOU feel comfortable. Lock in gains, scale out, or let it ride — it's YOUR choice and YOUR capital. Make money, then take money at your own risk.
🔍 Key Technical Indicators Breakdown
✅ Kijun Moving Average: Bullish breakout confirmed
✅ CCI Momentum Oscillator: Golden cross formation (bullish momentum shift)
✅ Price Action: Higher lows forming, trend structure improving
✅ Volume Profile: Increasing buying pressure on breakout levels
💎 Related Pairs to Watch (Correlation Play)
Keep an eye on these correlated assets for confluence:
CRYPTOCAP:DOT Dominance — Overall Polkadot ecosystem strength
$KSM/USDT (Kusama) — Polkadot's canary network, often moves in tandem
$ATOM/USDT (Cosmos) — Similar interoperability narrative
$AVAX/USDT (Avalanche) — Competes in similar L1 smart contract space
$BTC/USDT — King Crypto correlation; DOT typically follows BTC trend direction
$ETH/USDT — Ethereum's strength often lifts altcoins including DOT
Why watch these? If CRYPTOCAP:DOT rallies while CRYPTOCAP:BTC and CRYPTOCAP:ETH consolidate, that's relative strength — a bullish divergence. If ASX:KSM pumps, CRYPTOCAP:DOT often follows. Smart traders watch the whole ecosystem, not just one chart! 👀
🧠 Final Thoughts: Trade Smart, Not Hard
This setup combines:
📈 Momentum confirmation (CCI golden cross)
📊 Trend confirmation (Kijun breakout)
💰 Smart entry execution (layered limits)
🛡️ Defined risk (clear stop loss)
🎯 Clear target (resistance + overbought zone)
The "Thief Strategy" isn't about greed — it's about stealing profits from the market with precision and discipline. Layer in, manage risk, and take profits when the market gives them to you. 💼
📌 Disclaimer
⚠️ This is the "Thief Style" trading strategy — for educational and entertainment purposes only. This analysis is NOT financial advice. Trading crypto carries substantial risk of loss. The "Thief" approach is a fun, stylish way to describe disciplined layered entries, but YOU are responsible for your own trading decisions, risk management, and capital. Trade what you can afford to lose. Do your own research (DYOR).
Not a registered financial advisor. Just a chart enthusiast sharing ideas. 🎨📊
✨ If you find value in my analysis, a 👍 and 🚀 boost is much appreciated — it helps me share more setups with the community!
#DOTUSDT #DOT #Polkadot #CryptoTrading #SwingTrading #DayTrading #TechnicalAnalysis #CCIOscillator #KijunBreakout #CryptoSignals #AltcoinSetup #LayeredEntry #RiskManagement #ThiefStrategy #BullishSetup #MomentumTrading

DOTUSD H4 | Bearish Drop in Progress”DOT/USD is reacting off the sell entry which is a pullback resistance that aligns with the 50% Fibonacci retracement and could drop from this levle to the downside.
Sell entry is at 4.165, which is a pullback resistance that aligns with the 50% Fibonacci retracement.
Stop loss is at 4.420, which is a pullback resistance.
Take profit is at 3.878, which is an overlap support that aligns with the 61.8% Fibonacci retracement.
High Risk Investment Warning
Trading Forex/CFDs on margin carries a high level of risk and may not be suitable for all investors. Leverage can work against you.
Stratos Markets Limited (tradu.com ):
CFDs are complex instruments and come with a high risk of losing money rapidly due to leverage. 65% of retail investor accounts lose money when trading CFDs with this provider. You should consider whether you understand how CFDs work and whether you can afford to take the high risk of losing your money.
Stratos Europe Ltd (tradu.com ):
CFDs are complex instruments and come with a high risk of losing money rapidly due to leverage. 66% of retail investor accounts lose money when trading CFDs with this provider. You should consider whether you understand how CFDs work and whether you can afford to take the high risk of losing your money.
Stratos Global LLC (tradu.com ):
Losses can exceed deposits.
Please be advised that the information presented on TradingView is provided to Tradu (‘Company’, ‘we’) by a third-party provider (‘TFA Global Pte Ltd’). Please be reminded that you are solely responsible for the trading decisions on your account. There is a very high degree of risk involved in trading. Any information and/or content is intended entirely for research, educational and informational purposes only and does not constitute investment or consultation advice or investment strategy. The information is not tailored to the investment needs of any specific person and therefore does not involve a consideration of any of the investment objectives, financial situation or needs of any viewer that may receive it. Kindly also note that past performance is not a reliable indicator of future results. Actual results may differ materially from those anticipated in forward-looking or past performance statements. We assume no liability as to the accuracy or completeness of any of the information and/or content provided herein and the Company cannot be held responsible for any omission, mistake nor for any loss or damage including without limitation to any loss of profit which may arise from reliance on any information supplied by TFA Global Pte Ltd.
The speaker(s) is neither an employee, agent nor representative of Tradu and is therefore acting independently. The opinions given are their own, constitute general market commentary, and do not constitute the opinion or advice of Tradu or any form of personal or investment advice. Tradu neither endorses nor guarantees offerings of third-party speakers, nor is Tradu responsible for the content, veracity or opinions of third-party speakers, presenters or participants.

DOT is bullish now & many Traders don't see it !!!The price on the daily timeframe is within an ascending triangle, which can be promising. If the price breaks this pattern with bullish candles, it could easily rise by the distance of AB=CD, If my view is correct, DOT will rise to 5$ .
And if this pattern is correct and breaks, higher targets are possible.
DOTUSD H4 | Bearish continuation in playDOT/USD is rising towards the sell entry, which is a pullback resistance that is slightly above the 23.6% Fibonacci retracement and could drop from this level to the downside.
Sell entry is at 3.937, which is an overlap resistance.
Stop loss is at 4.119, which is a pullback resistance that is slightly below the 50% Fibonacci retracement.
Take profit is at 3.617, which is a pullback support.
High Risk Investment Warning
Trading Forex/CFDs on margin carries a high level of risk and may not be suitable for all investors. Leverage can work against you.
Stratos Markets Limited (tradu.com ):
CFDs are complex instruments and come with a high risk of losing money rapidly due to leverage. 65% of retail investor accounts lose money when trading CFDs with this provider. You should consider whether you understand how CFDs work and whether you can afford to take the high risk of losing your money.
Stratos Europe Ltd (tradu.com ):
CFDs are complex instruments and come with a high risk of losing money rapidly due to leverage. 66% of retail investor accounts lose money when trading CFDs with this provider. You should consider whether you understand how CFDs work and whether you can afford to take the high risk of losing your money.
Stratos Global LLC (tradu.com ):
Losses can exceed deposits.
Please be advised that the information presented on TradingView is provided to Tradu (‘Company’, ‘we’) by a third-party provider (‘TFA Global Pte Ltd’). Please be reminded that you are solely responsible for the trading decisions on your account. There is a very high degree of risk involved in trading. Any information and/or content is intended entirely for research, educational and informational purposes only and does not constitute investment or consultation advice or investment strategy. The information is not tailored to the investment needs of any specific person and therefore does not involve a consideration of any of the investment objectives, financial situation or needs of any viewer that may receive it. Kindly also note that past performance is not a reliable indicator of future results. Actual results may differ materially from those anticipated in forward-looking or past performance statements. We assume no liability as to the accuracy or completeness of any of the information and/or content provided herein and the Company cannot be held responsible for any omission, mistake nor for any loss or damage including without limitation to any loss of profit which may arise from reliance on any information supplied by TFA Global Pte Ltd.
The speaker(s) is neither an employee, agent nor representative of Tradu and is therefore acting independently. The opinions given are their own, constitute general market commentary, and do not constitute the opinion or advice of Tradu or any form of personal or investment advice. Tradu neither endorses nor guarantees offerings of third-party speakers, nor is Tradu responsible for the content, veracity or opinions of third-party speakers, presenters or participants.

DOTUSD H4 | bearish drop offDOT/USD has rejected off the sell entry which and could potentially drop from this levle to the downside.
Sell entry is at 3.843, whichis a pullback resistance.
Stop loss is at 4.119, which is a pullback resistance.
Take profit is at 3.453, which acts as a pullback support.
High Risk Investment Warning
Trading Forex/CFDs on margin carries a high level of risk and may not be suitable for all investors. Leverage can work against you.
Stratos Markets Limited (tradu.com ):
CFDs are complex instruments and come with a high risk of losing money rapidly due to leverage. 65% of retail investor accounts lose money when trading CFDs with this provider. You should consider whether you understand how CFDs work and whether you can afford to take the high risk of losing your money.
Stratos Europe Ltd (tradu.com ):
CFDs are complex instruments and come with a high risk of losing money rapidly due to leverage. 66% of retail investor accounts lose money when trading CFDs with this provider. You should consider whether you understand how CFDs work and whether you can afford to take the high risk of losing your money.
Stratos Global LLC (tradu.com ):
Losses can exceed deposits.
Please be advised that the information presented on TradingView is provided to Tradu (‘Company’, ‘we’) by a third-party provider (‘TFA Global Pte Ltd’). Please be reminded that you are solely responsible for the trading decisions on your account. There is a very high degree of risk involved in trading. Any information and/or content is intended entirely for research, educational and informational purposes only and does not constitute investment or consultation advice or investment strategy. The information is not tailored to the investment needs of any specific person and therefore does not involve a consideration of any of the investment objectives, financial situation or needs of any viewer that may receive it. Kindly also note that past performance is not a reliable indicator of future results. Actual results may differ materially from those anticipated in forward-looking or past performance statements. We assume no liability as to the accuracy or completeness of any of the information and/or content provided herein and the Company cannot be held responsible for any omission, mistake nor for any loss or damage including without limitation to any loss of profit which may arise from reliance on any information supplied by TFA Global Pte Ltd.
The speaker(s) is neither an employee, agent nor representative of Tradu and is therefore acting independently. The opinions given are their own, constitute general market commentary, and do not constitute the opinion or advice of Tradu or any form of personal or investment advice. Tradu neither endorses nor guarantees offerings of third-party speakers, nor is Tradu responsible for the content, veracity or opinions of third-party speakers, presenters or participants.

DOTUSD H4 | Bearish reversal off major resistanceDOT/USD is rising towards the sell entry, which acts as an overlap resistance that aligns with the 23.6% Fibonacci retracement and could potentially reverse to the downside from this level.
Sell entry is at 4.007, which is an overlap resistance that lines up with the 23.6% Fibonacci retracement.
Stop loss is at 4.255, which is a pullback resistance that lines up with the 50% Fibonacci retracement.
Take profit is at 3.527, a pullback support that is slightly above the 161.8% Fibonacci extension.
High Risk Investment Warning
Trading Forex/CFDs on margin carries a high level of risk and may not be suitable for all investors. Leverage can work against you.
Stratos Markets Limited (tradu.com ):
CFDs are complex instruments and come with a high risk of losing money rapidly due to leverage. 65% of retail investor accounts lose money when trading CFDs with this provider. You should consider whether you understand how CFDs work and whether you can afford to take the high risk of losing your money.
Stratos Europe Ltd (tradu.com ):
CFDs are complex instruments and come with a high risk of losing money rapidly due to leverage. 66% of retail investor accounts lose money when trading CFDs with this provider. You should consider whether you understand how CFDs work and whether you can afford to take the high risk of losing your money.
Stratos Global LLC (tradu.com ):
Losses can exceed deposits.
Please be advised that the information presented on TradingView is provided to Tradu (‘Company’, ‘we’) by a third-party provider (‘TFA Global Pte Ltd’). Please be reminded that you are solely responsible for the trading decisions on your account. There is a very high degree of risk involved in trading. Any information and/or content is intended entirely for research, educational and informational purposes only and does not constitute investment or consultation advice or investment strategy. The information is not tailored to the investment needs of any specific person and therefore does not involve a consideration of any of the investment objectives, financial situation or needs of any viewer that may receive it. Kindly also note that past performance is not a reliable indicator of future results. Actual results may differ materially from those anticipated in forward-looking or past performance statements. We assume no liability as to the accuracy or completeness of any of the information and/or content provided herein and the Company cannot be held responsible for any omission, mistake nor for any loss or damage including without limitation to any loss of profit which may arise from reliance on any information supplied by TFA Global Pte Ltd.
The speaker(s) is neither an employee, agent nor representative of Tradu and is therefore acting independently. The opinions given are their own, constitute general market commentary, and do not constitute the opinion or advice of Tradu or any form of personal or investment advice. Tradu neither endorses nor guarantees offerings of third-party speakers, nor is Tradu responsible for the content, veracity or opinions of third-party speakers, presenters or participants.

DOTUSD H4 | Heading into major into major resistanceDOT/USD is rising towards the sell entry which is a pullback resistance that is slightly above the 61.8% Fibonacci projection and the 161.8% Fibonacci extension and could reverse from this level to he downside.
Sell entry is at 4.496, which is a pullback resistance that is slightly above the 61.8% Fibonacci projection and the 161.8% Fibonacci extension.
Stop loss is at 4.794, which is a pullback resistance that is slightly above the 100% Fibonacci projection.
Take profit is at 4.004, whichis an overlap support.
High Risk Investment Warning
Trading Forex/CFDs on margin carries a high level of risk and may not be suitable for all investors. Leverage can work against you.
Stratos Markets Limited (tradu.com/uk ):
CFDs are complex instruments and come with a high risk of losing money rapidly due to leverage. 65% of retail investor accounts lose money when trading CFDs with this provider. You should consider whether you understand how CFDs work and whether you can afford to take the high risk of losing your money.
Stratos Europe Ltd (tradu.com/eu ):
CFDs are complex instruments and come with a high risk of losing money rapidly due to leverage. 66% of retail investor accounts lose money when trading CFDs with this provider. You should consider whether you understand how CFDs work and whether you can afford to take the high risk of losing your money.
Stratos Global LLC (tradu.com/en ):
Losses can exceed deposits.
Please be advised that the information presented on TradingView is provided to Tradu (‘Company’, ‘we’) by a third-party provider (‘TFA Global Pte Ltd’). Please be reminded that you are solely responsible for the trading decisions on your account. There is a very high degree of risk involved in trading. Any information and/or content is intended entirely for research, educational and informational purposes only and does not constitute investment or consultation advice or investment strategy. The information is not tailored to the investment needs of any specific person and therefore does not involve a consideration of any of the investment objectives, financial situation or needs of any viewer that may receive it. Kindly also note that past performance is not a reliable indicator of future results. Actual results may differ materially from those anticipated in forward-looking or past performance statements. We assume no liability as to the accuracy or completeness of any of the information and/or content provided herein and the Company cannot be held responsible for any omission, mistake nor for any loss or damage including without limitation to any loss of profit which may arise from reliance on any information supplied by TFA Global Pte Ltd.
The speaker(s) is neither an employee, agent nor representative of Tradu and is therefore acting independently. The opinions given are their own, constitute general market commentary, and do not constitute the opinion or advice of Tradu or any form of personal or investment advice. Tradu neither endorses nor guarantees offerings of third-party speakers, nor is Tradu responsible for the content, veracity or opinions of third-party speakers, presenters or participants.

DOTUSD H1 | Bearish reversal forming off 50% Fibonacci levelDOTUSD is rising towards the sell entry, which is a pullback resistance that aligns with the 50% Fibonacci retracement and could reverse from this level to the downside.
Sell entry is at 4.118, which is a pullback resistance that aligns with the 50% Fibonacci retracement.
Stop loss is at 4.25, which is a swing high resistance.
Take profit is at 3.90, which is an overlap support that is slightly below the 50% Fibonacci retracement.
High Risk Investment Warning
Trading Forex/CFDs on margin carries a high level of risk and may not be suitable for all investors. Leverage can work against you.
Stratos Markets Limited (tradu.com ):
CFDs are complex instruments and come with a high risk of losing money rapidly due to leverage. 65% of retail investor accounts lose money when trading CFDs with this provider. You should consider whether you understand how CFDs work and whether you can afford to take the high risk of losing your money.
Stratos Europe Ltd (tradu.com ):
CFDs are complex instruments and come with a high risk of losing money rapidly due to leverage. 66% of retail investor accounts lose money when trading CFDs with this provider. You should consider whether you understand how CFDs work and whether you can afford to take the high risk of losing your money.
Stratos Global LLC (tradu.com ):
Losses can exceed deposits.
Please be advised that the information presented on TradingView is provided to Tradu (‘Company’, ‘we’) by a third-party provider (‘TFA Global Pte Ltd’). Please be reminded that you are solely responsible for the trading decisions on your account. There is a very high degree of risk involved in trading. Any information and/or content is intended entirely for research, educational and informational purposes only and does not constitute investment or consultation advice or investment strategy. The information is not tailored to the investment needs of any specific person and therefore does not involve a consideration of any of the investment objectives, financial situation or needs of any viewer that may receive it. Kindly also note that past performance is not a reliable indicator of future results. Actual results may differ materially from those anticipated in forward-looking or past performance statements. We assume no liability as to the accuracy or completeness of any of the information and/or content provided herein and the Company cannot be held responsible for any omission, mistake nor for any loss or damage including without limitation to any loss of profit which may arise from reliance on any information supplied by TFA Global Pte Ltd.
The speaker(s) is neither an employee, agent nor representative of Tradu and is therefore acting independently. The opinions given are their own, constitute general market commentary, and do not constitute the opinion or advice of Tradu or any form of personal or investment advice. Tradu neither endorses nor guarantees offerings of third-party speakers, nor is Tradu responsible for the content, veracity or opinions of third-party speakers, presenters or participants.
