DOT USD at the bottomDOT is at the bottom where the Wyckoff Accumulation Pattern was formed and it is in the final stages and I expect to start rising from these levels. The first target will be the top of the pattern at a price of $10. Breaking the top will open the way to the distant targets. I note that a huge limit has been set by Polkadot DAO on the network, as the total supply of tokens that will be minted has been changed. A ceiling has been set for it at 2.1 billion DOTs , unlike what was previously there was no ceiling, as the number of tokens was be around 5billion DOT in the year 2050.
Long-term targets:
22$
36$
60$
90$
140$
DOTUSD

DOT USD bull market
DOT is at the bottom where the Wyckoff Accumulation Pattern was formed and it is in the final stages and I expect to start rising from these levels. The first target will be the top of the pattern at a price of $10. Breaking the top will open the way to the distant targets. I note that a huge limit has been set by Polkadot governance (DAO) on the network, as the total supply of tokens that will be minted has been changed. A ceiling has been set for it at 2.1 billion DOTs , unlike what was previously there was no ceiling, as the number of tokens was be around 5billion DOT in the year 2050.
Long-term targets:
22$
36$
60$
90$
140$

DOT ; Boring movementsHello friends
According to the decline we have, you can see that the price has created an ascending channel and is slowly rising.
But there is an important resistance in its way, which it has hit once and caused a price correction, and the price is gathering strength to rise again.
Now, if this resistance is reliably broken and the price stabilizes above it, the price can move to the specified targets.
*Trade safely with us*

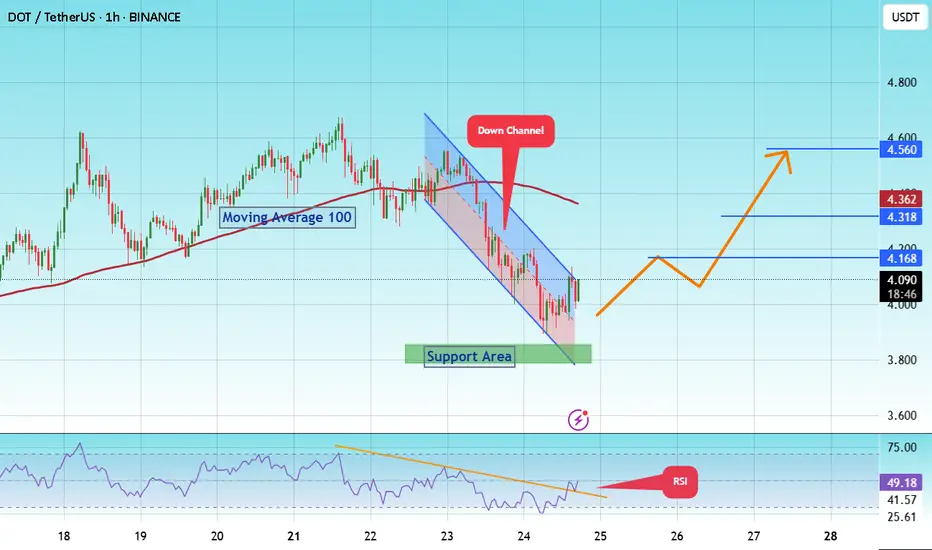
#DOT/Eyes 15% Rally, Targeting Key $ 4.560 Resistance Level#DOT
The price is moving within a descending channel on the 1-hour frame and is expected to break and continue upward.
We have a trend to stabilize above the 100 moving average once again.
We have a downtrend on the RSI indicator that supports the upward break.
We have a support area at the lower limit of the channel at 3,870, acting as strong support from which the price can rebound.
We have a major support area in green that pushed the price higher at 3,800.
Entry price: 4.084
First target: 4.168
Second target: 4.318
Third target: 4.560
To manage risk, don't forget stop loss and capital management.
When you reach the first target, save some profits and then change your stop order to an entry order.
For inquiries, please comment.
Thank you.
DOT/USDT has not made a new all-time high in the current cycle.In my opinion, in this cycle, considering the end of the trend and the fact that it hasn’t formed a proper bottom, we are unlikely to see a new high. However, we could reach the 50% or 68% retracement levels of the previous decline and start the first impulsive wave. This movement is similar to what XRP experienced in the previous cycle.
Polkadot: Rally Gains MomentumPolkadot’s DOT token has posted impressive gains recently. We primarily attribute this rally to wave iii in orange, which appears poised to break decisively above the $4.68 resistance level. At the same time, we see a 30% chance that a new correction low could still develop within the green alternative Target Zone between $3.22 and $2.31.

DOT; BUY OR SELL?Hello friends
Given the good growth we had, the price has formed a triangle, and if the triangle breaks, the price can move to the specified targets.
If the price falls, we have two excellent support areas that the price will definitely react to.
*Trade safely with us*

DOTUSD H4 | Bullish bounce off supportBased on the H4 chart analysis, we could see the price fall to the buy entry, which is a pullback support and could bounce from this level to the upside.
Buy entry is at 3.748, which is a pullback support.
Stop loss is at 3.552, which is a pullback support.
Take profit is at 4.006, which is a swing high resistance.
High Risk Investment Warning
Trading Forex/CFDs on margin carries a high level of risk and may not be suitable for all investors. Leverage can work against you.
Stratos Markets Limited (tradu.com ):
CFDs are complex instruments and come with a high risk of losing money rapidly due to leverage. 65% of retail investor accounts lose money when trading CFDs with this provider. You should consider whether you understand how CFDs work and whether you can afford to take the high risk of losing your money.
Stratos Europe Ltd (tradu.com ):
CFDs are complex instruments and come with a high risk of losing money rapidly due to leverage. 66% of retail investor accounts lose money when trading CFDs with this provider. You should consider whether you understand how CFDs work and whether you can afford to take the high risk of losing your money.
Stratos Global LLC (tradu.com ):
Losses can exceed deposits.
Please be advised that the information presented on TradingView is provided to Tradu (‘Company’, ‘we’) by a third-party provider (‘TFA Global Pte Ltd’). Please be reminded that you are solely responsible for the trading decisions on your account. There is a very high degree of risk involved in trading. Any information and/or content is intended entirely for research, educational and informational purposes only and does not constitute investment or consultation advice or investment strategy. The information is not tailored to the investment needs of any specific person and therefore does not involve a consideration of any of the investment objectives, financial situation or needs of any viewer that may receive it. Kindly also note that past performance is not a reliable indicator of future results. Actual results may differ materially from those anticipated in forward-looking or past performance statements. We assume no liability as to the accuracy or completeness of any of the information and/or content provided herein and the Company cannot be held responsible for any omission, mistake nor for any loss or damage including without limitation to any loss of profit which may arise from reliance on any information supplied by TFA Global Pte Ltd.
The speaker(s) is neither an employee, agent nor representative of Tradu and is therefore acting independently. The opinions given are their own, constitute general market commentary, and do not constitute the opinion or advice of Tradu or any form of personal or investment advice. Tradu neither endorses nor guarantees offerings of third-party speakers, nor is Tradu responsible for the content, veracity or opinions of third-party speakers, presenters or participants.

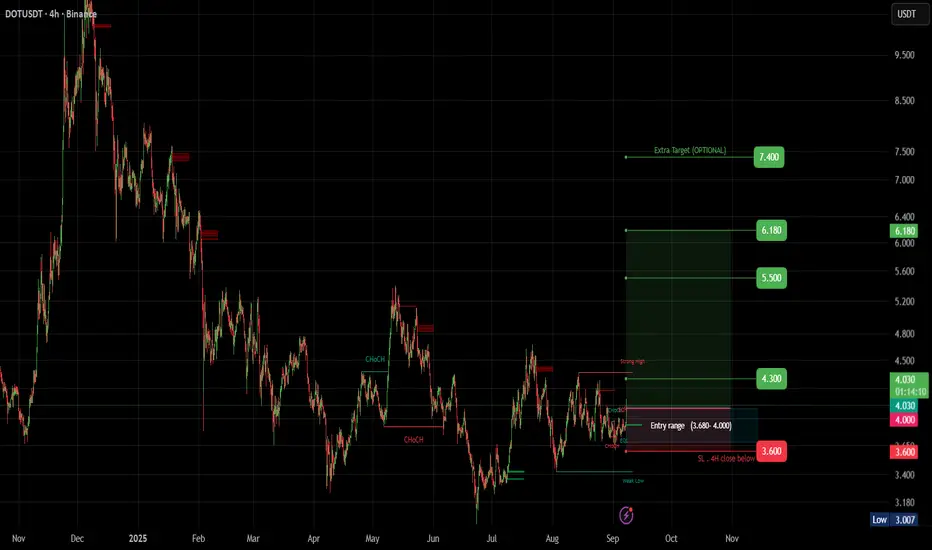
DOT (SPOT)BINANCE:DOTUSDT
#DOT / USDT
Entry range (3.680- 4.000)
SL 1D close below 3.600
T1 4.300
T2 5.500
T3 6.180
Extra Target is optional 7.400
_______________________________________________________
Golden Advices.
********************
* collect the coin slowly in the entry range.
* Please calculate your losses before the entry.
* Do not enter any trade you find it not suitable for you.
* No FOMO - No Rush , it is a long journey.
DOTUSD H4 | Bullish bounce off major supportBased on the H4 chart analysis, we can see that the price has bounced off the buy entry, which is an overlap support that aligns with the78.6% Fibonacci projection and could rise to the take profit.
Buy entry is at 3.479, which is an overlap support that lines up with hte 78.6% Fibonacci projection.
Stop loss is at 3.189, which is a swing low support.
Take profit is at 3.837, which is a pullback resistance.
High Risk Investment Warning
Trading Forex/CFDs on margin carries a high level of risk and may not be suitable for all investors. Leverage can work against you.
Stratos Markets Limited (tradu.com ):
CFDs are complex instruments and come with a high risk of losing money rapidly due to leverage. 65% of retail investor accounts lose money when trading CFDs with this provider. You should consider whether you understand how CFDs work and whether you can afford to take the high risk of losing your money.
Stratos Europe Ltd (tradu.com ):
CFDs are complex instruments and come with a high risk of losing money rapidly due to leverage. 66% of retail investor accounts lose money when trading CFDs with this provider. You should consider whether you understand how CFDs work and whether you can afford to take the high risk of losing your money.
Stratos Global LLC (tradu.com ):
Losses can exceed deposits.
Please be advised that the information presented on TradingView is provided to Tradu (‘Company’, ‘we’) by a third-party provider (‘TFA Global Pte Ltd’). Please be reminded that you are solely responsible for the trading decisions on your account. There is a very high degree of risk involved in trading. Any information and/or content is intended entirely for research, educational and informational purposes only and does not constitute investment or consultation advice or investment strategy. The information is not tailored to the investment needs of any specific person and therefore does not involve a consideration of any of the investment objectives, financial situation or needs of any viewer that may receive it. Kindly also note that past performance is not a reliable indicator of future results. Actual results may differ materially from those anticipated in forward-looking or past performance statements. We assume no liability as to the accuracy or completeness of any of the information and/or content provided herein and the Company cannot be held responsible for any omission, mistake nor for any loss or damage including without limitation to any loss of profit which may arise from reliance on any information supplied by TFA Global Pte Ltd.
The speaker(s) is neither an employee, agent nor representative of Tradu and is therefore acting independently. The opinions given are their own, constitute general market commentary, and do not constitute the opinion or advice of Tradu or any form of personal or investment advice. Tradu neither endorses nor guarantees offerings of third-party speakers, nor is Tradu responsible for the content, veracity or opinions of third-party speakers, presenters or participants.

DOTUSD H4 | Bearish Pressure Likely to ExtendDOT/USD is rising towards the sell entry, which is a pullback resistance that aligns with the 78.6% Fibonacci retracement and could reverse from this level to our take profit.
Sell entry is at 3.899, which is a pullback resistance that lines up with the 78.6% Fibonacci retracement.
Stop loss is at 4.154, which is a swing high resistance that aligns with the 127.2% Fibonacci extension.
Take profit is at 3.587, a pullback support.
High Risk Investment Warning
Trading Forex/CFDs on margin carries a high level of risk and may not be suitable for all investors. Leverage can work against you.
Stratos Markets Limited (tradu.com ):
CFDs are complex instruments and come with a high risk of losing money rapidly due to leverage. 65% of retail investor accounts lose money when trading CFDs with this provider. You should consider whether you understand how CFDs work and whether you can afford to take the high risk of losing your money.
Stratos Europe Ltd (tradu.com ):
CFDs are complex instruments and come with a high risk of losing money rapidly due to leverage. 66% of retail investor accounts lose money when trading CFDs with this provider. You should consider whether you understand how CFDs work and whether you can afford to take the high risk of losing your money.
Stratos Global LLC (tradu.com ):
Losses can exceed deposits.
Please be advised that the information presented on TradingView is provided to Tradu (‘Company’, ‘we’) by a third-party provider (‘TFA Global Pte Ltd’). Please be reminded that you are solely responsible for the trading decisions on your account. There is a very high degree of risk involved in trading. Any information and/or content is intended entirely for research, educational and informational purposes only and does not constitute investment or consultation advice or investment strategy. The information is not tailored to the investment needs of any specific person and therefore does not involve a consideration of any of the investment objectives, financial situation or needs of any viewer that may receive it. Kindly also note that past performance is not a reliable indicator of future results. Actual results may differ materially from those anticipated in forward-looking or past performance statements. We assume no liability as to the accuracy or completeness of any of the information and/or content provided herein and the Company cannot be held responsible for any omission, mistake nor for any loss or damage including without limitation to any loss of profit which may arise from reliance on any information supplied by TFA Global Pte Ltd.
The speaker(s) is neither an employee, agent nor representative of Tradu and is therefore acting independently. The opinions given are their own, constitute general market commentary, and do not constitute the opinion or advice of Tradu or any form of personal or investment advice. Tradu neither endorses nor guarantees offerings of third-party speakers, nor is Tradu responsible for the content, veracity or opinions of third-party speakers, presenters or participants.

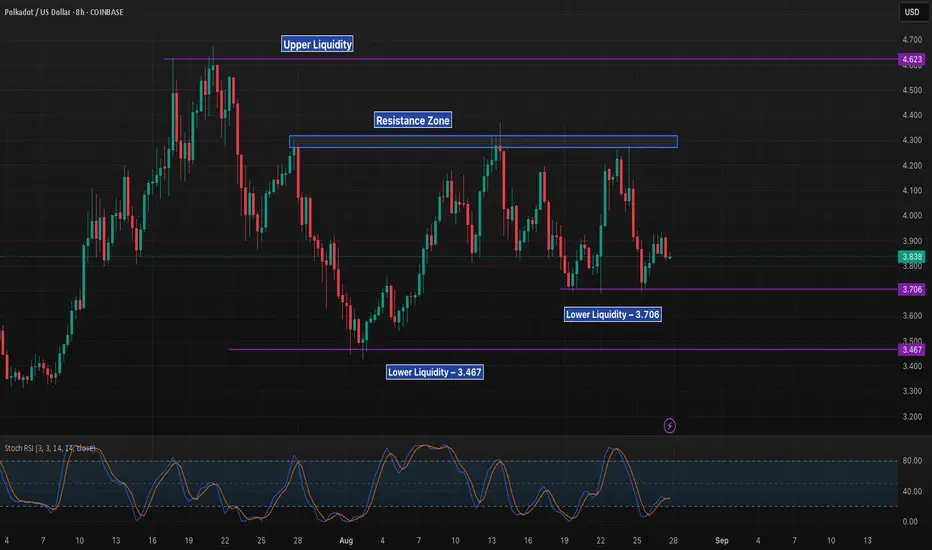
DOT 8H – Range Between Liquidity Levels, Breakout or Breakdown?Polkadot is trading in a defined range, capped by resistance at $4.20–$4.30 and supported between $3.70 and $3.46. These liquidity levels have repeatedly shaped recent price action.
Bullish path: A breakout above resistance could target the $4.62 liquidity level.
Bearish path: Losing $3.70 risks a sweep of $3.46 liquidity and possible continuation lower.
Stoch RSI is rising from oversold territory, but confirmation will require strength above resistance. Until then, DOT remains trapped in consolidation between these key zones.
DOTUSD H4 | Bullish bounce offBased on the H4 chart analysis, we could see the price fall to the buy entry, which acts as an overlap support that aligns with the 78.6% Fibonacci projection and could bounce from this level to the take profit.
Buy entry is at 3.479, which is an overlap support that lines up with the 78.6% Fibonacci projection.
Stop loss is at 3.183, which is a swing low support that lines up with the 127.2% Fibonacci extension.
Take profit is at 3.825, which is a pullback resistance.
High Risk Investment Warning
Trading Forex/CFDs on margin carries a high level of risk and may not be suitable for all investors. Leverage can work against you.
Stratos Markets Limited (tradu.com ):
CFDs are complex instruments and come with a high risk of losing money rapidly due to leverage. 65% of retail investor accounts lose money when trading CFDs with this provider. You should consider whether you understand how CFDs work and whether you can afford to take the high risk of losing your money.
Stratos Europe Ltd (tradu.com ):
CFDs are complex instruments and come with a high risk of losing money rapidly due to leverage. 66% of retail investor accounts lose money when trading CFDs with this provider. You should consider whether you understand how CFDs work and whether you can afford to take the high risk of losing your money.
Stratos Global LLC (tradu.com ):
Losses can exceed deposits.
Please be advised that the information presented on TradingView is provided to Tradu (‘Company’, ‘we’) by a third-party provider (‘TFA Global Pte Ltd’). Please be reminded that you are solely responsible for the trading decisions on your account. There is a very high degree of risk involved in trading. Any information and/or content is intended entirely for research, educational and informational purposes only and does not constitute investment or consultation advice or investment strategy. The information is not tailored to the investment needs of any specific person and therefore does not involve a consideration of any of the investment objectives, financial situation or needs of any viewer that may receive it. Kindly also note that past performance is not a reliable indicator of future results. Actual results may differ materially from those anticipated in forward-looking or past performance statements. We assume no liability as to the accuracy or completeness of any of the information and/or content provided herein and the Company cannot be held responsible for any omission, mistake nor for any loss or damage including without limitation to any loss of profit which may arise from reliance on any information supplied by TFA Global Pte Ltd.
The speaker(s) is neither an employee, agent nor representative of Tradu and is therefore acting independently. The opinions given are their own, constitute general market commentary, and do not constitute the opinion or advice of Tradu or any form of personal or investment advice. Tradu neither endorses nor guarantees offerings of third-party speakers, nor is Tradu responsible for the content, veracity or opinions of third-party speakers, presenters or participants.

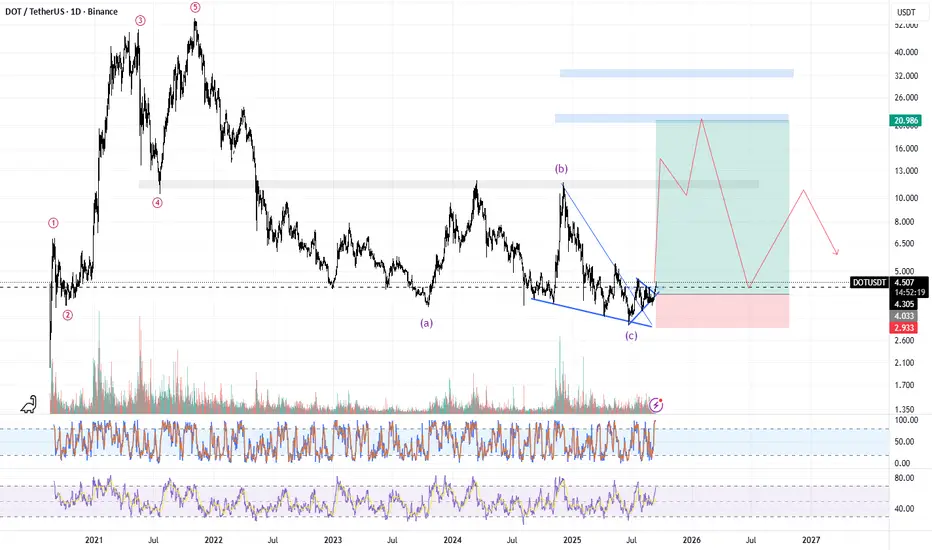
Polkadot Holds Key Support - Analysts See Toward $23 Long-TermThe price has reacted positively to a key weekly support zone, which has prevented further downside movement. As seen on the chart, the latest pivot low is higher than the previous pivot low, and the resistance that had created the lowest low was unsuccessfully broken once.
taken together, these signals suggest the beginning of a bullish trend that could provide solid returns for investors.
Price targets:
> $5.40
> $6-7
> $9
> $11
if the $10-11 resistance zone will get broken, the price has the potential to reach $23 an ultimately $49 -- although these two targets are currently considered long-term and less attainable in the near future.
This analysis reflects personal opinion and is not financial advise.

Polkadot Dot usdt daily analysis
Time frame hourly
Risk rewards ratio =1.75
Target = 4.33 $
I expected the price to drop to $3.67 and then rise.
Now, in the short term, I’m opening a position with low risk. If this position gets closed, we’ll have to see whether the price breaks the green trendline or continues fluctuating between these two lines.

DOTUSD H4 | Bullish bounce off major supportBased on the H4 chart analysis, we could se the price fall to the buy entry which is an overlap supprt and could bounce from this level to the upside.
Buy entry is at 3.479, which is an overlap support that is slightly below the 127.2% Fibonacci extension.
Stop loss is at 3.178, which is a swing low support.
Take profit is at 3.825, which is a pullback resistance.
High Risk Investment Warning
Trading Forex/CFDs on margin carries a high level of risk and may not be suitable for all investors. Leverage can work against you.
Stratos Markets Limited (tradu.com ):
CFDs are complex instruments and come with a high risk of losing money rapidly due to leverage. 65% of retail investor accounts lose money when trading CFDs with this provider. You should consider whether you understand how CFDs work and whether you can afford to take the high risk of losing your money.
Stratos Europe Ltd (tradu.com ):
CFDs are complex instruments and come with a high risk of losing money rapidly due to leverage. 66% of retail investor accounts lose money when trading CFDs with this provider. You should consider whether you understand how CFDs work and whether you can afford to take the high risk of losing your money.
Stratos Global LLC (tradu.com ):
Losses can exceed deposits.
Please be advised that the information presented on TradingView is provided to Tradu (‘Company’, ‘we’) by a third-party provider (‘TFA Global Pte Ltd’). Please be reminded that you are solely responsible for the trading decisions on your account. There is a very high degree of risk involved in trading. Any information and/or content is intended entirely for research, educational and informational purposes only and does not constitute investment or consultation advice or investment strategy. The information is not tailored to the investment needs of any specific person and therefore does not involve a consideration of any of the investment objectives, financial situation or needs of any viewer that may receive it. Kindly also note that past performance is not a reliable indicator of future results. Actual results may differ materially from those anticipated in forward-looking or past performance statements. We assume no liability as to the accuracy or completeness of any of the information and/or content provided herein and the Company cannot be held responsible for any omission, mistake nor for any loss or damage including without limitation to any loss of profit which may arise from reliance on any information supplied by TFA Global Pte Ltd.
The speaker(s) is neither an employee, agent nor representative of Tradu and is therefore acting independently. The opinions given are their own, constitute general market commentary, and do not constitute the opinion or advice of Tradu or any form of personal or investment advice. Tradu neither endorses nor guarantees offerings of third-party speakers, nor is Tradu responsible for the content, veracity or opinions of third-party speakers, presenters or participants.

DOTUSD H4 | Bearish drop off 50% Fibonacci resistanceDOT/USD is rising towards the sell entry which is a pullback resistance that lines up with the 50% Fibonacci retracement and could reverse to the take profit.
Sell entry is at 3.982, which is a pullback resistance that lines up with the 50% Fibonacci retracement.
Stop loss is at 4.165, which is an overlap resistance.
Take profit is at 3.600, which is a pullback support that is slightly above the 78.6% Fibonacci retracement.
High Risk Investment Warning
Trading Forex/CFDs on margin carries a high level of risk and may not be suitable for all investors. Leverage can work against you.
Stratos Markets Limited (tradu.com ):
CFDs are complex instruments and come with a high risk of losing money rapidly due to leverage. 65% of retail investor accounts lose money when trading CFDs with this provider. You should consider whether you understand how CFDs work and whether you can afford to take the high risk of losing your money.
Stratos Europe Ltd (tradu.com ):
CFDs are complex instruments and come with a high risk of losing money rapidly due to leverage. 66% of retail investor accounts lose money when trading CFDs with this provider. You should consider whether you understand how CFDs work and whether you can afford to take the high risk of losing your money.
Stratos Global LLC (tradu.com ):
Losses can exceed deposits.
Please be advised that the information presented on TradingView is provided to Tradu (‘Company’, ‘we’) by a third-party provider (‘TFA Global Pte Ltd’). Please be reminded that you are solely responsible for the trading decisions on your account. There is a very high degree of risk involved in trading. Any information and/or content is intended entirely for research, educational and informational purposes only and does not constitute investment or consultation advice or investment strategy. The information is not tailored to the investment needs of any specific person and therefore does not involve a consideration of any of the investment objectives, financial situation or needs of any viewer that may receive it. Kindly also note that past performance is not a reliable indicator of future results. Actual results may differ materially from those anticipated in forward-looking or past performance statements. We assume no liability as to the accuracy or completeness of any of the information and/or content provided herein and the Company cannot be held responsible for any omission, mistake nor for any loss or damage including without limitation to any loss of profit which may arise from reliance on any information supplied by TFA Global Pte Ltd.
The speaker(s) is neither an employee, agent nor representative of Tradu and is therefore acting independently. The opinions given are their own, constitute general market commentary, and do not constitute the opinion or advice of Tradu or any form of personal or investment advice. Tradu neither endorses nor guarantees offerings of third-party speakers, nor is Tradu responsible for the content, veracity or opinions of third-party speakers, presenters or participants.

DOTUSD H4| Bearish reversal off Fib confluenceDOT/USD is rising towards the sell entry which is an overlap resistance and could reverse to the downside.
Sell entry is at 4.161, which is an overlap resistance that aligns with the 127.2% Fib extension, 78.6% Fib projection and slightly above the 61.8% Fibonacci retracement.
Stop loss is at 4.530, which is a swing high resistance.
Take profit is at 3.744, which is an overlap support.
High Risk Investment Warning
Trading Forex/CFDs on margin carries a high level of risk and may not be suitable for all investors. Leverage can work against you.
Stratos Markets Limited (tradu.com ):
CFDs are complex instruments and come with a high risk of losing money rapidly due to leverage. 65% of retail investor accounts lose money when trading CFDs with this provider. You should consider whether you understand how CFDs work and whether you can afford to take the high risk of losing your money.
Stratos Europe Ltd (tradu.com ):
CFDs are complex instruments and come with a high risk of losing money rapidly due to leverage. 66% of retail investor accounts lose money when trading CFDs with this provider. You should consider whether you understand how CFDs work and whether you can afford to take the high risk of losing your money.
Stratos Global LLC (tradu.com ):
Losses can exceed deposits.
Please be advised that the information presented on TradingView is provided to Tradu (‘Company’, ‘we’) by a third-party provider (‘TFA Global Pte Ltd’). Please be reminded that you are solely responsible for the trading decisions on your account. There is a very high degree of risk involved in trading. Any information and/or content is intended entirely for research, educational and informational purposes only and does not constitute investment or consultation advice or investment strategy. The information is not tailored to the investment needs of any specific person and therefore does not involve a consideration of any of the investment objectives, financial situation or needs of any viewer that may receive it. Kindly also note that past performance is not a reliable indicator of future results. Actual results may differ materially from those anticipated in forward-looking or past performance statements. We assume no liability as to the accuracy or completeness of any of the information and/or content provided herein and the Company cannot be held responsible for any omission, mistake nor for any loss or damage including without limitation to any loss of profit which may arise from reliance on any information supplied by TFA Global Pte Ltd.
The speaker(s) is neither an employee, agent nor representative of Tradu and is therefore acting independently. The opinions given are their own, constitute general market commentary, and do not constitute the opinion or advice of Tradu or any form of personal or investment advice. Tradu neither endorses nor guarantees offerings of third-party speakers, nor is Tradu responsible for the content, veracity or opinions of third-party speakers, presenters or participants.

DOT/USDT Profit Heist | Don’t Let Bears Catch You🚨Polkadot Crypto Vault Break-In Plan | DOT/USDT Robbery Blueprint🚨
🌍 Hola Heist Crew! 💰📡
Ready for another vault-cracking strategy? Here's your DOT/USDT Crypto Heist Plan based on pure Thief Trading Style™—a fusion of smart-money tactics, technical traps, and stealth execution. 🎯💸
🔓 🎯 Entry Zone – Lockpick Ready
"The vault’s wide open! Swipe the bullish loot anywhere, anytime—but smart thieves plan pullback entries."
📌 Recommended: Use 15–30 min timeframe for sniper buys near swing highs/lows.
💡 Pro Move: DCA with layered buy limits like a seasoned thief stacking getaway routes. 🧠💵
🚔 Stop Loss – Evade the Patrol
📍 Secure SL just below the nearest 4H candle wick low (e.g., 4.000 zone)
🔐 Customize SL to match your risk profile & lot size—escape routes vary by thief rank.
💣 Target – Break the Vault & Vanish
🎯 TP: 5.200
🕶️ Optional: Dip out early if market heat rises near resistance traps. Escape clean.
⚠️ High Alert – Police Checkpoint Ahead
👮 Red MA Zone = Barricade.
It’s a hotspot for bearish cops + consolidation traps.
Only strong thieves survive here—book profits before you get cornered.
💼 For Scalpers & Swing Agents
🔍 Scalpers: Only ride long—quick bags, quick exit.
💰 Swingers: Follow the full robbery plan. Patience pays.
🎯 Trailing SL is your body armor—keep it tight.
📊 Fundamental Force Behind the Break-In
🔥 DOT/USDT is flashing bullish momentum supported by:
Sentiment shift
Intermarket alignment
COT positioning
On-chain data
📡 Stay updated via macro reports & sentiment dashboards—intel is profit.
📰 News Alert – Chaos Creates Opportunity
🧨 Avoid fresh entries during high-volatility news drops.
🎯 Trailing SL can save you during headline crossfire.
❗️Disclaimer:
This blueprint is for educational purposes only. Always conduct your own recon and apply strict risk management. Thieves who don’t scout first... get caught.
🚀 Boost the Heist – Support the Crew
💥 Smash that “Boost” if this plan adds value 💥
Your boost fuels more chart crimes, more profit hits, and a growing rob-the-market brotherhood! 💪💼📈
🧨 See you in the next job... Stay hidden, stay funded!
– Thief Trading Style™ HQ 🕶️🐱👤💰🚁

DOTUSDT - The Monster!It would be a shame if you’ve lost hope in DOT like many others have recently.
This is a strong project with a large market cap, and in every bullish season, it delivers solid performance — not explosive, but consistent. A moment will come when you’ll regret not buying it at $4.
From an investment perspective, its minimum long-term target is $40, while its more conservative mid-term target is $10.
Currently, the coin has broken out of a falling wedge pattern with a successful retest and has crossed above the 25 EMA on the 3-day chart.
These are all bullish indicators and a clear opportunity, especially with a nearby stop loss at $3.5.
Best regards:
Ceciliones🎯

DOTUSD | H4 Bullish reversalDOT/USD has bounced off the buy entry which is a pullback support and could potentially rise to the take profit.
Buy entry is at 3.482, which is a pullback support that aligns with the 78.6% Fibonacci retracement.
Stop loss is at 3.187, which is a swing low support.
Take profit is at 3.801, which is a pullback resistance that aligns with the 50% Fibonacci retracement.
High Risk Investment Warning
Trading Forex/CFDs on margin carries a high level of risk and may not be suitable for all investors. Leverage can work against you.
Stratos Markets Limited (tradu.com ):
CFDs are complex instruments and come with a high risk of losing money rapidly due to leverage. 65% of retail investor accounts lose money when trading CFDs with this provider. You should consider whether you understand how CFDs work and whether you can afford to take the high risk of losing your money.
Stratos Europe Ltd (tradu.com ):
CFDs are complex instruments and come with a high risk of losing money rapidly due to leverage. 66% of retail investor accounts lose money when trading CFDs with this provider. You should consider whether you understand how CFDs work and whether you can afford to take the high risk of losing your money.
Stratos Global LLC (tradu.com ):
Losses can exceed deposits.
Please be advised that the information presented on TradingView is provided to Tradu (‘Company’, ‘we’) by a third-party provider (‘TFA Global Pte Ltd’). Please be reminded that you are solely responsible for the trading decisions on your account. There is a very high degree of risk involved in trading. Any information and/or content is intended entirely for research, educational and informational purposes only and does not constitute investment or consultation advice or investment strategy. The information is not tailored to the investment needs of any specific person and therefore does not involve a consideration of any of the investment objectives, financial situation or needs of any viewer that may receive it. Kindly also note that past performance is not a reliable indicator of future results. Actual results may differ materially from those anticipated in forward-looking or past performance statements. We assume no liability as to the accuracy or completeness of any of the information and/or content provided herein and the Company cannot be held responsible for any omission, mistake nor for any loss or damage including without limitation to any loss of profit which may arise from reliance on any information supplied by TFA Global Pte Ltd.
The speaker(s) is neither an employee, agent nor representative of Tradu and is therefore acting independently. The opinions given are their own, constitute general market commentary, and do not constitute the opinion or advice of Tradu or any form of personal or investment advice. Tradu neither endorses nor guarantees offerings of third-party speakers, nor is Tradu responsible for the content, veracity or opinions of third-party speakers, presenters or participants.

DOTUSD H4 | Bullish reversalThe price has bounced off the buy entry, which is a pullback support, and could potentially rise from this level to the upside.
Buy entry is at 3.482, which is a pullback support that aligns with the 78.6% Fibonacci retracement.
Stop loss is at 3.18, which is a swing low support.
Take profit is at 3.80, which is a pullback resistance that aligns with the 50% Fibonacci retracement.
High Risk Investment Warning
Trading Forex/CFDs on margin carries a high level of risk and may not be suitable for all investors. Leverage can work against you.
Stratos Markets Limited (tradu.com ):
CFDs are complex instruments and come with a high risk of losing money rapidly due to leverage. 65% of retail investor accounts lose money when trading CFDs with this provider. You should consider whether you understand how CFDs work and whether you can afford to take the high risk of losing your money.
Stratos Europe Ltd (tradu.com ):
CFDs are complex instruments and come with a high risk of losing money rapidly due to leverage. 66% of retail investor accounts lose money when trading CFDs with this provider. You should consider whether you understand how CFDs work and whether you can afford to take the high risk of losing your money.
Stratos Global LLC (tradu.com ):
Losses can exceed deposits.
Please be advised that the information presented on TradingView is provided to Tradu (‘Company’, ‘we’) by a third-party provider (‘TFA Global Pte Ltd’). Please be reminded that you are solely responsible for the trading decisions on your account. There is a very high degree of risk involved in trading. Any information and/or content is intended entirely for research, educational and informational purposes only and does not constitute investment or consultation advice or investment strategy. The information is not tailored to the investment needs of any specific person and therefore does not involve a consideration of any of the investment objectives, financial situation or needs of any viewer that may receive it. Kindly also note that past performance is not a reliable indicator of future results. Actual results may differ materially from those anticipated in forward-looking or past performance statements. We assume no liability as to the accuracy or completeness of any of the information and/or content provided herein and the Company cannot be held responsible for any omission, mistake nor for any loss or damage including without limitation to any loss of profit which may arise from reliance on any information supplied by TFA Global Pte Ltd.
The speaker(s) is neither an employee, agent nor representative of Tradu and is therefore acting independently. The opinions given are their own, constitute general market commentary, and do not constitute the opinion or advice of Tradu or any form of personal or investment advice. Tradu neither endorses nor guarantees offerings of third-party speakers, nor is Tradu responsible for the content, veracity or opinions of third-party speakers, presenters or participants.

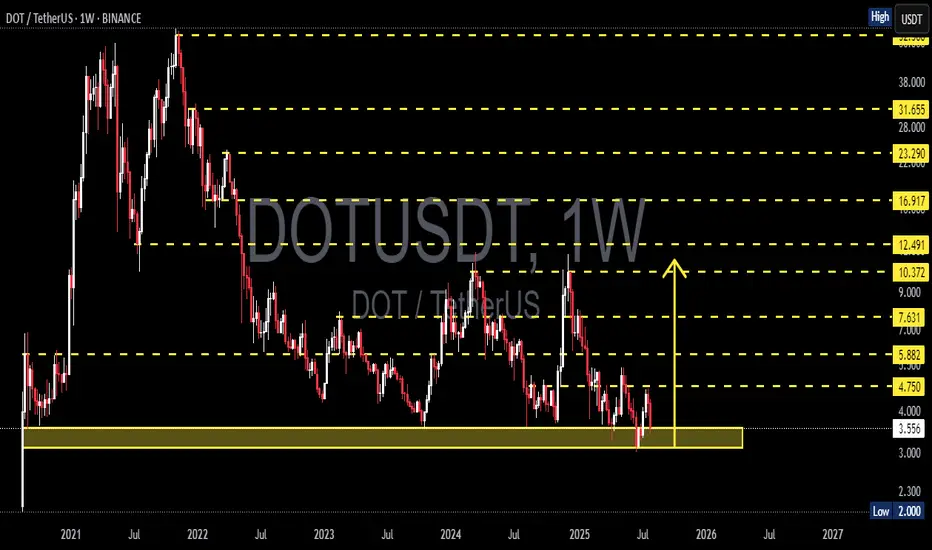
DOTUSDT On the Edge of a Major Rebound or a Devastating BreakdowPolkadot (DOT) is once again retesting one of its strongest macro support zones between $4.00 – $3.55, a historically significant demand area that has provided major price bounces since mid-2022.
This isn’t just a random level—it’s a critical accumulation base where large buyers have consistently shown interest. With price now hovering around this zone again, the next move could be decisive for DOT's mid- to long-term trend.
---
🔍 Price Structure & Key Patterns
Extended Accumulation Phase: DOT has been trading in a sideways range for over 80 weeks, indicating a potential bottoming structure forming after a prolonged downtrend.
Strong Historical Demand: The $4.00 – $3.55 region has acted as a key support multiple times since 2022, reinforcing its importance as a make-or-break zone.
Potential Trap Setup: Current price action could be forming either a bull trap or bear trap, depending on whether price rebounds or breaks down. Weekly candle confirmation will be key.
---
🟢 Bullish Scenario (Upside Reversal)
If price holds and prints a strong bullish candle (e.g., bullish engulfing or long-tailed hammer), expect the following upside targets:
Short-term: $4.75 – $5.88
Mid-term: $7.63 – $9.00
Long-term: $10.37 – $12.49, aligning with prior distribution zones
✅ A breakout from this long accumulation base could trigger a massive short squeeze and renewed buying momentum.
---
🔴 Bearish Scenario (Breakdown)
If DOT closes below $3.55 on the weekly chart:
Confirms breakdown from macro support
Opens downside risk toward $2.30 – $2.00
Would print a new lower low, extending the bear market phase and potentially triggering capitulation
⚠️ Speculative long positions should include tight risk management below $3.50.
---
🧠 Market Sentiment & Strategy
DOT appears to be in a "Capitulation meets Hope" phase—selling pressure is exhausting, but bullish conviction hasn't yet taken control.
Ideal entry zones lie within the current demand range, with tight stops.
Watch for a daily breakout or bullish momentum confirmation next week before committing to positions.
---
📌 Final Takeaway
> DOT is standing at the edge of a cliff—or a launchpad. The $3.55–$4.00 zone has repeatedly been the foundation for rebounds. If history repeats, this may be the beginning of a new uptrend. If not—brace for deeper downside.
⏳ The market is watching. Will DOT break out… or break down?
#DOTUSDT #Polkadot #CryptoTechnicalAnalysis #SupportResistance #CryptoRebound #BearishOrBullish #AltcoinOutlook #CryptoBreakdown #WeeklyChart #AccumulationZone #DOTAnalysis