DOT/Polkadot DropDOT is facing a supply zone (the green area), and the neckline (green) on the RSI has been broken. When the blue line breaks and the RSI pulls back to its broken neckline, that's one of the optimal entry points. This is because stop hunting is highly likely in supply and demand zones, I've drawn the probable path of movement. BINANCE:DOTUSDT
Dotusdsignals

DOTUSD Can this Channel save it from complete obsolescence?Polkadot (DOTUSD) has been trading within a Channel Down since the December 26 2022 Low and it only broke momentarily during last Friday's flash crash. Having recovered instantly above it and closing the 1W candle inside the pattern, it technically counts as a Lower Low.
The last two Lower Lows (both inside 2025), delivered rebound that hit tested the 1W MA50 (blue trend-line). As a result, the obvious technical Target on the medium-term is the 1W MA50 and our (a but more conservative) estimation is $4.600, which is right on the 0.382 Fibonacci Channel level. Of course that's assuming the market doesn't close any 1W candles below the Channel Down. The current price levels offer an excellent Risk/ Reward ratio on this.
If the 1W MA50 breaks, we can see an even more aggressive extension towards the top (Lower Highs trend-line) of the Channel Down. The best indicator for a Sell Signal in that scenario is the 1W RSI Resistance Zone. It has priced the last three major Highs since 2023. Naturally the 1W MA200 (orange trend-line) is the obvious long-term Resistance and potential Target in that scenario but can go even as high as 9.5000 if we repeat the previous +225.10% Bullish Leg.
-------------------------------------------------------------------------------
** Please LIKE 👍, FOLLOW ✅, SHARE 🙌 and COMMENT ✍ if you enjoy this idea! Also share your ideas and charts in the comments section below! This is best way to keep it relevant, support us, keep the content here free and allow the idea to reach as many people as possible. **
-------------------------------------------------------------------------------
💸💸💸💸💸💸
👇 👇 👇 👇 👇 👇

Can DOT/USDT Sustain Its Bullish Momentum This Week?🎯 DOT/USDT: The Kijun Breakout Heist 💎 | Swing/Day Trade Setup
📊 Market Overview: POLKADOT vs TETHER
The DOT/USDT pair is flashing some serious bullish signals, and this setup is looking too good to ignore! We've got a Kijun moving average breakout brewing alongside a CCI momentum oscillator golden cross — the kind of technical alignment that makes traders smile. 😏
🎯 The "Thief Strategy" Game Plan
Trading Style: Swing/Day Trade Hybrid
Bias: BULLISH 🚀
Confirmation: Kijun MA breakout + CCI golden cross momentum surge
💰 Entry Strategy: The Layered Limit Order Approach
Here's where it gets interesting. Instead of market buying like a rookie, we're using multiple limit orders (the "layering strategy") to scale into this position like professionals:
Suggested Entry Layers:
🎯 Layer 1: $4.150
🎯 Layer 2: $4.200
🎯 Layer 3: $4.250
You can add more layers based on your position size and risk appetite. The beauty of layering? You average into the move instead of gambling on one entry!
🛡️ Risk Management Zone
Stop Loss: $4.050 🚨
⚠️ IMPORTANT DISCLAIMER:
Dear Ladies & Gentlemen (Thief OG's) — this is MY stop loss level based on MY analysis. You are NOT obligated to use this level. Trading is YOUR responsibility, YOUR risk, YOUR reward. Set YOUR own stop loss based on YOUR risk tolerance. Manage your money, take your profits, and protect your capital at your own discretion.
🎯 Profit Target: Know When to Exit the Heist
Target Zone: $4.600 💰
This target aligns with:
Strong historical resistance
Overbought RSI/CCI conditions (potential trap zone)
Natural profit-taking area
🚨 Exit Strategy Reminder:
Dear Ladies & Gentlemen (Thief OG's) — this is MY target based on MY technical analysis. You are NOT required to follow this target. Take profits when YOU feel comfortable. Lock in gains, scale out, or let it ride — it's YOUR choice and YOUR capital. Make money, then take money at your own risk.
🔍 Key Technical Indicators Breakdown
✅ Kijun Moving Average: Bullish breakout confirmed
✅ CCI Momentum Oscillator: Golden cross formation (bullish momentum shift)
✅ Price Action: Higher lows forming, trend structure improving
✅ Volume Profile: Increasing buying pressure on breakout levels
💎 Related Pairs to Watch (Correlation Play)
Keep an eye on these correlated assets for confluence:
CRYPTOCAP:DOT Dominance — Overall Polkadot ecosystem strength
$KSM/USDT (Kusama) — Polkadot's canary network, often moves in tandem
$ATOM/USDT (Cosmos) — Similar interoperability narrative
$AVAX/USDT (Avalanche) — Competes in similar L1 smart contract space
$BTC/USDT — King Crypto correlation; DOT typically follows BTC trend direction
$ETH/USDT — Ethereum's strength often lifts altcoins including DOT
Why watch these? If CRYPTOCAP:DOT rallies while CRYPTOCAP:BTC and CRYPTOCAP:ETH consolidate, that's relative strength — a bullish divergence. If ASX:KSM pumps, CRYPTOCAP:DOT often follows. Smart traders watch the whole ecosystem, not just one chart! 👀
🧠 Final Thoughts: Trade Smart, Not Hard
This setup combines:
📈 Momentum confirmation (CCI golden cross)
📊 Trend confirmation (Kijun breakout)
💰 Smart entry execution (layered limits)
🛡️ Defined risk (clear stop loss)
🎯 Clear target (resistance + overbought zone)
The "Thief Strategy" isn't about greed — it's about stealing profits from the market with precision and discipline. Layer in, manage risk, and take profits when the market gives them to you. 💼
📌 Disclaimer
⚠️ This is the "Thief Style" trading strategy — for educational and entertainment purposes only. This analysis is NOT financial advice. Trading crypto carries substantial risk of loss. The "Thief" approach is a fun, stylish way to describe disciplined layered entries, but YOU are responsible for your own trading decisions, risk management, and capital. Trade what you can afford to lose. Do your own research (DYOR).
Not a registered financial advisor. Just a chart enthusiast sharing ideas. 🎨📊
✨ If you find value in my analysis, a 👍 and 🚀 boost is much appreciated — it helps me share more setups with the community!
#DOTUSDT #DOT #Polkadot #CryptoTrading #SwingTrading #DayTrading #TechnicalAnalysis #CCIOscillator #KijunBreakout #CryptoSignals #AltcoinSetup #LayeredEntry #RiskManagement #ThiefStrategy #BullishSetup #MomentumTrading

Polkadot Dot usdt daily analysis
Time frame hourly
Risk rewards ratio =1.75
Target = 4.33 $
I expected the price to drop to $3.67 and then rise.
Now, in the short term, I’m opening a position with low risk. If this position gets closed, we’ll have to see whether the price breaks the green trendline or continues fluctuating between these two lines.

DOT/USDT Profit Heist | Don’t Let Bears Catch You🚨Polkadot Crypto Vault Break-In Plan | DOT/USDT Robbery Blueprint🚨
🌍 Hola Heist Crew! 💰📡
Ready for another vault-cracking strategy? Here's your DOT/USDT Crypto Heist Plan based on pure Thief Trading Style™—a fusion of smart-money tactics, technical traps, and stealth execution. 🎯💸
🔓 🎯 Entry Zone – Lockpick Ready
"The vault’s wide open! Swipe the bullish loot anywhere, anytime—but smart thieves plan pullback entries."
📌 Recommended: Use 15–30 min timeframe for sniper buys near swing highs/lows.
💡 Pro Move: DCA with layered buy limits like a seasoned thief stacking getaway routes. 🧠💵
🚔 Stop Loss – Evade the Patrol
📍 Secure SL just below the nearest 4H candle wick low (e.g., 4.000 zone)
🔐 Customize SL to match your risk profile & lot size—escape routes vary by thief rank.
💣 Target – Break the Vault & Vanish
🎯 TP: 5.200
🕶️ Optional: Dip out early if market heat rises near resistance traps. Escape clean.
⚠️ High Alert – Police Checkpoint Ahead
👮 Red MA Zone = Barricade.
It’s a hotspot for bearish cops + consolidation traps.
Only strong thieves survive here—book profits before you get cornered.
💼 For Scalpers & Swing Agents
🔍 Scalpers: Only ride long—quick bags, quick exit.
💰 Swingers: Follow the full robbery plan. Patience pays.
🎯 Trailing SL is your body armor—keep it tight.
📊 Fundamental Force Behind the Break-In
🔥 DOT/USDT is flashing bullish momentum supported by:
Sentiment shift
Intermarket alignment
COT positioning
On-chain data
📡 Stay updated via macro reports & sentiment dashboards—intel is profit.
📰 News Alert – Chaos Creates Opportunity
🧨 Avoid fresh entries during high-volatility news drops.
🎯 Trailing SL can save you during headline crossfire.
❗️Disclaimer:
This blueprint is for educational purposes only. Always conduct your own recon and apply strict risk management. Thieves who don’t scout first... get caught.
🚀 Boost the Heist – Support the Crew
💥 Smash that “Boost” if this plan adds value 💥
Your boost fuels more chart crimes, more profit hits, and a growing rob-the-market brotherhood! 💪💼📈
🧨 See you in the next job... Stay hidden, stay funded!
– Thief Trading Style™ HQ 🕶️🐱👤💰🚁

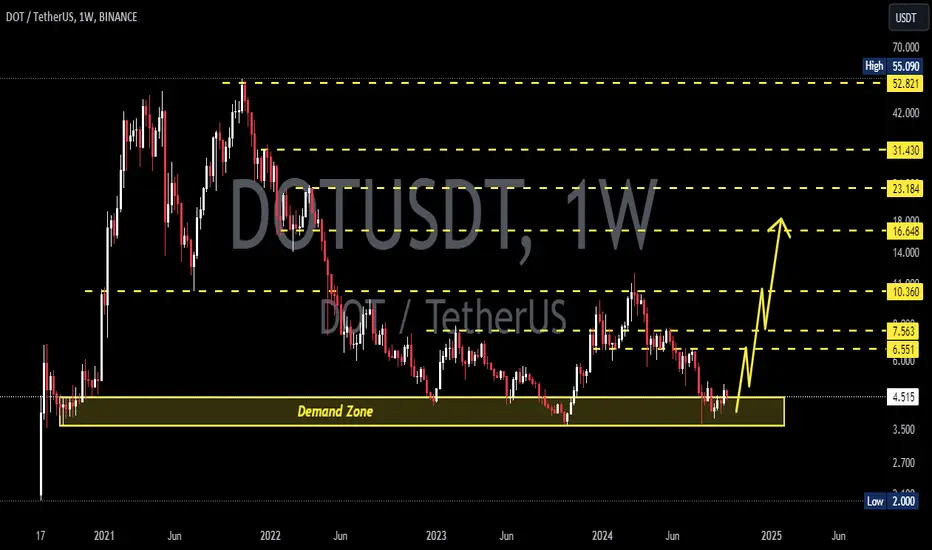
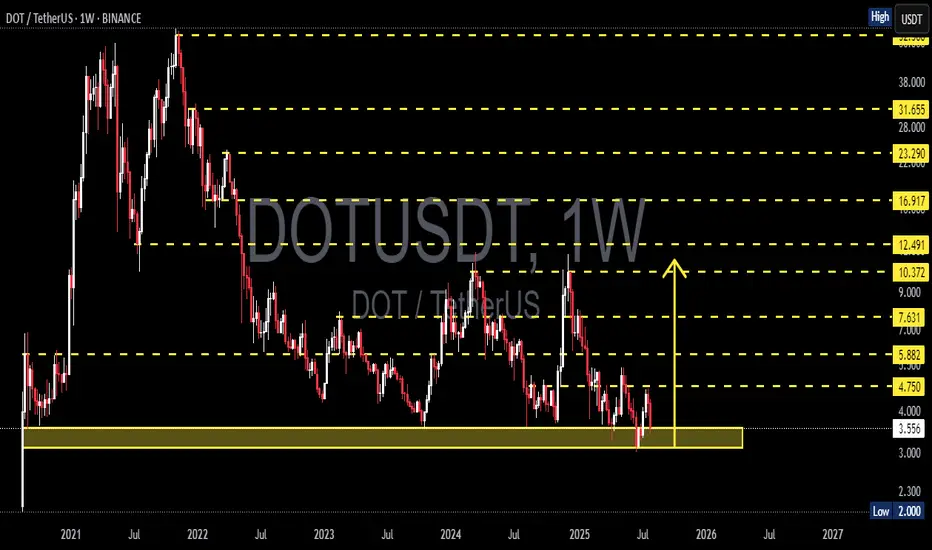
DOTUSDT On the Edge of a Major Rebound or a Devastating BreakdowPolkadot (DOT) is once again retesting one of its strongest macro support zones between $4.00 – $3.55, a historically significant demand area that has provided major price bounces since mid-2022.
This isn’t just a random level—it’s a critical accumulation base where large buyers have consistently shown interest. With price now hovering around this zone again, the next move could be decisive for DOT's mid- to long-term trend.
---
🔍 Price Structure & Key Patterns
Extended Accumulation Phase: DOT has been trading in a sideways range for over 80 weeks, indicating a potential bottoming structure forming after a prolonged downtrend.
Strong Historical Demand: The $4.00 – $3.55 region has acted as a key support multiple times since 2022, reinforcing its importance as a make-or-break zone.
Potential Trap Setup: Current price action could be forming either a bull trap or bear trap, depending on whether price rebounds or breaks down. Weekly candle confirmation will be key.
---
🟢 Bullish Scenario (Upside Reversal)
If price holds and prints a strong bullish candle (e.g., bullish engulfing or long-tailed hammer), expect the following upside targets:
Short-term: $4.75 – $5.88
Mid-term: $7.63 – $9.00
Long-term: $10.37 – $12.49, aligning with prior distribution zones
✅ A breakout from this long accumulation base could trigger a massive short squeeze and renewed buying momentum.
---
🔴 Bearish Scenario (Breakdown)
If DOT closes below $3.55 on the weekly chart:
Confirms breakdown from macro support
Opens downside risk toward $2.30 – $2.00
Would print a new lower low, extending the bear market phase and potentially triggering capitulation
⚠️ Speculative long positions should include tight risk management below $3.50.
---
🧠 Market Sentiment & Strategy
DOT appears to be in a "Capitulation meets Hope" phase—selling pressure is exhausting, but bullish conviction hasn't yet taken control.
Ideal entry zones lie within the current demand range, with tight stops.
Watch for a daily breakout or bullish momentum confirmation next week before committing to positions.
---
📌 Final Takeaway
> DOT is standing at the edge of a cliff—or a launchpad. The $3.55–$4.00 zone has repeatedly been the foundation for rebounds. If history repeats, this may be the beginning of a new uptrend. If not—brace for deeper downside.
⏳ The market is watching. Will DOT break out… or break down?
#DOTUSDT #Polkadot #CryptoTechnicalAnalysis #SupportResistance #CryptoRebound #BearishOrBullish #AltcoinOutlook #CryptoBreakdown #WeeklyChart #AccumulationZone #DOTAnalysis
DOTUSDT 1W AnalysisDOT ~ 1W Analysis
#DOT Buy back gradually from this support block with a short term target of at least 20%+ from this support.

DOTUSDT 1D AnalysisDOT ~ 1D Analysis
#DOT Buy when re -testing this support with a short -term target of at least 10%+ from here.

DOT/USD "Polkadot vs U.S Dollar" Crypto Heist (Scalping / Day)🌟Hi! Hola! Ola! Bonjour! Hallo! Marhaba!🌟
Dear Money Makers & Robbers, 🤑 💰💸✈️
Based on 🔥Thief Trading style technical and fundamental analysis🔥, here is our master plan to heist the DOT/USD "Polkadot vs U.S Dollar" Crypto Market. Please adhere to the strategy I've outlined in the chart, which emphasizes long entry. Our aim is to escape near the high-risk MA Zone. Risky level, overbought market, consolidation, trend reversal, trap at the level where traders and bearish robbers are stronger. 🏆💸"Take profit and treat yourself, traders. You deserve it!💪🏆🎉
Entry 📈 : "The vault is wide open! Swipe the Bullish loot at any price - the heist is on!
however I advise to Place buy limit orders within a 15 or 30 minute timeframe nearest or swing low or high level for pullback entries.
Stop Loss 🛑:
📍 Thief SL placed at the recent/swing low level Using the 4H timeframe (3.450) Scalping/Day trade basis.
📍 SL is based on your risk of the trade, lot size and how many multiple orders you have to take.
🏴☠️Target 🎯: 4.000
💰💵💸DOT/USD "Polkadot vs U.S Dollar" Crypto Market Heist Plan (Day / Scalping Trade) is currently experiencing a bullishness,., driven by several key factors.☝☝☝
📰🗞️Get & Read the Fundamental, Macro, COT Report, On Chain Analysis, Sentimental Outlook, Intermarket Analysis, Future trend targets.. go ahead to check 👉👉👉🔗
⚠️Trading Alert : News Releases and Position Management 📰 🗞️ 🚫🚏
As a reminder, news releases can have a significant impact on market prices and volatility. To minimize potential losses and protect your running positions,
we recommend the following:
Avoid taking new trades during news releases
Use trailing stop-loss orders to protect your running positions and lock in profits
💖Supporting our robbery plan 💥Hit the Boost Button💥 will enable us to effortlessly make and steal money 💰💵. Boost the strength of our robbery team. Every day in this market make money with ease by using the Thief Trading Style.🏆💪🤝❤️🎉🚀
I'll see you soon with another heist plan, so stay tuned 🤑🐱👤🤗🤩

DOT/USD "Polkadot vs U.S Dollar" Crypto Market Heist Plan🌟Hi! Hola! Ola! Bonjour! Hallo! Marhaba!🌟
⚔Dear Money Makers & Thieves, 🤑 💰✈️
Based on 🔥Thief Trading style technical and fundamental analysis🔥, here is our master plan to heist the DOT/USD "Polkadot vs U.S Dollar" Crypto market. Please adhere to the strategy I've outlined in the chart, which emphasizes long entry. Our aim is the high-risk Red Zone. Risky level, overbought market, consolidation, trend reversal, trap at the level where traders and bearish robbers are stronger. 🏆💸Book Profits wealthy and safe trade.💪🏆🎉
Entry 📈 : "The vault is wide open! Swipe the Bullish loot at any price - the heist is on!
however I advise to Place buy limit orders within a 15 or 30 minute timeframe most recent or swing, low or high level. I Highly recommended you to put alert in your chart.
Stop Loss 🛑:
Thief SL placed at the recent/swing low or high level Using the 4H timeframe (3.800) swing trade basis.
SL is based on your risk of the trade, lot size and how many multiple orders you have to take.
Target 🎯:
🏴☠️Target 1 - 4.700 (or) Escape Before the Target
🏴☠️Target 2 - 5.600 (or) Escape Before the Target
🏴☠️Target 3 - 6.600 (or) Escape Before the Target
🧲Scalpers, take note 👀 : only scalp on the Long side. If you have a lot of money, you can go straight away; if not, you can join swing traders and carry out the robbery plan. Use trailing SL to safeguard your money 💰.
DOT/USD "Polkadot vs U.S Dollar" Crypto Market is currently experiencing a bullish trend,., driven by several key factors.
📰🗞️Get & Read the Fundamental, Macro Economics, COT Report, On-Chain Analysis, Sentimental Outlook, Future Trend Move:
Before start the heist plan read it.👉👉👉
📌Keep in mind that these factors can change rapidly, and it's essential to stay up-to-date with market developments and adjust your analysis accordingly.
⚠️Trading Alert : News Releases and Position Management 📰 🗞️ 🚫🚏
As a reminder, news releases can have a significant impact on market prices and volatility. To minimize potential losses and protect your running positions,
we recommend the following:
Avoid taking new trades during news releases
Use trailing stop-loss orders to protect your running positions and lock in profits
💖Supporting our robbery plan 💥Hit the Boost Button💥 will enable us to effortlessly make and steal money 💰💵. Boost the strength of our robbery team. Every day in this market make money with ease by using the Thief Trading Style.🏆💪🤝❤️🎉🚀
I'll see you soon with another heist plan, so stay tuned 🤑🐱👤🤗🤩

DOTUSDT 1WDOT ~ 1W Analysis
#DOT The lowest support that needs to be maintained, or this coin will experience further decline.

#DOT/USDT#DOT
The price is moving in a descending channel on the 1-hour frame and is expected to continue upwards
We have a trend to stabilize above the moving average 100 again
We have a descending trend on the RSI indicator that supports the rise by breaking it upwards
We have a support area at the lower limit of the channel at a price of 4.50
Entry price 4.60
First target 4.72
Second target 4.85
Third target 4.99

DOTUSDT 1WDOT ~ 1W Analysis
#DOT This is the lowest support for now. Buy from here if you still have a Conviction on this coin with a minimum target of 20%+

DOTUSDT 1WDOT Update ~ 1W
#DOT Still maintaining its bullish structure. This is wave 2. buy in stages from here. With a minimum target of 20%++. Wave 3 is the longest wave in the Eliot Wave pattern.
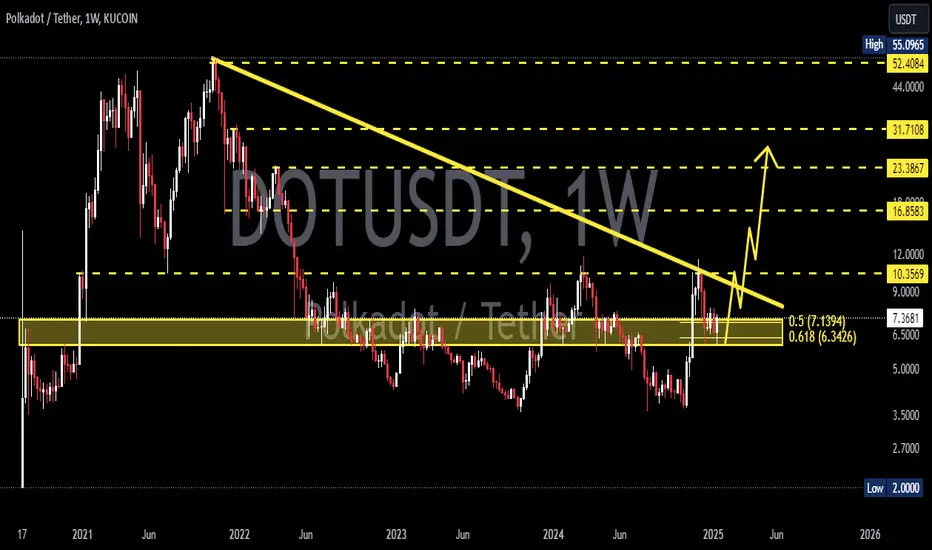
DOT/USDT at Key Support: A Surge on the Horizon?DOT/USDT is currently trading at a crucial level, aligning with the golden Fibonacci 0.618 and a key support zone.
If USDT.D drops from its current levels, we could see a potential surge in DOT, supported by its strong fundamentals.

DOT/USD "Polkadot vs USD" Crypto Market Bullish Heist Plan🌟Hi! Hola! Ola! Bonjour! Hallo!🌟
Dear Money Makers & Robbers, 🤑 💰
Based on 🔥Thief Trading style technical and fundamental analysis🔥, here is our master plan to heist the DOT/USD "Polkadot vs USD" Crypto market. Please adhere to the strategy I've outlined in the chart, which emphasizes long entry. Our aim is the high-risk Red Zone. Risky level, overbought market, consolidation, trend reversal, trap at the level where traders and bearish robbers are stronger. Be wealthy and safe trade.💪🏆🎉
Entry 📈 : You can enter a Bull trade at anypoint,
however I advise placing Buy limit orders within a 15 or 30 minute timeframe. Entry from the most recent or closest low or high level should be in retest.
Stop Loss 🛑: Using the 4H period, the recent / nearest low or high level.
Goal 🎯: 10.500
Scalpers, take note 👀 : only scalp on the Long side. If you have a lot of money, you can go straight away; if not, you can join swing traders and carry out the robbery plan. Use trailing SL to safeguard your money 💰.
Warning⚠️ : Our heist strategy is incompatible with Fundamental Analysis news 📰 🗞️. We'll wreck our plan by smashing the Stop Loss 🚫🚏. Avoid entering the market right after the news release.
Fundamental Outlook 📰🗞️
Considering these factors, the DOT/USD pair may experience a Bullish trend in the short-term, driven by:
Increasing adoption and usage of DOT, driven by its interoperability features and growing ecosystem.
Improving blockchain development and scalability.
Growing developer interest and user adoption.
Bullish Factors:
Increasing adoption and usage of DOT, driven by its interoperability features and growing ecosystem.
Improving blockchain development and scalability.
Growing developer interest and user adoption.
Potential for increased institutional investment and mainstream recognition.
Competitive advantages over other cryptocurrencies, such as faster transaction times and lower fees.
Please note that this is a general analysis and not personalized investment advice. It's essential to consider your own risk tolerance and market analysis before making any investment decisions.
Take advantage of the target and get away 🎯 Swing Traders Please reserve the half amount of money and watch for the next dynamic level or order block breakout. Once it is resolved, we can go on to the next new target in our heist plan.
Keep in mind that these factors can change rapidly, and it's essential to stay up-to-date with market developments and adjust your analysis accordingly.
💖Supporting our robbery plan will enable us to effortlessly make and steal money 💰💵 Tell your friends, Colleagues and family to follow, like, and share. Boost the strength of our robbery team. Every day in this market make money with ease by using the Thief Trading Style.🏆💪🤝❤️🎉🚀
I'll see you soon with another heist plan, so stay tuned 🫂

DOTUSDT 1WDOT Update ~ 1W
#DOT Still maintaining its bullish structure. This is wave 2. buy in stages from here. With a minimum target of 20%++. Wave 3 is the longest wave in the Eliot Wave pattern.

DOT/USDT Analysis: Below the Blue Line StrategyObjective:
I am positioning myself to participate in every opportunity below the blue line, as this marks a critical price threshold for potential buying interest.
Key Details
The Blue Line:
Represents a significant level derived from technical analysis, acting as a pivot for high-probability setups.
This level may correspond to strong historical support or a psychological price barrier.
Strategy Focus:
Below the blue line, I expect price to offer discounted entries, whether through sharp reversals, consolidations, or breakout retests.
My aim is to accumulate positions progressively within this zone.
Market Behavior Below the Line:
Reversals: Price sweeps below the line and rebounds strongly.
Consolidation: Price stabilizes near the blue line, forming a base for a potential upward move.
Breakouts: If price drops further, I will look for deeper value zones before re-evaluating.
Action Plan
Entries:
Initiate long positions incrementally below the blue line based on price reactions (bullish market structure breaks in lower time frames).
Stop Loss:
Place below the next significant support zone to minimize risk. 8.9$, If I stop out I will have another entry at 8.3$
Take Profit:
Target levels at key Fibonacci extensions, resistance areas, or psychological round numbers. 15$ for example.
Note: Risk management and patience are critical. This strategy relies on disciplined execution and monitoring price action closely for confirmation signals.
I keep my charts clean and simple because I believe clarity leads to better decisions.
My approach is built on years of experience and a solid track record. I don’t claim to know it all, but I’m confident in my ability to spot high-probability setups.
My Previous Analysis
🐶 DOGEUSDT.P: Next Move
🎨 RENDERUSDT.P: Opportunity of the Month
💎 ETHUSDT.P: Where to Retrace
🟢 BNBUSDT.P: Potential Surge
📊 BTC Dominance: Reaction Zone
🌊 WAVESUSDT.P: Demand Zone Potential
🟣 UNIUSDT.P: Long-Term Trade
🔵 XRPUSDT.P: Entry Zones
🔗 LINKUSDT.P: Follow The River
📈 BTCUSDT.P: Two Key Demand Zones
🟩 POLUSDT: Bullish Momentum
🌟 PENDLEUSDT: Where Opportunity Meets Precision
🔥 BTCUSDT.P: Liquidation of Highly Leveraged Longs
🌊 SOLUSDT.P: SOL's Dip - Your Opportunity
🐸 1000PEPEUSDT.P: Prime Bounce Zone Unlocked
🚀 ETHUSDT.P: Set to Explode - Don't Miss This Game Changer
🤖 IQUSDT: Smart Plan
⚡️ PONDUSDT: A Trade Not Taken Is Better Than a Losing One
💼 STMXUSDT: 2 Buying Areas

DOTUSDTDOT ~ 1W
#DOT Price reaches the demand zone again., Make purchases gradually with a target of at least 20%+ from here.

Polkadot (DOT) Set for Potential Rebound? Key Price Action Signa👀👉 Despite recent downward pressure, Polkadot (DOT) is showing a bullish break of market structure on the 30-minute timeframe. I’m closely monitoring for a possible buying opportunity, guided by the key criteria discussed in the video. In this analysis, we’ll highlight the critical price action signals to follow and how to strategically position yourself for the next potential move. Disclaimer: This analysis is for informational purposes only and does not constitute financial advice. 📊✅

DOTUSDTDOT ~ 1W
#DOT Price reaches the demand zone again., Make purchases gradually with a target of at least 20%+ from here.

DOTUSD Is it really copying ETC's past Cycle?Polkadot (DOTUSD) appears to be following since its 2021 High (All Time High), ETC's previous Cycle of 2018 - 2021. As you can see on this 1W chart, the RSI sequences in particular between the two fractals are almost identical.
Lower Highs Double Tops leading to the Bear Cycle, then an RSI bottom leading to a price break-out above the 1W MA50 (blue trend-line) and on the 0.5 Fibonacci retracement level (on overbought RSI), finally followed by a new decline (RSI at 40.00), which in ETC's case when broken, led to the Bull Cycle's Parabolic Rally.
Right now it appears that DOT is on the 40.00 RSI Low, so naturally if it is indeed replicating Ethereum Classic's previous Cycle, we should see the price starting to rise aggressively towards the 1.5 Fibonacci extension. If that's the case, we can expect a High around $200 by the end of 2025.
-------------------------------------------------------------------------------
** Please LIKE 👍, FOLLOW ✅, SHARE 🙌 and COMMENT ✍ if you enjoy this idea! Also share your ideas and charts in the comments section below! This is best way to keep it relevant, support us, keep the content here free and allow the idea to reach as many people as possible. **
-------------------------------------------------------------------------------
💸💸💸💸💸💸
👇 👇 👇 👇 👇 👇

DOTUSDTDOT ~ 1W
#DOT Price reaches the demand zone again., Make purchases gradually with a target of at least 20%+ from here.