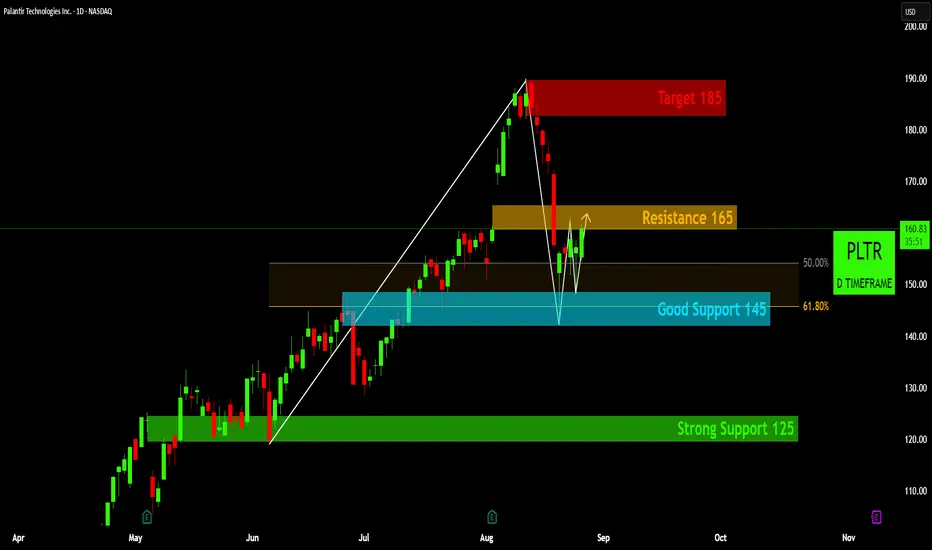
PLTR's W-Pattern: Is 165 the Gateway to 185?
Bullish Reversal Pattern: PLTR has recently formed a clear 'W' shaped bottoming pattern, with its two lows consolidating around the Good Support 145 level (which aligns with the 61.8% Fibonacci retracement). This pattern is generally considered a strong bullish reversal signal after a prior downtrend from the peak near 190.
Key Breakout Level: The critical level to confirm the 'W' pattern breakout and initiate a long position is a decisive break and sustained close above the Resistance 165 zone. This level acts as the neckline of the 'W' pattern, and overcoming it would suggest strong bullish conviction.
Support Confirmation: The repeated bounces off the Good Support 145 level during the 'W' formation indicate its significance as a strong demand zone. This provides a good foundation for the potential upward move, with Strong Support 125 serving as a deeper, more robust safety net if market conditions deteriorate.
Upside Target: Upon a successful breakout above Resistance 165, the chart clearly identifies Target 185 as the next significant upside objective. This level aligns with a previous area of price congestion and could be the initial profit-taking zone for a confirmed move higher.
Disclaimer:
The information provided in this chart is for educational and informational purposes only and should not be considered as investment advice. Trading and investing involve substantial risk and are not suitable for every investor. You should carefully consider your financial situation and consult with a financial advisor before making any investment decisions. The creator of this chart does not guarantee any specific outcome or profit and is not responsible for any losses incurred as a result of using this information. Past performance is not indicative of future results. Use this information at your own risk. This chart has been created for my own improvement in Trading and Investment Analysis. Please do your own analysis before any investments.
Double Top or Bottom
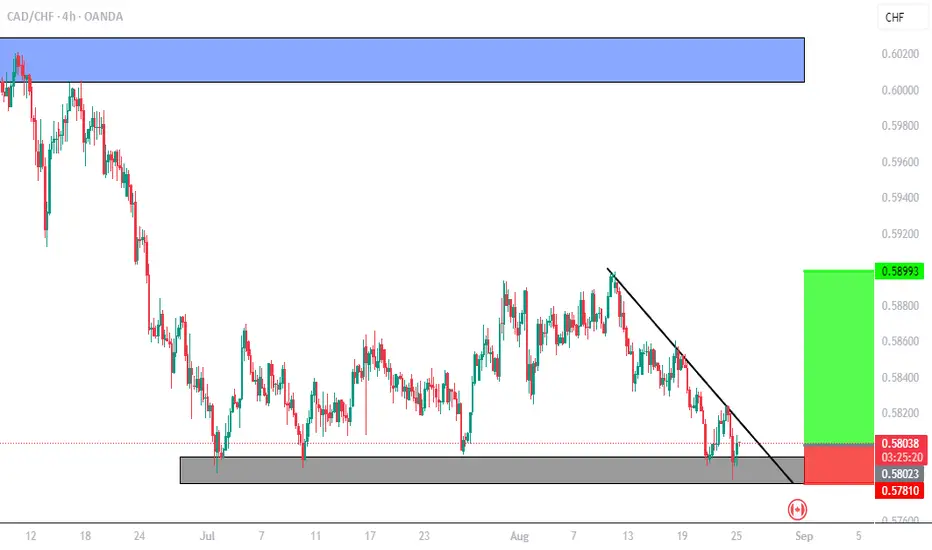
CADCHF: Bearish Price Action Confirmed 🇨🇦🇨🇭
CADCHF is going to drop from an intraday horizontal resistance.
As a confirmation, the price formed a tiny double top pattern
on that and broke its neckline after a London session opening.
With a high chance, the price will drop to 0.5805
❤️Please, support my work with like, thank you!❤️
I am part of Trade Nation's Influencer program and receive a monthly fee for using their TradingView charts in my analysis.

USDCAD: Bullish Move from Support Confirmed📈USDCAD has approached a significant confluence cluster, which is defined by a rising trend line and horizontal support on a 4-hour timeframe
The formation of a double top suggests a high probability of a subsequent retracement.
The target objective is 1.3889.

EURNZD Eyes 1.99 — Technical & Fundamental Bulls AlignedToday, I want to analyze EURNZD ( OANDA:EURNZD ) for you, which is in good shape both technically and fundamentally .
Please stay with me.
EURNZD is moving close to the Support zone(1.88750 NZD-1.7970 NZD) and 100_SMA(Daily) and has managed to form a Double Bottom Pattern .
From the perspective of Elliott Wave theory , EURNZD seems to have completed the main wave 4 , and we should wait for the main wave 5 . The main wave 5 could complete at the Heavy Resistance zone(2.120 NZD-1.9927 NZD) .
-----------------------------------
EURNZD – Fundamental Analysis:
The EURNZD pair currently reflects a divergence between two very different economic outlooks.
Eurozone (EUR):
The European Central Bank (ECB) has recently begun cutting interest rates to support slowing economic activity, especially in the industrial and manufacturing sectors. Despite this dovish shift, inflation remains relatively under control, and the euro has held up well against riskier currencies thanks to global uncertainty and safe-haven flows.
New Zealand (NZD):
New Zealand's economy is under pressure. The latest GDP figures confirmed a weak growth outlook, and signs of a technical recession are mounting. While the Reserve Bank of New Zealand (RBNZ) has maintained a relatively hawkish tone, it faces a dilemma: inflation is sticky, but domestic demand and housing remain fragile. The RBNZ may be forced to soften its stance sooner than expected.
Outlook:
This fundamental backdrop supports a bullish bias for EURNZD. The euro’s relative stability versus the increasingly vulnerable New Zealand dollar makes this pair attractive for long positions — especially if upcoming NZ data disappoints or global risk sentiment weakens further.
-----------------------------------
Based on the above explanation, I expect EURNZD to rise to at least 1.9917 NZD .
Note: Stop Loss(SL): 1.8779 NZD
Please respect each other's ideas and express them politely if you agree or disagree.
Euro/New Zealand Dollar Analyze (EURNZD), Daily time frame.
Be sure to follow the updated ideas.
Do not forget to put a Stop loss for your positions (For every position you want to open).
Please follow your strategy and updates; this is just my Idea, and I will gladly see your ideas in this post.
Please do not forget the ✅' like '✅ button 🙏😊 & Share it with your friends; thanks, and Trade safe.

8/26: Double Top Pattern, Focus on ShortsGood morning, everyone!
Gold rebounded from around 3359 yesterday, but the current pattern shows signs of a double top — suggesting the risk of a larger pullback today.
📌 Support: First watch 3352–3348, then 3343–3337.
📌 Resistance: 3358–3366. If price fails to break above this zone, a second leg lower is likely, with potential tests of the secondary support.
When trading, avoid greed — especially near key support and resistance levels. If your account is under pressure, it’s safer to stay patient and wait for clearer signals before entering, reducing risk and improving success rates.
If you need guidance, feel free to reach out.

BTC/USDT – Monthly Bearish Outlook | Evergrande Risk LoomsBTC/USDT remains vulnerable on the monthly chart, with Fibonacci analysis pointing toward a likely retracement to the 0.618 zone, and this technical setup aligns with broader macro weakness tied to China’s Evergrande crisis. Once the country’s second-largest property developer, Evergrande’s $300B debt default in 2021 triggered global risk-off waves that coincided with Bitcoin’s sharp decline from its highs, showing crypto’s sensitivity to liquidity shocks. Today, as Evergrande moves through liquidation and China’s property sector remains fragile, global investors continue to retreat from risk assets, and crypto—despite its decentralized nature—still behaves like a high-beta market. This combination of tightening liquidity, weak sentiment, and historical parallels reinforces a bearish outlook for BTC in the near term.

Altcoin Pioneers Group TRADING | Bitcoin Daily Analysis Day1BINANCE:BTCUSDT
Altcoin Pioneers Group TRADING ™ | Bitcoin Daily Analysis Day1
👋 Welcome to Altcoin Pioneers Group TRADING ™!
Let’s analyze Bitcoin. Let’s explore the reason behind it and what Bitcoin’s next move might be.
The price appears to follow a descending triangle pattern 🔻, with two notable bottoms (Bottom 1 ⬇️ and Bottom 2 ⬇️) marked on the chart.
The price has declined 📉 from a higher level, forming a resistance line 🚧 (the upper boundary of the triangle) and a support line 🛡️ (the lower boundary) around 114,000 USDT.
A target price 🎯 of approximately 118,000 USDT is indicated, suggesting a potential breakout 🚀 above the resistance.
The current price is around 112,513.38 USDT 💰, with recent fluctuations 📊 showing a slight recovery ⬆️ after hitting Bottom 2.

USDCHF: Bearish After the News 🇺🇸🇨🇭
USDCHF broke and closed below a major horizontal support
last week.
After a retest of a broken structure, the price formed a bearish
imbalance candle with a release of Swiss unemployment data
this morning.
I think that the price will drop lower and reach 0.8004 level soon.
❤️Please, support my work with like, thank you!❤️
I am part of Trade Nation's Influencer program and receive a monthly fee for using their TradingView charts in my analysis.

TOTAL ANALYSIS (4H)After the speech of the currently most hated man in finance, the entire market experienced a strong pump. With this upward move, TOTAL market cap is now signaling a potential trend shift.
The corrective A-B-C wave has already concluded following the formation of a double bottom.
A new impulsive upward wave now appears to be on the horizon.
Key Levels:
The current retracement for Wave 3 should find support around $3.83T.
The main target for Wave 3 is projected near $4.4T.

Double Bottom at Major Support Level.(D1) - Price is in downtrend and hit a major support level which is also the extreme swing low of CADCHF.
(H4) - Price reacted to the level by forming a Double Bottom at the support level which is bullish reversal Pattern.
Entries
1.Aggressive Entry at the Close of the Bullish Candle in H4
2.Trendline Break Entry since we are going against the heavy downtrend wait for trendline to break to confirm trend change from Down to Up.


GBPUSD: Key Resistance may HoldThere is a strong probability of a retracement on 📉GBPUSD pair from the identified intraday resistance level on Monday.
Confirmation of this assessment is derived from the observed double top pattern on the hourly timeframe, coupled with a bearish reaction prior to the market close during the New York session last Friday.
Target objective: 1.3500.

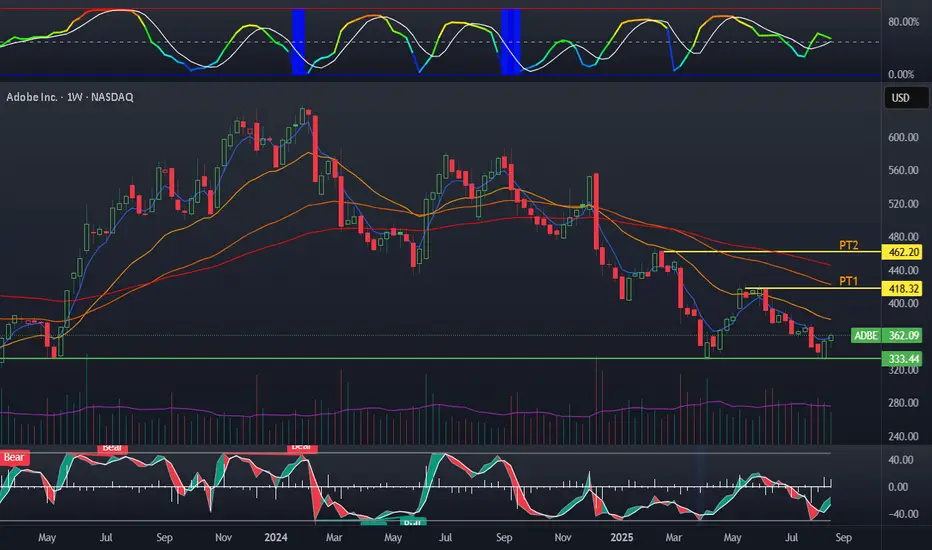
Adobe double bottomAdobe appears to have put in a double bottom. Double or triple bottoms are usually near macro lows. Adobe has solid fundamentals with strong earnings and books. They maintain revenue growth, and are trading at a forward PE of 16 which is laughable. If the company buys back a decent amount of shares they will easily have over 30 EPS in 2030, leading to over a 700$ stock price if the multiple is around 25. The average PE for this stock is in the 50s.
Technically, we note a potentially double bottom, a rise here, with a momentum shift in the stochastic RSI. Volume has been on a slow and steady rise. BBWP is in the middle of the range.
The setup:
Shares, or calls at least 4 months out, seem reasonable here. I have about 40k cash freed up from last week's pump and am debating entering this setup as a lot of the market seems overvalued.
EURUSD Breakdown or Double Bottom? Catalysts at Jackson Hole!EURUSD has broken below the key 1.16 support ahead of the Jackson Hole Symposium, raising the stakes for both bulls and bears as markets become more aware of the likelihood of a hawkish stance.
But will it be the case?
Let's see what the possible scenarios are at play.
Bearish Catalysts :
Hawkish Fed Signals: Recent FOMC minutes and a potential hawkish tone from Chair Powell could push EURUSD lower. Rate cut odds for December have dropped sharply, and further Fed focus on inflation may accelerate downside.
Technical Breakdown: The loss of 1.16 opens the door to 1.1530, 1.1460, and possibly 1.14. No clear bullish divergence on RSI suggests more downside risk.
Geopolitical Risks: Uncertainty around the Ukraine ceasefire could weigh further on the euro.
Bullish Catalysts :
Oversold Conditions: EURUSD is approaching oversold territory, with a potential double bottom forming near 1.1530/1.1460.
Dovish Surprise: If Powell signals concerns over the labour market or hints at a pause, a short-covering rally could target 1.16 and above.
ECB Commentary: Any unexpected hawkishness from ECB President Lagarde could support the euro.
Key Levels to Watch :
Support: 1.1530, 1.1460, 1.1400
Resistance: 1.1600, 1.1660
Trading Plan :
Volatility is likely post-symposium. Bears may look for breakdowns and rallies to resistance for entries, while bulls might watch for reversal signals at key supports if the Fed surprises dovishly.
This content is not directed to residents of the EU or UK. Any opinions, news, research, analyses, prices or other information contained on this website is provided as general market commentary and does not constitute investment advice. ThinkMarkets will not accept liability for any loss or damage including, without limitation, to any loss of profit which may arise directly or indirectly from use of or reliance on such information.

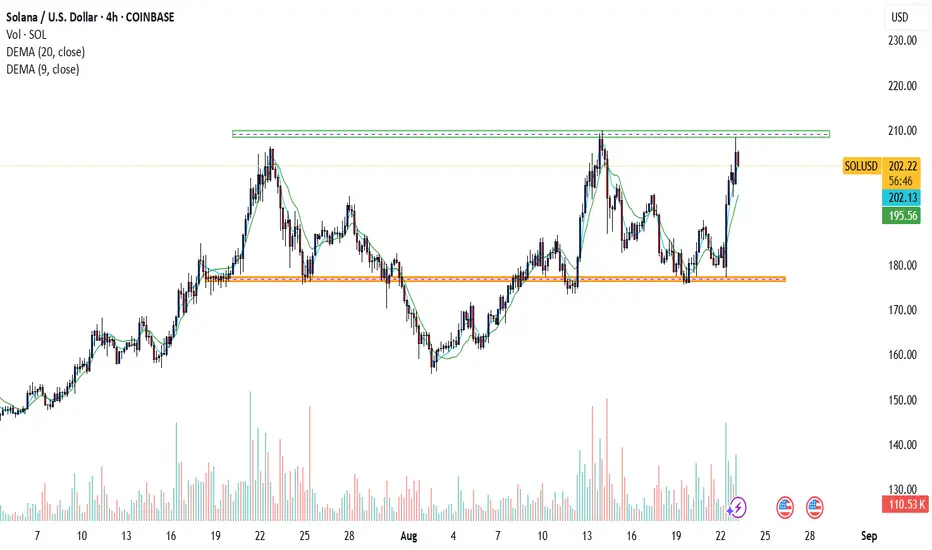
Sol Rangingthis is the key zones to our Solana chart , we are emancipating a three heads touching point , the big move is soon to be seen
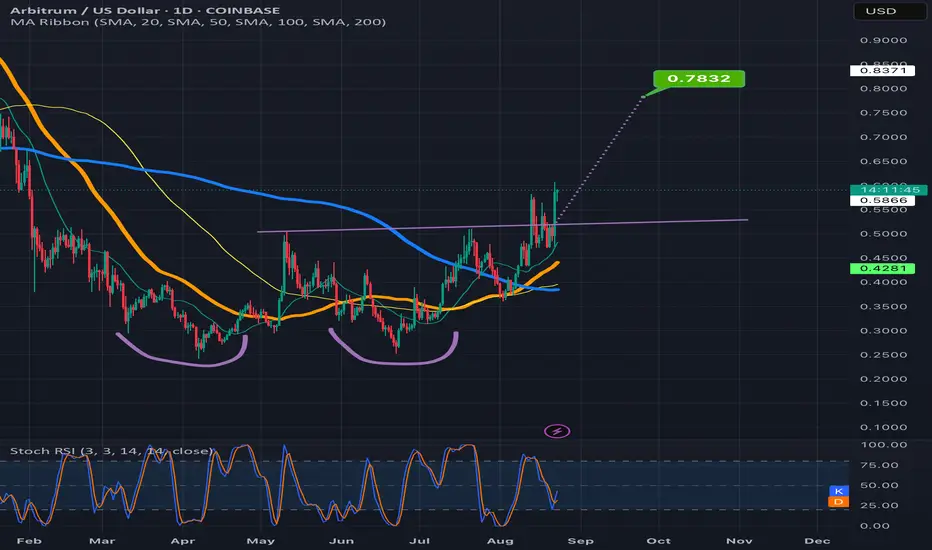
Arbitrum ready for the double bottom breakout?It’s already broken above the neckline recently then dipped back below so another dip back below is certainly possible, however after the recent bullish sentiment from Jackson Hole, I think probability favors the breakout getting confirmed in the very near future. *not financial advice*
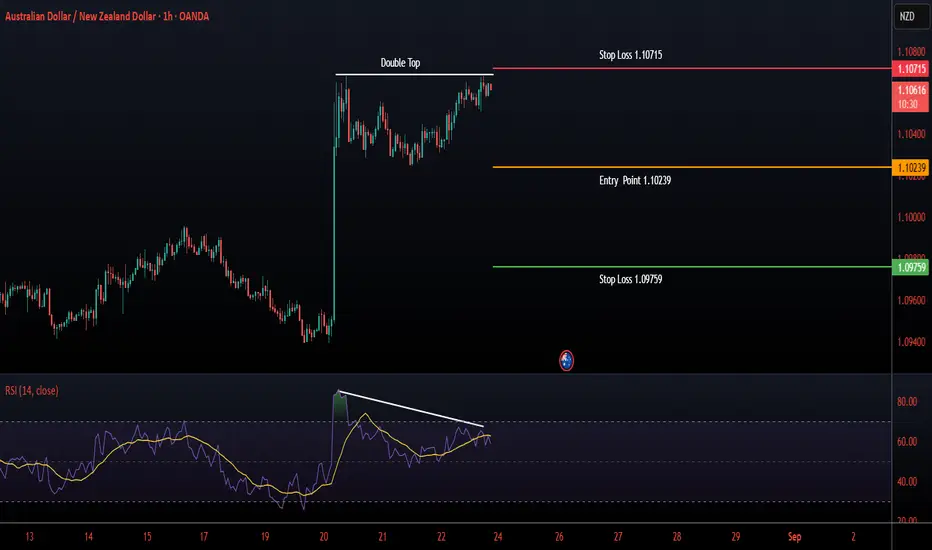
AUDNZDBrarish divergence with Double Top found in 1H time frame, which looks like bearish. Expected Entry point, Stop loss and TP mentioned.
XAUUSD 15m: Bearish Reversal & Short OpportunityGold (XAUUSD): M Pattern & Deciding Line Breach
Bearish Reversal Confirmed: The chart displays a clear bearish reversal pattern, likely a Double Top, where the price failed to make new highs after an initial peak. The subsequent breakdown below the critical "Deciding Line" (which acts as the neckline of this pattern) confirms the shift from bullish to bearish momentum.
Key Support Breakdown : The market has decisively broken below a significant support level, marked as the "Deciding Line." This breach indicates that sellers are now in control, and this former support will likely act as a new resistance level on any pullbacks.
Downtrend Channel & Potential Entry: Following the breakdown, XAUUSD is now trending within a well-defined bearish channel, characterized by descending highs and lows. The current price action suggests a potential short entry, possibly on a retest of the broken "Deciding Line" or the upper boundary of the bearish channel.
Defined Risk-Reward Setup: A short trade setup is indicated with a clearly defined risk-reward profile. The stop-loss is strategically placed above immediate resistance (the red zone around 3332.29), while the target profit area is set at a lower demand zone (the green zone around 3315.49), offering a favorable risk-to-reward ratio should the bearish trend continue.
Disclaimer:
The information provided in this chart is for educational and informational purposes only and should not be considered as investment advice. Trading and investing involve substantial risk and are not suitable for every investor. You should carefully consider your financial situation and consult with a financial advisor before making any investment decisions. The creator of this chart does not guarantee any specific outcome or profit and is not responsible for any losses incurred as a result of using this information. Past performance is not indicative of future results. Use this information at your own risk. This chart has been created for my own improvement in Trading and Investment Analysis. Please do your own analysis before any investments.

USDZAR Outlook - Purely Technical AnalysisThe pair has been ranging on the resistance level that was first tested in early 2020. Considering that price has exited/broke the up trending line this may signal an end of a bullish run on FX_IDC:ZARUSD .

USDCAD - Bullish Triple BottomHello Traders !
The USDCAD price formed a triple bottom pattern.
Currently, The neckline is broken!
So, I expect a bullish move🚀
________________
TARGET: 1.39530🎯

NZDUSD: Bearish Outlook Towards Key SupportWeekly Analysis
NZDUSD Weekly Analysis: Bearish Outlook Towards Key Support
On the weekly timeframe, NZDUSD continues to exhibit a protracted bearish trend, marked by a consistent pattern of lower highs and rejections from descending resistance levels.
Price has recently encountered and shown a strong rejection from the "Current Resistance" zone, confirming the prevailing structural weakness.
We anticipate a continuation of this downtrend, with the pair likely targeting a retest of the critical "Key Support" area around the 0.55000 level in the coming weeks and months.
This multi-year downtrend remains intact, favoring further depreciation of the Kiwi dollar against the USD.
Daily Analysis
NZDUSD Daily: Bearish Breakout Targets Lower Support
NZDUSD on the daily timeframe paints a decidedly bearish picture, currently trading within a well-defined descending channel.
Price has rejected the "Current Resistance" level and, more critically, has now definitively broken below the "Key Support Broken" zone that previously offered horizontal stability.
This breach signifies a shift in market structure, turning former support into new resistance.
We anticipate a potential retest of this broken support level before a continuation of the downtrend towards the "Key Support" zone around 0.55000-0.56000.
Disclaimer:
The information provided in this chart is for educational and informational purposes only and should not be considered as investment advice. Trading and investing involve substantial risk and are not suitable for every investor. You should carefully consider your financial situation and consult with a financial advisor before making any investment decisions. The creator of this chart does not guarantee any specific outcome or profit and is not responsible for any losses incurred as a result of using this information. Past performance is not indicative of future results. Use this information at your own risk. This chart has been created for my own improvement in Trading and Investment Analysis. Please do your own analysis before any investments.

Ready to go downhillHit the ceiling on Weekly and Daily TF.
Double top formation
Channel breakout
Seems to be sliding downward.
