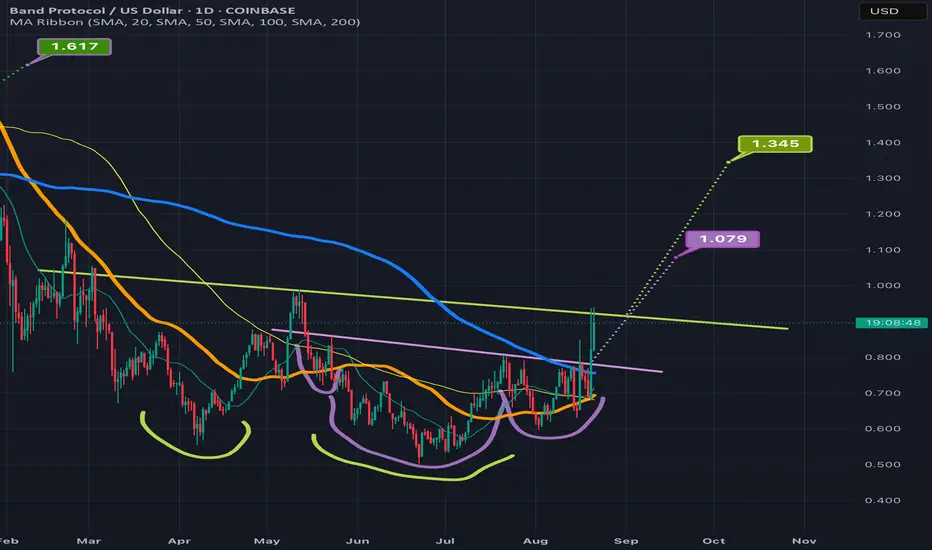
BANDUSD attempting an invh&s + double bottom breakoutBAND has been available for a significant iscount lately but the sale may be ending soon as it is now attempting both an inverse head & shoulders breakout, as well as sending wicks above the neckline of a slightly larger double bottom pattern. The double bottom pattern is in chartreuse and the inverse head and shoulder pattern is in lilac. We can also see BAND looks lke it’s about to have a golden cros in the next week or 2 which should increase probability to confirm the breakout of these two bullish patterns as it will add bullish confluence as long as prce action isn’t two high above the 30&200 moving averages at the time of the golden cross *not financial advice*
Double Top or Bottom
Waiting to go down. Bouncing off Weekly ResistanceFormed double top on 4H.
Hitting weekly resistance multiple times and unable to break that level.
Price is likely to move downward once it breaks a 1H trendline and retests.
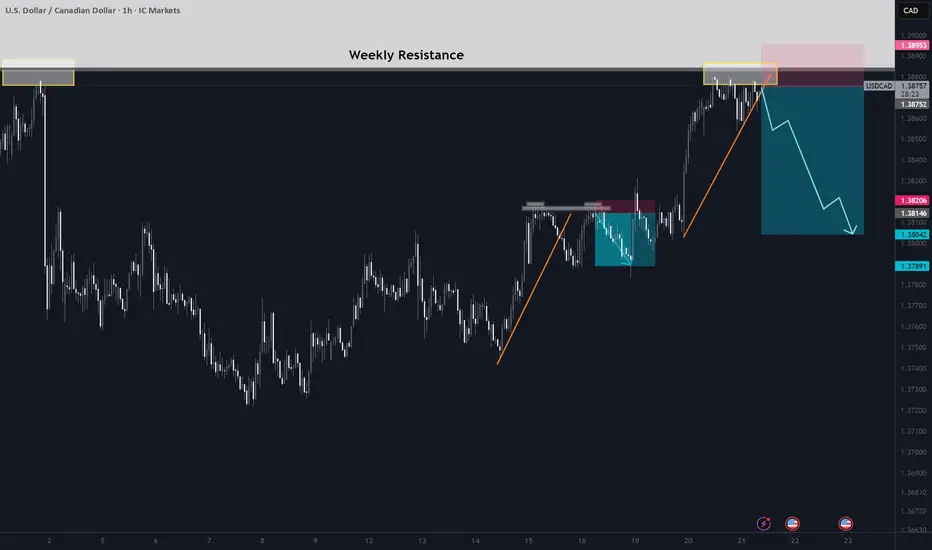
Double Top formed. Price likely to go downPrice has bounced back from two tops. Formed two higher high. And then it started moving downward. The overall trend of Daily shows the break of trendline structure.

SHORT ON GBP/CHFGBP/CHF has a nice double top and has just created a lower high confirming the pattern to complete price reversal to the downside.
Looking to catch 100-200 pips to the next level of demand.

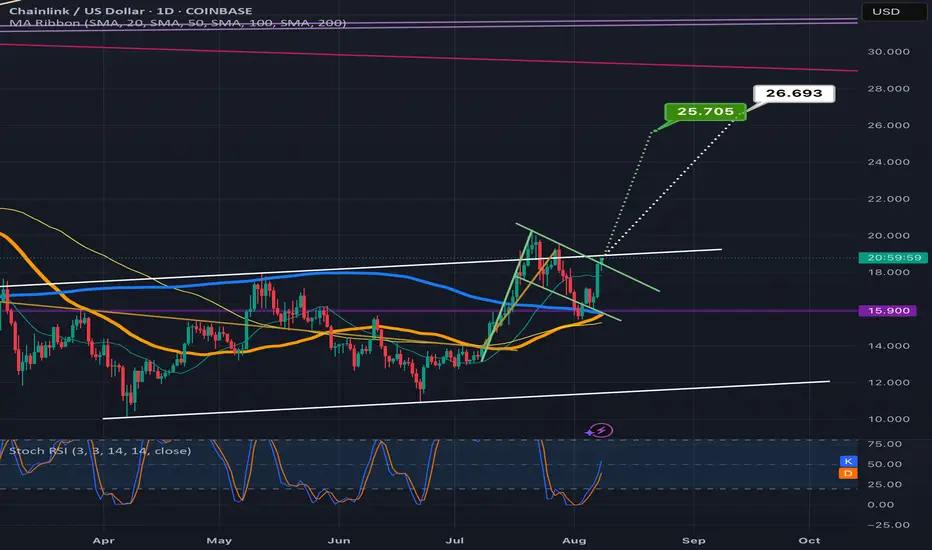
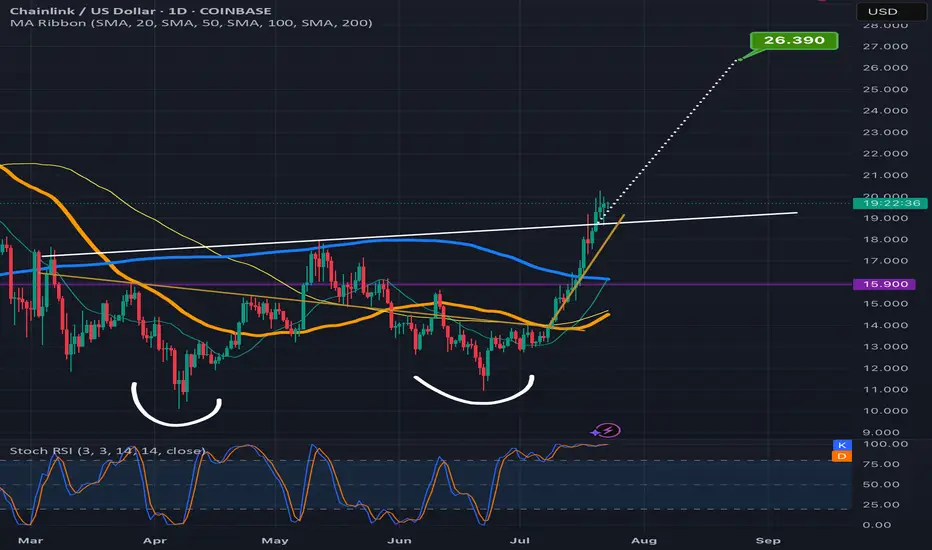
Chainlink looks ready 2 break up from bullflag & a double bottomGreen target is the bullflag white target is the double bottom. *not financial advice*
NZDJPY(LONG)
Key trend line support are
Key Demand Zone
Conflunce agrees to bullish momentum
Pivots area of Support on all time frames

NEAR USDT Double Top Pattern in PlayNEAR USDT Double Top Pattern in Play
On the daily chart, NEAR/USDT has formed a clear double top pattern. Alongside this, a bearish divergence has also developed, suggesting weakness in upward momentum. At the moment, price is sitting near the key support zone around 2.3.
Support at 2.3 and the Bounce Possibility
If NEAR manages to hold this 2.3 support, a bounce could follow toward the 2.85 resistance area. This zone will act as a critical decision point. A rejection here would likely confirm the double top pattern and bring back selling pressure.
Break of 2.3 Could Lead to 1.8 Retest
On the flip side, if the 2.3 support fails, the double top comes into full effect, and NEAR could slide further down to the 1.8 area, where it has found strong support in the past. Until then, the focus remains on whether the current bounce can push through 2.85 or not.

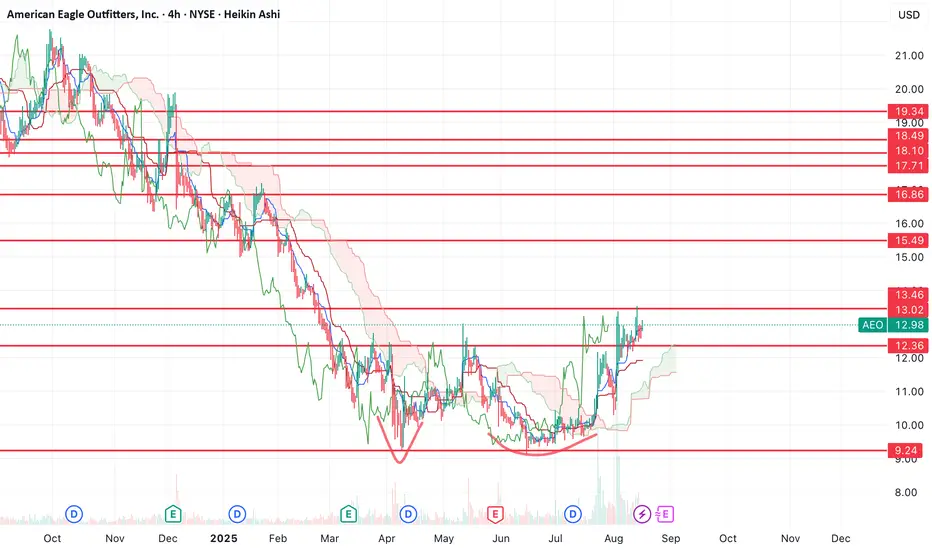
$AEO adam and eve bottom, target $15+American Eagle Outfitters formed an adam and eve bottom chart pattern and has now broken through resistance at $12.33 and retested it as support.
The next level it needs to break to the upside is $13.46.
If it can break above that level, then the next resistance is at the $15.49 level which is also the 50% retracement from the highs. That would make for a great short term target.
However, I've marked off resistance above that just incase the move continues to run.
Let's see how it plays out.
Chainlink climbing the measured move line staircaseLooks like Chanlink is ready to confirm the double bottom breakout here as the past few candles have already started to climb up the measured move line like a staircase.Always possible for a dip back below the neckline at this point but probability slightly favors the readout being validated instead for now. *not financial advice*
Super Trend Strategies: Mastering Breakouts & RetracementsSuper Trend Unleashed: Mastering Breakouts & Retracements
Hey, fellow traders! Ever wished for a straightforward tool to cut through market noise and identify trends with precision? ✨ Meet the Super Trend indicator – a dynamic, trend-following marvel designed to simplify your trading decisions and highlight high-probability entry points. Understanding this indicator can significantly enhance your market analysis.
Understanding the Super Trend: Your Trend Compass 🧭
At its core, the Super Trend isn’t just another line on your chart; it's a powerful derivative of the Average True Range (ATR) and a multiplier factor. 🧠 The ATR measures market volatility, helping the Super Trend dynamically adjust its distance from the price, ensuring it stays relevant across varying market conditions.
The indicator paints a vibrant line directly on your price chart, switching between green (bullish 🟢) and red (bearish 🔴) to signal the prevailing trend direction.
Interpreting the Signals – The Color Code:
Green Line (Below Price): When the Super Trend line turns green and positions itself below the price candles, it signals an established uptrend. This often suggests a favorable environment for long positions, acting as a dynamic support level. 📈
Red Line (Above Price): Conversely, when the line shifts to red and appears above the price candles, it indicates a downtrend is in play. This typically implies caution for longs or potential shorting opportunities, serving as dynamic resistance. 📉
The Flip 🔄: The real magic happens when the color flips! A change from red to green often serves as a potential buy signal, while a green to red flip can indicate a sell signal.
Mastering Super Trend Strategies: Insights from the BTCUSDT Daily Chart
Let's dissect the BTCUSDT Daily chart to understand Four powerful strategies utilizing the Super Trend indicator:
Strategy 1: The Breakout Blast-Off 🚀
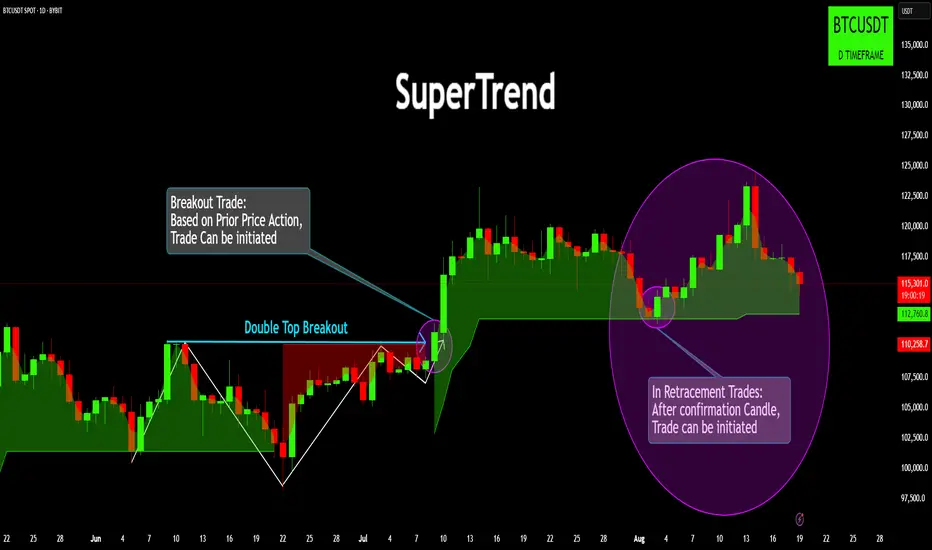
Our BTCUSDT Daily chart beautifully illustrates a classic Super Trend application: The Breakout Trade. Observe the initial period where price consolidated below a clear resistance level, marked as the "Breakout" line. 🚧 This horizontal line represented a significant ceiling that price struggled to surmount.
A powerful surge saw BTC breaking decisively above this resistance. Crucially, at the exact moment of this breakout, the Super Trend line simultaneously flipped from red to a vibrant green and moved to position itself below the price. 🟣 This confluence of strong price action (a clean breakout) and the Super Trend signal (a bullish flip) provides robust confirmation for a long entry. Initiating a trade at this point capitalizes on the momentum generated by the breakout and the confirmed initiation of a new upward trend. It's an aggressive yet calculated entry, based on prior price action providing the foundation.
Same way there was a shorting opportunity using this Breakout Strategy as shown in the chart.
Strategy 2: The Retracement Rebound 🎯
Even after a significant upward move, markets rarely ascend in a straight line. They often retrace or pull back to 'refuel' before continuing their journey. The Super Trend indicator is exceptional at identifying these high-probability pullback opportunities, offering a more conservative entry point. 🌊
Observe how, after the initial breakout and subsequent rally, the BTCUSDT price pulls back towards the active green Super Trend line. This line effectively acts as dynamic support during an uptrend. The key here is patience and confirmation: wait for a confirmation candle (like the strong green candle highlighted within the second purple circle 🟣) that clearly closes above the Super Trend or shows strong rejection from it. This 'bounce' off the Super Trend, coupled with the indicator remaining green (signaling the underlying uptrend is still intact), provides an ideal opportunity to initiate or add to a long position, riding the continuation of the prevailing trend. This strategy minimizes risk by waiting for the market to prove its intent to continue upwards from a key support level.
Strategy 3 Confluence Power: How Price Action & Super Trend Confirm Uptrends! 🤝
Let's turn our attention to the BTCUSDT Daily chart to dissect a powerful entry strategy where price action and the Super Trend align perfectly.
1.Initial Downtrend/Consolidation: Observe the left side of the chart. Initially, the Super Trend is red 🔴, indicating a bearish phase or period of consolidation. Price action might be characterized by lower lows or range-bound movement.
2.The First Hint of a Shift (L to HL): The market begins to show signs of life. After establishing a clear 'L' (Low), the price then forms a 'HL' (Higher Low). This is a crucial early signal from price action – buyers are now defending a higher level than before.
3.The Super Trend Flip: Simultaneously, or very shortly after the price establishes this first Higher Low, the Super Trend indicator performs its critical flip, transitioning from red to vibrant green 🟢. This tells us that the underlying trend, as calculated by the indicator, is potentially shifting.
4.The Confluence Point: Price Action + Super Trend Green Entry! 🚀
The sweet spot, highlighted by the yellow box and arrow labeled "Price action + SuperTrend Green" 🌟, occurs precisely when the price breaks above the previous swing high to establish a new Higher High (HH), and the Super Trend is firmly established as green 🟢.
Why is this a high-conviction entry? It's not just an indicator giving a buy signal; it's the market structure itself confirming a shift in momentum. The sequence of HHs and HLs unequivocally demonstrates that buyers are in control and are pushing prices higher. The green Super Trend acts as a powerful validating filter, confirming the strength and sustainability of this newfound bullish trend. 🤝
The Power of Validation: Initiating a trade at this point capitalizes on a dual confirmation: the market is telling you it's going up through its price structure, and the Super Trend is validating this intent by aligning its trend signal. This significantly reduces the likelihood of false breakouts or whipsaws.
Riding the Trend: Post-Entry Confirmation ✅
Following this confirmed entry, we observe a sustained upward movement in BTCUSDT. The Super Trend line continues to trail below the price, maintaining its green hue 🟢. This serves as a dynamic support level, and as long as the price remains above it, the uptrend is considered intact.
Strategy 4: 4. The Art of Omission: Recognizing False Signals with Super Trend & Price Action. 🛑
In trading, knowing when not to trade is often as crucial as knowing when to enter. While indicators like the Super Trend are invaluable for identifying trends, a common pitfall is to blindly follow every signal. Today, we delve into a critical lesson: how discerning price action can help you avoid "green light, no go" scenarios, saving you from frustrating whipsaws and preserving your precious capital. 💰
1. Super Trend Turns Green: Around mid-May, the Super Trend flipped confidently to green 🟢, typically signaling a long entry. Price did rally initially.
2. Critical Price Action Test: Horizontal Resistance 🚧
As price rose, it hit a significant horizontal resistance around 72,000. Price rallied to this resistance, pulled back, and then tried again, but failed to make a decisive breakout above the previous peak. This formed a double top pattern or a clear ranging environment beneath the resistance.
3. The Disconnect: Green Super Trend vs. Unconfirmed Price Action ⚠️
Crucially, throughout this period, the Super Trend remained green 🟢. However, price action showed a clear lack of conviction to break out and establish new Higher Highs. The market was "chopping" or ranging, not trending.
4. The Verdict: "This Trade Can Be Avoided." 🛑
Despite the green Super Trend, the absence of a clear breakout or sustained bullish price action meant this trade should be avoided. Entering a long position here would be buying into resistance in a non-trending market, often leading to:
o Whipsaws: Repeated stop-loss hits.
o False Breakouts: Brief moves that quickly reverse.
o Trend Reversals: As seen, the lack of conviction eventually led to a downtrend, flipping the Super Trend back to red.
The Power of Confluence 🧘♀️
This example highlights why confluence is vital. Super Trend gives directional hints, but price action provides the ultimate confirmation (or denial) of that trend's strength.
Same for Shorting as well, use power of confluence:
Setting Up Your Super Trend on TradingView: A Quick Guide 🛠️
in.tradingview.com
Adding the Super Trend to your TradingView chart is simple:
1.Click on the 'Indicators' button at the top of your chart. 🔍
2.In the search bar, type 'Super Trend'. ⌨️
3.Select the official 'SuperTrend' by ‘Tradingview’ ✨
4.The indicator will appear on your chart, typically with default settings (Factor: 3, Period: 10).
Customizing for Peak Performance ⚙️
While the default settings are a great starting point, the beauty of Super Trend lies in its adaptability. You can adjust its sensitivity to better suit your trading style and the asset's volatility:
Factor (Multiplier): This adjusts how far the Super Trend line is from the price. A lower factor (e.g., 2) makes it more sensitive, resulting in more frequent flips and potentially earlier signals but also more false signals (whipsaws). A higher factor (e.g., 4 or 5) makes it smoother and less sensitive, leading to fewer signals but potentially confirming trends later.
Period (ATR Length): This determines the number of periods used for the Average True Range calculation. A longer period (e.g., 14 or 20) considers more data, resulting in a smoother ATR and less frequent signals. A shorter period (e.g., 7) makes it more responsive to recent price action.
Experiment to find what complements your trading style and the specific market conditions! 🧪
Important Considerations & Pro-Tips for Success ✅
Not a Standalone Indicator: Super Trend excels when used in conjunction with other analytical tools. Combine it with traditional support/resistance zones, volume analysis, candlestick patterns, or other indicators like RSI or MACD for higher probability trades. 🤝
Volatility Matters: In highly volatile markets, the Super Trend might produce more whipsaws. Be mindful of the market conditions and consider adjusting the settings or confirming with other indicators. 🌪️
Dynamic Stop-Loss Placement: The Super Trend line itself can often serve as an excellent dynamic stop-loss. If the price closes on the opposite side of the line after your entry, it could signal a trend reversal and a good point to exit. 🛑
Multi-Timeframe Analysis: Always check the Super Trend on higher timeframes (e.g., Weekly or Daily if trading H4) to confirm the overarching trend before taking trades on lower timeframes. This ensures you're trading in harmony with the dominant market direction. ⏱️
Conclusion: Your Ally in Trend Trading 💰📈
The Super Trend is an indispensable tool for traders looking to identify and ride market trends effectively. Whether you're catching explosive breakouts or entering patiently on retracements, its clear visual signals can provide invaluable clarity. Master its nuances, combine it with sound risk management, and you'll have a powerful ally in your trading arsenal! Happy trading!
I truly believe this easy Super Trend strategy tutorial can be a game-changer for many traders seeking clarity 💡 and profitability 💰. If you've found value in these insights, please hit the Like button on this idea 👍 and boost its visibility by sharing it with your fellow traders 🚀 (or even leaving a supportive comment! 💬). Your engagement ensures this accessible knowledge reaches and empowers more of our community 🤝. Let's build a stronger 💪, smarter 🧠 trading community together!
Disclaimer:
The information provided in this chart is for educational and informational purposes only and should not be considered as investment advice. Trading and investing involve substantial risk and are not suitable for every investor. You should carefully consider your financial situation and consult with a financial advisor before making any investment decisions. The creator of this chart does not guarantee any specific outcome or profit and is not responsible for any losses incurred as a result of using this information. Past performance is not indicative of future results. Use this information at your own risk. This chart has been created for my own improvement in Trading and Investment Analysis. Please do your own analysis before any investments.
500$ +40% DB RALLYA close above 372$ area to look for the move up on the weekly, likely catalyst earnings coming up on 9/11 analysts project revenue around $5.35 billion up 12% YoY and non-GAAP EPS of ~$4.50-$4.60 driven by Creative Cloud and Firefly AI adoption. Chart looks amazing to back it up, software is not dead and they're implementing a lot of AI to further their growth not to be put out of business by it. Daily has some trend resistance around 360 and 50 100 MA above that the neckline for double bottom at last local top of 420 will also need to be smashed, pretty much in the clear after that besides a back test, this will take a while to play out but there's a decent shot with all these software companies bottoming at the same time. NYSE:CRM NYSE:NOW NYSE:HUBS
ADBE has also bought back a record 12B in stock this year while it looks like there's a mix of hedge funds open/closing q1. Profitable, growing and lowest valuation in a decade, Firefly might be 29.99/ month but it's safe and makes money compared to some of its free competition, the earnings hopefully show a LARGE increase over expected for subscriptions or a major acquisition.

QQQ: Riding the Growth Wave – Key Demand Zones!QQQ: Riding the Growth Wave – Key Demand Zones! 🌊
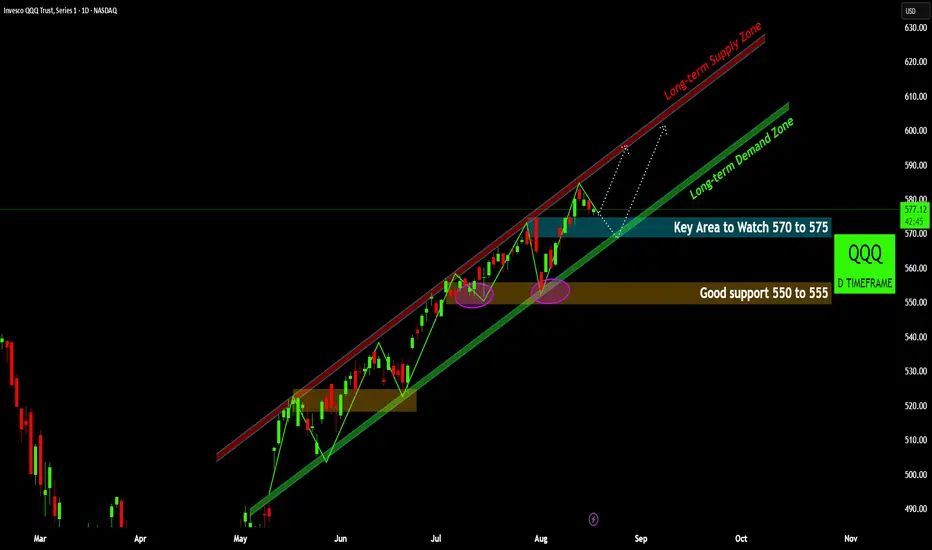
QQQ continues its impressive ascent, firmly entrenched within a well-defined long-term bullish channel. The daily timeframe reveals critical demand zones currently in play, shaping the index's immediate future.
Persistent Bullish Channel: QQQ has maintained a robust uptrend within a clear long-term demand zone (green trendline) and is approaching the long-term supply zone (red trendline) 📊. This structure signifies consistent buyer interest and upward momentum.
Immediate Support in Focus: The 570-575 area 💙 represents a crucial immediate support zone. This level aligns directly with the lower boundary of the long-term demand channel, making it a pivotal area for buyers to defend and sustain the current uptrend.
Stronger Foundational Support: Should the immediate support yield, a more significant "good support" lies within the 550-555 range 🟠. This zone has historically proven resilient, acting as a strong floor for previous pullbacks and providing a robust buying opportunity.
Path to Supply Zone: A successful rebound from the current demand zone, particularly if the
570-575 level holds strong, would likely propel QQQ back towards its long-term supply zone 🔴. This upper channel boundary would represent the next major resistance target.
Outlook: The overall bullish trend remains intact as long as QQQ respects its long-term demand channel. Vigilance at the 570-575 level is key. A decisive break below this, however, could see the index testing the stronger 550-555 support ⚠️.
Disclaimer:
The information provided in this chart is for educational and informational purposes only and should not be considered as investment advice. Trading and investing involve substantial risk and are not suitable for every investor. You should carefully consider your financial situation and consult with a financial advisor before making any investment decisions. The creator of this chart does not guarantee any specific outcome or profit and is not responsible for any losses incurred as a result of using this information. Past performance is not indicative of future results. Use this information at your own risk. This chart has been created for my own improvement in Trading and Investment Analysis. Please do your own analysis before any investments.
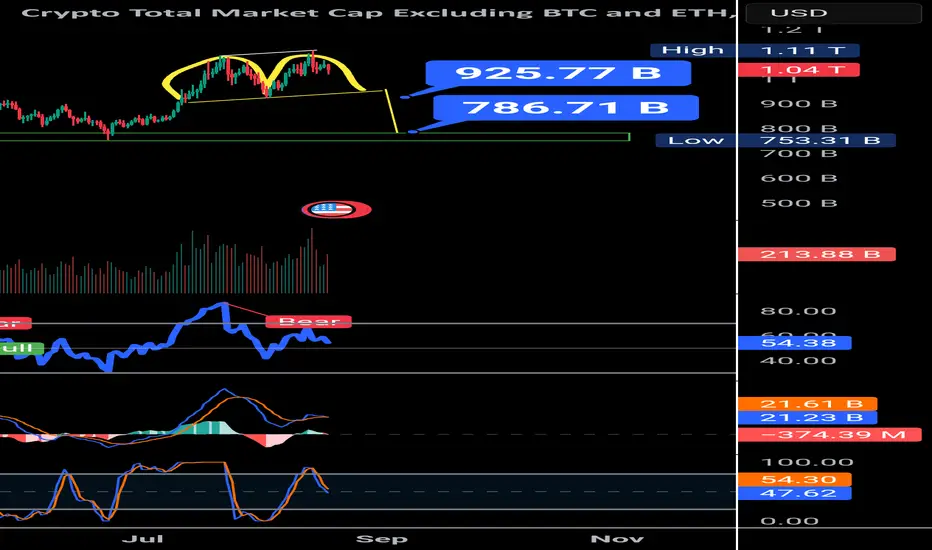
TOTAL3 double top with bearish divergenceThe TOTAL3 (altcoin market cap excluding BTC & ETH) has now climbed back to the $1T zone, almost testing its previous highs. But if we look closer, the chart is flashing a clear bearish divergence alongside a double top (M-pattern) structure.
Here’s the key takeaway:
If the pattern plays out, 950B support becomes the crucial line to watch.
A bounce at 950B could just be a healthy correction from the bearish divergence.
But if 950B breaks, the next strong support sits near 786B.
That zone could open doors for fresh altcoin accumulation opportunities. On the other hand, for those already holding, this level can also be considered a final profit-taking area before a deeper correction sets in.
Overall, the chart suggests the altcoin market is due for correction, especially with Bitcoin dominance on the rise. Patience and risk management are key here.
Disney: Faltering Below Double Top?Walt Disney rallied more than 50 percent between April and June, but some traders may see a potential reversal in the media company.
The first pattern on today’s chart is the March 2024 high around $124. DIS tested that level in late June before reversing. That may be viewed as a double-top.
Second, DIS fell on August 6 after earnings beat estimates. The stock rebounded but stalled at a weekly closing price of $116.59 from August 1. Has new resistance emerged?
Third, MACD is falling. The 8-day exponential moving average (EMA) is also below the 21-day EMA. Those signals are potentially consistent with short-term bearishness.
Next, prices have crossed below the 50-day simple moving average. That may suggest the intermediate-term trend is no longer bullish.
Finally, DIS is an active underlier in the options market. (Its average volume of 85,000 contracts per session ranks about 30th in the S&P 500, according to TradeStation data.) That could help investors position for moves with calls and puts.
TradeStation has, for decades, advanced the trading industry, providing access to stocks, options and futures. If you're born to trade, we could be for you. See our Overview for more.
Past performance, whether actual or indicated by historical tests of strategies, is no guarantee of future performance or success. There is a possibility that you may sustain a loss equal to or greater than your entire investment regardless of which asset class you trade (equities, options or futures); therefore, you should not invest or risk money that you cannot afford to lose. Online trading is not suitable for all investors. View the document titled Characteristics and Risks of Standardized Options at www.TradeStation.com . Before trading any asset class, customers must read the relevant risk disclosure statements on www.TradeStation.com . System access and trade placement and execution may be delayed or fail due to market volatility and volume, quote delays, system and software errors, Internet traffic, outages and other factors.
Securities and futures trading is offered to self-directed customers by TradeStation Securities, Inc., a broker-dealer registered with the Securities and Exchange Commission and a futures commission merchant licensed with the Commodity Futures Trading Commission). TradeStation Securities is a member of the Financial Industry Regulatory Authority, the National Futures Association, and a number of exchanges.
Options trading is not suitable for all investors. Your TradeStation Securities’ account application to trade options will be considered and approved or disapproved based on all relevant factors, including your trading experience. See www.TradeStation.com . Visit www.TradeStation.com for full details on the costs and fees associated with options.
Margin trading involves risks, and it is important that you fully understand those risks before trading on margin. The Margin Disclosure Statement outlines many of those risks, including that you can lose more funds than you deposit in your margin account; your brokerage firm can force the sale of securities in your account; your brokerage firm can sell your securities without contacting you; and you are not entitled to an extension of time on a margin call. Review the Margin Disclosure Statement at www.TradeStation.com .
TradeStation Securities, Inc. and TradeStation Technologies, Inc. are each wholly owned subsidiaries of TradeStation Group, Inc., both operating, and providing products and services, under the TradeStation brand and trademark. When applying for, or purchasing, accounts, subscriptions, products and services, it is important that you know which company you will be dealing with. Visit www.TradeStation.com for further important information explaining what this means.

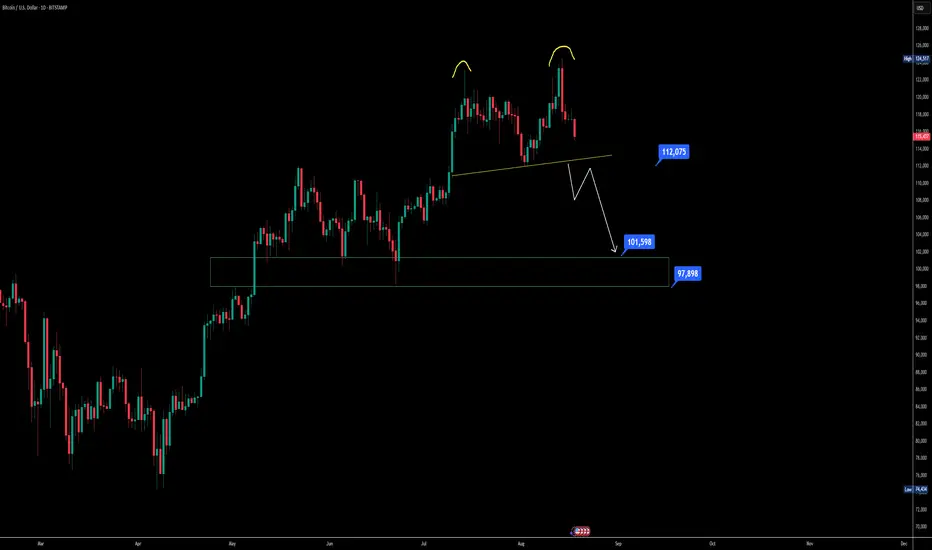
Bitcoin double top hints at deeper correction aheadIf we take a close look at Bitcoin on the daily timeframe, it’s shaping up into a clear double top pattern. Alongside this, there’s a strong bearish divergence that’s hard to ignore. The key level right now is around $112,000—if BTC loses that support, the double top comes into play, and the market could see a sharper correction.
The immediate downside target would be around the $100,000–$101,500 zone, where buyers may attempt to step in. Below that, the stronger support sits near $98,000, and this level could decide whether BTC simply pulls back or actually transitions into a broader bearish cycle. If $98K gives way, we’re not just talking about a correction anymore—we could be looking at the start of a recession-like market cycle.
On the flip side, if BTC manages to hold $112K and bounce, we may see higher levels tested again before any larger trend shift. So right now, the market is in a decision zone where the next few moves are crucial.
10Y Futures Case Study: Trading the Breakout with Defined Risk1. Introduction
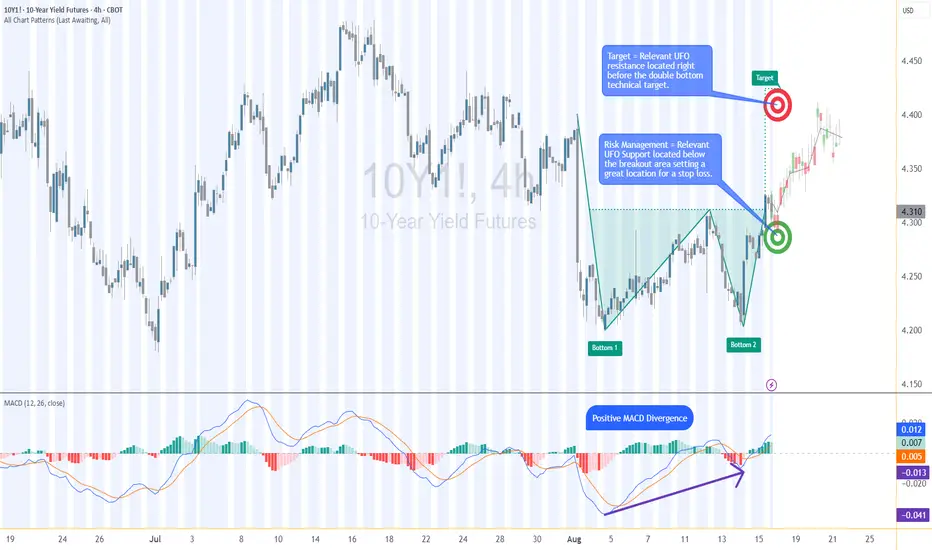
The 10-Year Yield Futures market has recently drawn attention as it builds a constructive base and attempts to shift momentum higher. After weeks of choppy movement, price action on the 4-hour chart has resolved into a breakout scenario that could define the next leg for yields. At the heart of this case study is a double bottom formation, a classical reversal structure, confirmed at 4.321. What makes this setup more compelling is the presence of nearby support and resistance zones, providing a precise technical framework to define entries, targets, and stop placement with discipline.
2. Double Bottom Pattern
The double bottom is one of the most reliable chart patterns signaling the potential exhaustion of selling pressure. It typically forms after a downtrend, with two consecutive troughs creating a strong support base before buyers regain control. In the current 10-Year Yield Futures chart, the first bottom occurred near 4.20, followed by a retest close to the same level. The neckline breakout emerged at 4.312, marking the confirmation point. Applying classical pattern analysis, the measured move points toward a target near 4.396. This alignment of structure and projection provides traders with a clear and objective technical roadmap.
3. MACD Confirmation
Momentum indicators often add depth to price action analysis, and the MACD (Moving Average Convergence Divergence) is one of the most widely followed. Built from the relationship of short- and long-term moving averages, it helps reveal underlying shifts in strength. In the current 10-Year Yield Futures chart, the MACD displayed a positive divergence: while price carved lower lows during the second bottom, the MACD lines began to slope higher. This divergence often signals weakening bearish momentum and the early stages of accumulation. In this case, it reinforces the validity of the double bottom breakout and its bullish potential.
4. UFO Support & Resistance
UnFilled Orders, or UFOs, represent areas where pending buy or sell orders may remain active, providing powerful zones of support or resistance. On the 10-Year Yield Futures chart, a key UFO support sits just below the breakout at 4.278, making it a logical stop-loss placement to protect the trade. Meanwhile, the upside target of the double bottom at 4.396 coincides with a UFO resistance zone. This overlap creates a clear exit area where supply may re-emerge. By combining classical charting techniques with order-flow–based zones, traders gain a structured plan that balances opportunity with risk control.
5. Trade Idea (Illustrative Case Study)
In this case study, the trade idea develops around the breakout point of 4.312 with the current price at the time of writing this article of 4.321. A trader could consider going long if the market sustains above this neckline level. The projected target is the resistance zone at 4.396, while the protective stop loss can be placed just below the UFO support at 4.278. This creates a defined risk profile with a reward-to-risk ratio of roughly 2:1. Alternatively, more conservative traders might consider a wider stop beneath the second bottom, offering more tolerance against volatility but at the expense of risk-reward efficiency. Both options maintain risk clarity and structure.
6. Contract Specifications & Margin Overview
The 10-Year Yield Futures (ticker: 10Y or 10Y1! on TradingView) is a cash-settled futures contract that tracks the 10-year U.S. Treasury yield directly. The gain or loss per tick per contract is as follows: 1 tick = 0.001 Index points (1/10th basis point per annum) = $1.00.
According to CME’s margin schedule (which changes as market conditions change through time), the current margin requirement is approximately $300 per contract. These relatively modest requirements make the product accessible while still providing meaningful exposure to U.S. interest rate markets.
7. Importance of Risk Management
Even with technically strong setups, the defining factor between consistent traders and inconsistent ones is risk management. Futures are leveraged products, meaning a small price move can translate into significant profit or loss. Using stop-loss orders helps enforce discipline, ensuring that one trade does not spiral into uncontrolled exposure. In this case, the support at 4.278 provides a logical technical area for a stop. Regardless of market outlook, avoiding undefined risk is key to long-term survival and consistency.
8. Closing Remarks
The alignment of a double bottom breakout, positive MACD divergence, and key support and resistance zones creates a textbook technical case study in the 10-Year Yield Futures market. With a clearly defined entry, target, and stop-loss, this setup demonstrates how combining price patterns with momentum and order-flow levels can help build structured trade plans. Yet, no analysis guarantees outcomes, and discipline remains at the core of every approach.
When charting futures, the data provided could be delayed. Traders working with the ticker symbols discussed in this idea may prefer to use CME Group real-time data plan on TradingView: www.tradingview.com - This consideration is particularly important for shorter-term traders, whereas it may be less critical for those focused on longer-term trading strategies.
General Disclaimer:
The trade ideas presented herein are solely for illustrative purposes forming a part of a case study intended to demonstrate key principles in risk management within the context of the specific market scenarios discussed. These ideas are not to be interpreted as investment recommendations or financial advice. They do not endorse or promote any specific trading strategies, financial products, or services. The information provided is based on data believed to be reliable; however, its accuracy or completeness cannot be guaranteed. Trading in financial markets involves risks, including the potential loss of principal. Each individual should conduct their own research and consult with professional financial advisors before making any investment decisions. The author or publisher of this content bears no responsibility for any actions taken based on the information provided or for any resultant financial or other losses.
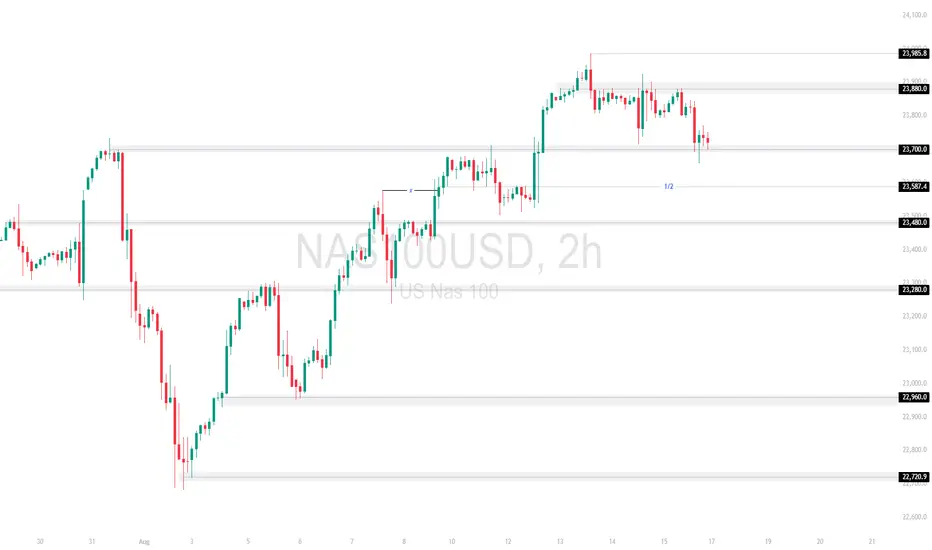
NAS100 – Key Support RetestPrice has pulled back from 23,985.8 resistance and is now testing the 23,700.0 zone. A solid hold here could fuel another leg higher, but a break lower may expose 23,587.4 and 23,480.0.
Support at: 23,700.0 🔽 | 23,587.4 🔽 | 23,480.0 🔽 | 23,280.0 🔽 | 22,960.0 🔽
Resistance at: 23,880.0 🔼 | 23,985.8 🔼
🔎 Bias:
🔼 Bullish: Holding 23,700.0 could lead to a retest of 23,880.0 and 23,985.8.
🔽 Bearish: A break below 23,700.0 shifts focus to 23,587.4 and 23,480.0.
📛 Disclaimer: This is not financial advice. Trade at your own risk.
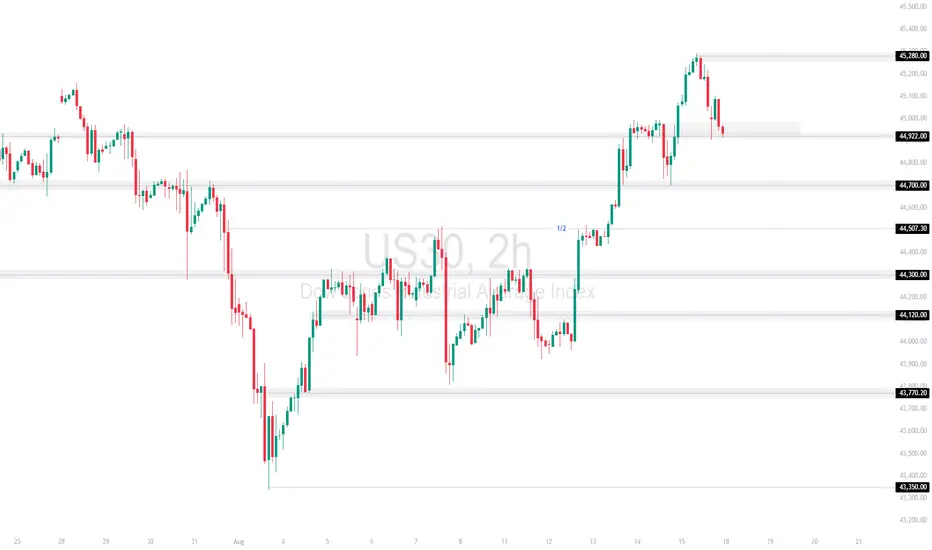
US30 – Retest at 44,922.00After touching 45,280.00 resistance, US30 is pulling back and testing the 44,922.00 level. A hold here could keep bullish momentum intact, while a break lower may open the way toward 44,700.00 and 44,507.30.
Support at: 44,922.0 🔽 | 44,700.0 🔽 | 44,507.3 🔽
Resistance at: 45,280.0 🔼 | 45,500.0 🔼
🔎 Bias:
🔼 Bullish: Holding above 44,922.0 could lead to another attempt at 45,280.0.
🔽 Bearish: A breakdown below 44,700.0 would weaken structure and expose 44,300.0.
📛 Disclaimer: This is not financial advice. Trade at your own risk.
BTCUSD: Will the Bulls Defend Key Support Zones?The Bitcoin chart reveals a significant technical pattern that traders should be watching closely. After a strong run-up, we are seeing the asset face considerable resistance, forming what appears to be a double-top structure near the $124,000 level. 📈 This price action suggests a potential reversal or a substantial pullback before any further upward continuation.
Bitcoin is currently trading within a short-term Fib Golden Zone , a critical area for bulls to defend. 🛡️ This zone spans between the 61.8% ($116,730) and 78.6% ($114,500) Fibonacci retracement levels. A decisive break below this range could signal a deeper correction.
Beneath the short-term support, there is a key "Order Block" that could act as the next line of defense for the bulls. 🧱 This area, typically marked by institutional buying interest, is a high-probability reversal zone.
A more significant test for Bitcoin's strength lies in the "Major Fib Golden Zone" and the "Fair Value Gap" below the current price. 🎯 This area, roughly between $108,000 and $103,000, represents a confluence of strong technical support. A drop into this zone would be a healthy retracement to re-test prior support levels before attempting a new leg up.
Failure to hold the key support levels and a breakdown below the Major Fib Golden Zone could see the price seeking a deeper floor towards the "Ext Support" level, near the $96,000 mark. 📉 This would invalidate the recent bullish structure and open the door for a more prolonged bear market.
Disclaimer
The information provided in this chart is for educational and informational purposes only and should not be considered as investment advice. Trading and investing involve substantial risk and are not suitable for every investor. You should carefully consider your financial situation and consult with a financial advisor before making any investment decisions. The creator of this chart does not guarantee any specific outcome or profit and is not responsible for any losses incurred as a result of using this information. Past performance is not indicative of future results. Use this information at your own risk. This chart has been created for my own improvement in Trading and Investment Analysis. Please do your own analysis before any investments.

8/15: Watch Resistance at 3348–3358, Support at 3328–3323Good afternoon, everyone!
Yesterday, gold’s rebound was capped at 3352–3358, failing to turn resistance into support. As anticipated, price then moved into the 3332–3323 battleground.
On the 2H chart, bulls still hold a slight edge, with signs of a potential double bottom. However, if price continues to face resistance at 3348–3352 without breaking out, or loses the key 3328 support on a pullback, bullish momentum will weaken, and a bearish setup may re-emerge, increasing the likelihood of a retest near 3300.
With important US session data ahead, my strategy today differs from yesterday — focusing on buying dips as the main approach, with shorting near highs as a secondary option. Manage risk carefully and feel free to reach out if you need assistance.

USDT Dominance at crucial 3.8 percent support level !USDT dominance is hanging around the 4% mark, and history shows it doesn’t spend much time below here. The 3.8% zone has been a strong bounce point—think March 11, 2024, and again late December / late January, both forming a clean double-bottom.
Right now, we could be setting up for the same pattern. If 3.8% holds, a bounce is likely, and we could see dominance climb back toward the 6–6.5% zone before rolling over.
But if it breaks decisively below 3.8%, that would be a first in years and could trigger a larger market shift—possibly a super cycle where BTC runs toward 150–200K.
Historically, late August into September often brings corrections or dumps, so I’m watching closely over the next few weeks.
Bottom line:
3.8% holds → bounce likely.
3.8% breaks → game changes completely.
What’s your take—bounce or break?

NZDUSD: Pullback Trade From Support 🇳🇿🇺🇸
NZDUSD will rise from a key daily horizontal support.
I see a strong intraday bullish price action on an hourly time frame
with a formation of a tiny double bottom and multiple strong bullish candles.
Goal - 0.5937
❤️Please, support my work with like, thank you!❤️

Will FETUSDT Trap the Bulls Before a Brutal Drop?Yello Paradisers — is FETUSDT setting up the perfect bull trap before a sharp sell-off? The current market structure suggests danger ahead, and ignoring it could be costly.
💎FETUSDT remains in a clear bearish market structure. After taking inducement, price is now moving toward a key resistance zone while following an ascending channel — a combination that typically increases the probability of a downside reversal.
💎If price reaches this resistance zone and begins showing bearish reversal patterns — such as a double top or head-and-shoulders — the odds of a strong move down will rise significantly. For aggressive traders, an early entry could be taken on a confirmed breakdown of the ascending channel, but this is not the safest play, as the risk-to-reward would be poor.
💎However, if FETUSDT breaks and closes above the invalidation level, our bearish idea will be completely off the table. In that scenario, the smarter move is to wait patiently for a fresh setup with cleaner price action before committing capital.
🎖Strive for consistency, not quick profits. Treat the market as a businessman, not as a gambler.
MyCryptoParadise
iFeel the success🌴
