BE → Two SLs → Discipline: A Raw, Honest Trading Day (With Recording Glitch)
Today wasn’t a winning day, and that’s exactly why I wanted to upload this video.
I started with a breakeven trade and then took two clean stop-losses. I’ve shared everything openly — no editing, no hiding, no reframing. This is what real trading looks like, and it’s important to show the losing days as honestly as the winning ones.
There was also a glitch while recording. The screen didn’t switch back from the Dhan platform to TradingView, so that part didn’t get captured visually, but the live commentary is still there. Even though the video isn’t perfect, I’ve uploaded it anyway for transparency.
My psychology is steady, and more importantly, I’m stopping here.
Knowing when to stop is part of discipline too.
I’ll come back tomorrow with a fresh mind and a fresh analysis.
For now, this video is simply a real look at a tough trading day — mistakes, losses, glitches, and the mindset behind handling all of it.
Double Top or Bottom

GOLD (XAU/USD): Consolidation ContinuesGold is currently consolidating within a horizontal parallel channel.
We spotted a notable bullish reaction to its support:
the price formed a small double bottom pattern and subsequently started to rise, violating its neckline with a bullish imbalance.
It is highly probable that the price will reach the 4220 level soon.

| Live TRADE | A Good Risk Reward - Trade Management LessonLIVE TRADE :
Whether Stop Loss or Target, the key is to learn the Process.
Risk Management, Trade management and Patience.
Trying to capture a higher R:R, 1:7 purely from process and learning experience.
Trade carried forward for tomorrow. Let's hope for the best.

$ZEC 4HBINANCE:ZECUSDT.P 4H
Clear Double-Bottom structure forming with neckline resistance ahead.
A confirmed breakout and retest of the neckline would validate bullish continuation.
Setup remains valid as long as the two lows hold.
#ZEC #Zcash

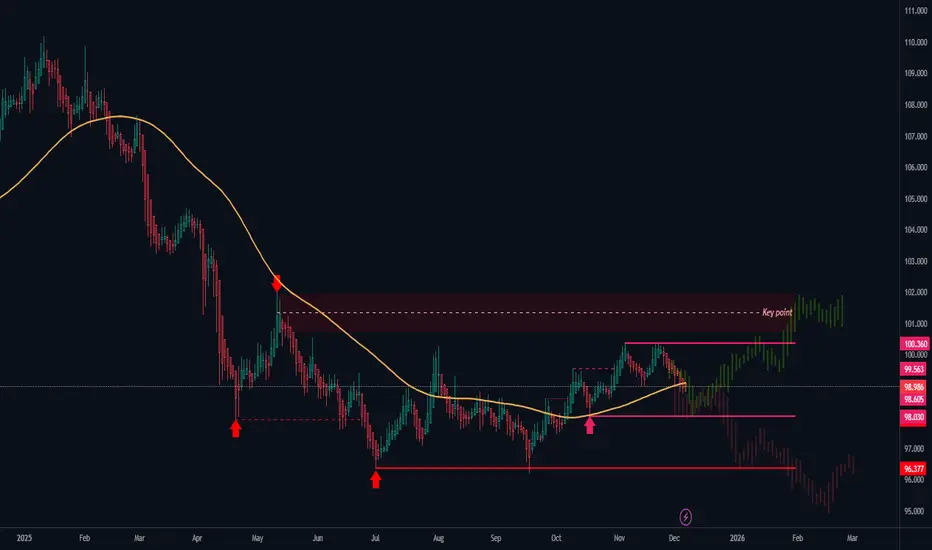
US DOLLAR INDEX - Key Breakout or Just a Relief Pump?INDEX:DXY
Not gonna lie, this chart looks like the dollar is walking on thin ice right now. Price just slipped under that 50 EMA after failing to pierce their high at 100.360
We've still got that solid support parked near 98.030 and if that gives way we will keep pointing straight down to the 96.3 liquidity shelf from mid-year.
The structure kinda screams “lower highs, lower strength,” and that supply zone up at 101.977 is still untouched, just chilling up there like a concrete slab ceiling.
And honestly… I’m not even big on following economic news, but lately I keep seeing about higher living costs and ‘soft landing’ things, so part of me feels like the $$ might be leaning bear by that alone. Am I the only one seeing that no? lol
Elite | XAU/USD – 30m | Bullish Compression Targetting ATH 4300$OANDA:XAUUSD
Price continues to defend major support (4,150–4,175) with repeated upside structure shifts (BOS). Descending trendlines are compressing price, signaling breakout readiness. As long as price remains above the demand zone, bullish continuation remains favored.
If price re-tests demand & holds → breakout scenario becomes high probability.
A confirmed break above 4,228 unlocks liquidity toward 4,256 and the extended upper target.
Key Scenarios
🔼 Bullish Breakout Plan
Hold above 4,194 support → bullish bias active
Break & retest 4,228 = entry trigger
🎯 Targets → 4,256 → 4,265+
🔽 Failure Case
Bearish only if price closes below 4,150 zone
Below this → structure collapses + deeper correction likely
⚠ Disclaimer: Market analysis only — not financial advice.

EURUSDOn the daily TF price came back and retested a weekly support zone, bounced off with momentum forming a double bottom with neckline broken which could signal a potential strong upward movement. H4 is at a support trendline and H1 is possibly forming a bullish flag. Lets wait and see this weeks price action

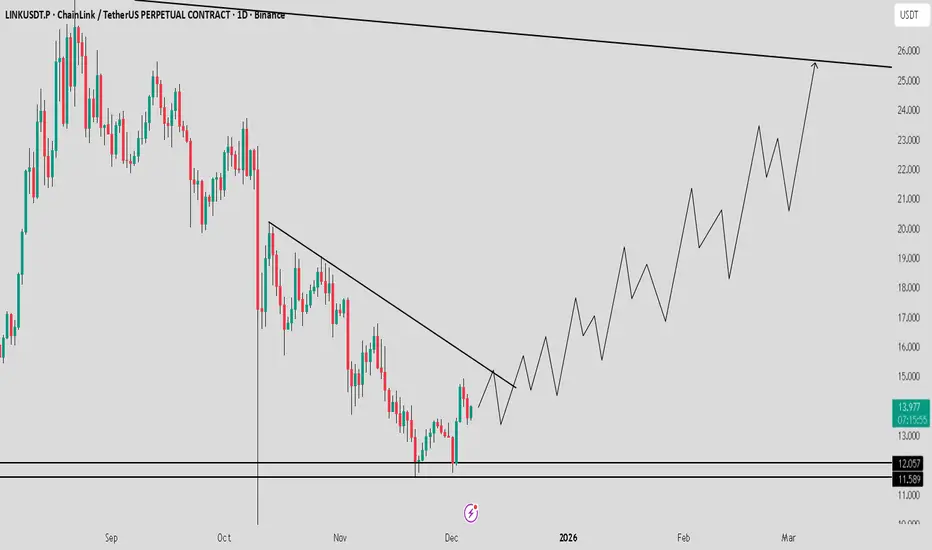
LINK Showing Strong Spot Structure_Double Bottom Point Toward 25If you want to accumulate a strong spot coin, LINK / USDT is one of the best options right now. It has formed a clean double bottom and is showing strong upward momentum. I expect a continuation move toward $25 soon. Manage risk wisely and always follow confirmations.
CRM - Minor Downtrend Line Broken!CRM - CURRENT PRICE : 260.57
CRM previously entered a downtrend following a double-top reversal , which pushed the stock into a prolonged bearish trend. However, current price action shows early signs of trend change as CRM successfully breaks above the minor downtrend line with strong momentum.
Momentum indicators are confirming the shift:
⚡RSI has turned bullish and moved decisively above 50
⚡MACD shows a bullish crossover with improving histogram
With improving trend structure and bullish indicators, CRM may continue its upward recovery. Price may extend toward 278.00 and 296.00 as long as it stays above 242.00 (near EMA 50).
ENTRY PRICE : 260.57
FIRST TARGET : 278.00
SECOND TARGET : 296.00
SUPPORT : 242.00

XAUUSD- GOLD FORMING "W" PATTERN KEY (READ CAPTION)Hello trader's what do you think about gold
Gold (XAUUSD) is currently forming a clear W Pattern / Double Bottom structure, which is a strong indication of a potential bullish reversal in the market.
Support Levels
Support 1: 4180 — A strong reaction zone where buyers have previously held the market multiple times.
Support 2: 4293 — A higher support zone that can act as a continuation level if price respects it on a pullback.
Market Outlook
The price action is showing a clean W pattern, suggesting that if the neckline breaks, we can expect a strong bullish move.
If price retraces downward, both 4180 and 4293 serve as ideal buy zones for buyers preparing for the next bullish leg.
Technical Summary
W Pattern → Potential bullish reversal
4180 → Deep correction support
4293 → Continuation support
please don't forget to like comment and follow

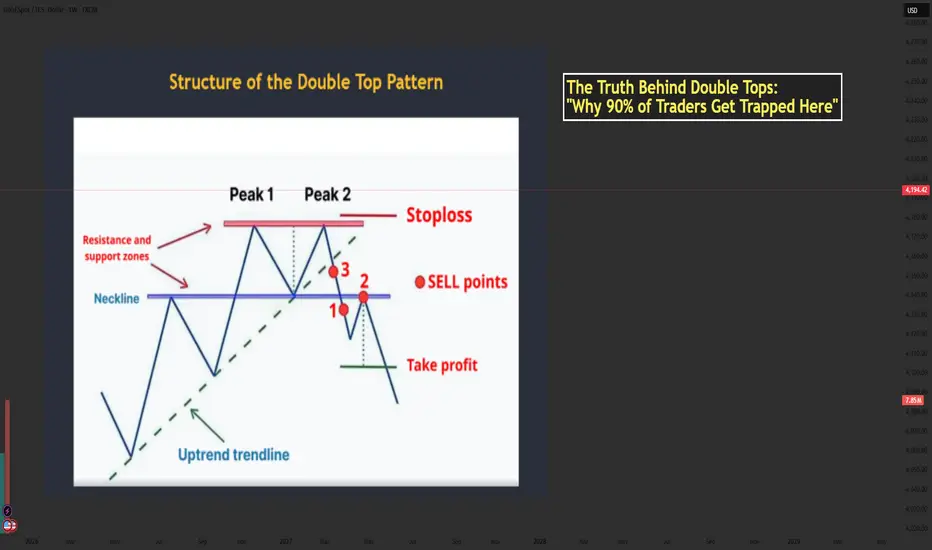
The Truth Behind Double Tops: Why 90% of Traders Get Trapped...📘 Mastering the Double Top Pattern — Structure, Psychology & How Smart Money Uses It
- The Double Top is one of the most powerful reversal patterns in technical analysis. When used correctly, it helps traders catch the transition from bullish momentum → bearish reversal with high accuracy.
- Let’s break down the structure using the chart you provided and enhance it with professional-level insights.
🔶 1. Structure of the Double Top
1️⃣ The First Top
- Price pushes upward strongly during an uptrend.
- Buyers are in full control and create the first peak.
- After reaching resistance, price pulls back → forming the neckline.
This pullback is normal and represents the market taking profits.
2️⃣ The Second Top
- Price rallies again but fails to break above Peak 1.
- This failure is extremely important — it shows bulls are losing strength.
- The second top traps late buyers who expect a breakout.
3️⃣ The Neckline Break
- Once price breaks below the neckline, the structure is officially confirmed.
- This represents sellers overwhelming buyers.
- A break of structure → shift in market control.
📌 Professional traders only consider the pattern valid AFTER the neckline break.
🔶 2. Market Psychology Behind the Double Top
Understanding the pattern’s psychology is what separates beginners from professional traders.
1️⃣ At Peak 1
Bulls believe the trend will continue.
Retail traders buy aggressively.
2️⃣ Pullback to Neckline
A healthy correction occurs; no one expects a reversal yet.
3️⃣ At Peak 2
This is where emotions start to shift:
- Retail buyers expect a breakout.
- Smart Money uses this area as a liquidity zone to trigger buy stops.
- Institutions often sell into this liquidity, creating the foundation for reversal.
4️⃣ Neckline Break
Panic begins:
Buyers trapped at Peak 2 start closing positions.
Sellers enter aggressively.
Momentum shifts — the trend has reversed.
5️⃣ Retest
The retest is a psychological trap:
- Trapped buyers hope for “one more push up.”
- Sellers add positions at better prices.
- When price rejects the neckline → the downtrend accelerates.
💡 This is why the retest is the safest sell entry.
🔶 3. Conditions for a High-Quality Double Top
To avoid fake patterns, check these criteria:
✔️ Must appear after a clear uptrend
✔️ Both tops should be similar in height
✔️ Volume should decrease on the second top
✔️ Neckline breakout must be decisive and clean
✔️ Better if second peak creates a stop-hunt wicking above Peak 1
✔️ Even more powerful when aligned with:
- HTF resistance
- Institutional zones
- Liquidity sweeps
- Overbought RSI
- Divergence
🔶 4. How to Trade the Double Top
1️⃣ Entry (Sell Zone)
Best Entry:
👉 SELL on the neckline retest after the breakout.
This gives:
- Best accuracy
- Best risk–reward
- Confirmation that the market has shifted bearish
2️⃣ Stop Loss Placement
Place SL:
- Above Peak 2
- Or above Peak 1 (more conservative)
🛑 SL must sit outside the structure to avoid fake moves.
3️⃣ Take Profit Target
The classic measurement:
- Distance from Peak → Neckline
- Projected downward
This gives the first TP.
TP2 can be placed at:
Next support zone
- Fib 1.618 extension
- HTF demand area
🔶 5. Real Market Example
Your image shows:
- Two clear peaks forming under a resistance zone
- Neckline support holding price
- A strong break below the neckline
- Sell entries at the ideal points:
+ Point 1 → aggressive breakout trader
+ Point 2 → safest retest entry
+ Point 3 → early anticipation entry (riskier)
The downward projection after the pattern aligns perfectly with the expected target zone.
🔶 6. Trader Psychology: Why People Lose with Double Tops
Most traders get trapped because they:
❌ Sell too early (before neckline break)
❌ Expect the second top to drop immediately
❌ Ignore volume or candle strength
❌ Enter without waiting for retest
❌ Fear missing out and chase price after the big drop
Smart Money uses these emotions:
- Greed → traps buyers at Peak 2
- Fear → forces panic selling at neckline break
- FOMO → attracts late sellers at the worst price
Your job is to stay patient and enter only at the retest, where probability is highest.
🔶 7. Professional Tips to Master the Double Top
✔️ Wait for structure confirmation → neckline break
✔️ Don’t sell inside the range between the two peaks
✔️ Use RSI divergence to strengthen accuracy
✔️ Look for stop-hunt wicks above Peak 2
✔️ Combine with trendline breaks for timing
✔️ Use a top-down approach (H4 + H1 → M15 entry)
✨ Final Message for Traders
The Double Top is not just a pattern it is a reflection of fear, greed, and trapped liquidity.
Master the psychology behind it, and it becomes one of your most reliable reversal tools.
If this helped your trading, drop a comment and share your thoughts!
Let’s grow together. ❤️📈
Double top still activeThe price is testing the broken support level at 300 ish now resistance. Double top is still active in the weekly timeframe. I think the price is going to be rejected soon specially with bitcoin heading lower to 75K. SL triggers if a weekly candles break up the 300 resistance and closes above it.

Selena | XAUUSD 30M – Trend Support + Liquidity Hunt ScenarioFOREXCOM:XAUUSD OANDA:XAUUSD PEPPERSTONE:XAUUSD
4H candle chart thought
Structure remains bullish as long as the trendline + holding zones hold. Smart-money liquidity sits above previous highs — a break may initiate continuation to extended targets.
📈 Bullish Scenario (Primary Bias)
If price holds above 4,200 and reclaims the entry block:
🎯 TP1 – 4,240–4,245
🎯 TP2 – 4,258–4,260 (Buy-Side Liquidity)
🎯 Final Target – 4,270+
📉 Bearish Invalidations
Break & close below: 4,176
Stronger confirmed reversal below: 4,125
Current Levels To Watch
Resistance 🔴: 4,245 / 4,260 / 4,275
Support 🟢: 4,200 / 4,176 / 4,120
⚠️ Disclaimer: For educational purposes only — not financial advice.

MSFT PullbackPattern Identified: Bearish Double Top pattern confirmed on Microsoft ( NASDAQ:MSFT ) with neckline break and clear measured move objectives. Neckline Break Triggers Measured Move to Gap Fill.
Key Confluence:
First Top: Initial rejection
Second Top: Failed breakout, lower high
Neckline: Support connecting swing lows between tops
Confirmation: Neckline break & retest completed
Measured Move Calculation:
TP1: Distance from highest top to neckline, projected onto the breakout zone = $430
TP2: Gap fill zone from May 1st, 2025 = $400
SL: Above Neckline at previous confirmation

SilverDivergence, Double top then Triple Top, Rising wedge, Resistance played its role now, trend line is at breakup point. I guess its a retracement of silver till Fib 0.382

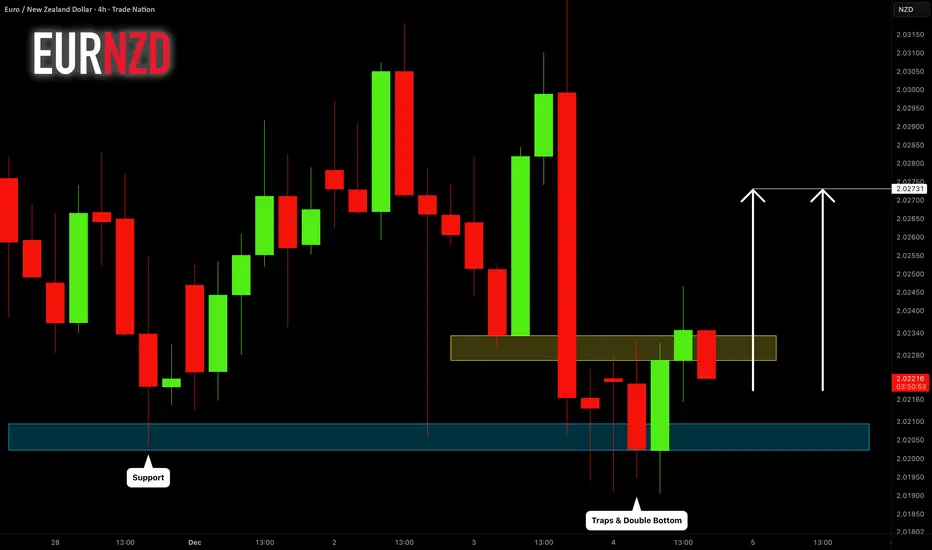
EURNZD: One More Pullback?! 🇪🇺🇳🇿
Looks like we will see another pullback on EURNZD.
The pair looks bullish after multiple traps below a key intraday/daily support.
A double bottom pattern gives a strong confirmation.
I expect a pullback to 2.0273
❤️Please, support my work with like, thank you!❤️
I am part of Trade Nation's Influencer program and receive a monthly fee for using their TradingView charts in my analysis.

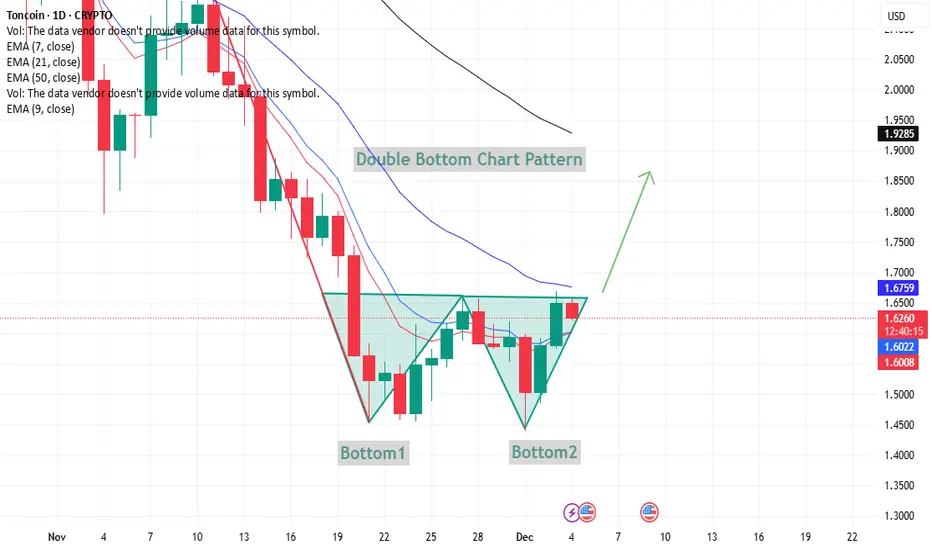
TONUSD – Double Bottom Formation TONUSD – Double Bottom Formation (Neutral Technical View)
The chart shows a double bottom structure, where price formed two lows (Bottom 1 and Bottom 2) near the same zone. This is generally watched as a potential reversal signal when price moves back toward the neckline.
Key observations:
Bottom 1 and Bottom 2 highlight buyers defending the same support area.
Price is now approaching the neckline zone around 1.65–1.67, which is an important technical barrier.
If candles can hold above the short-term EMAs (9 and 21), it strengthens the idea of momentum shifting upward.
A close above the neckline would indicate continuation toward higher resistance levels, while rejection could keep the pair in consolidation.
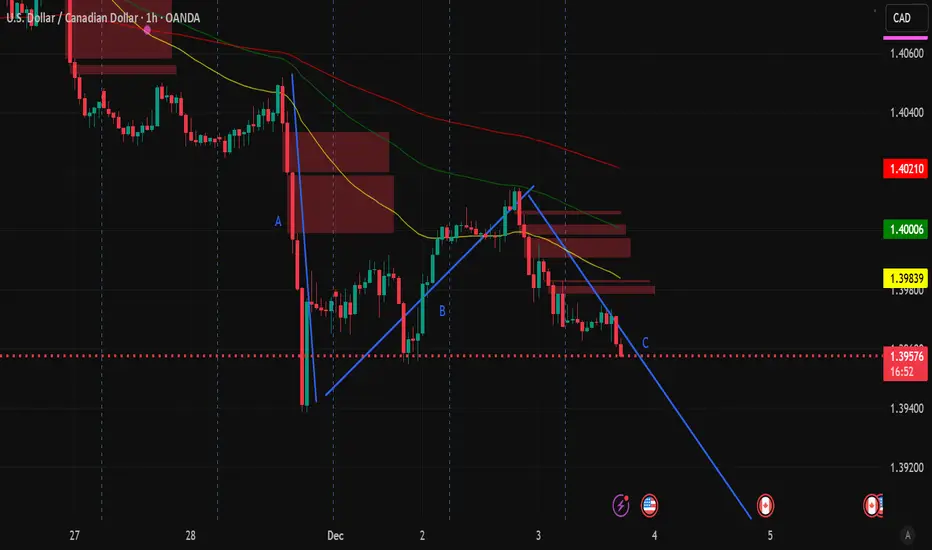
An attempt at ABC DrawingI saw somebody draw an ABC pattern and I am not exactly familiar with it so I looked it up a little bit and this is my version of it. I will learn more about ABCD patterns in the future. It seems promising.
BTCBTC is forming a double bottom right at the 0.786 Fibonacci level, an area that tends to be very strongly respected. At the same time, the upper boundary of the current distribution range can act as a technical magnet. The influx of heavy volume and the strength patterns on the daily chart significantly increase the odds of a move up to $100,000.

Bright Dairy & Food (Group) Co. LtdThe price is showing accumulation on strong support with the presence of high volume, which indicates the involvement of large institutional investors.
This Chinese company produces and distributes dairy products and processed foods, and it is perfectly aligned with the context of a likely rally in the Yili-Mengniu dairy duopoly, which is a very positive signal. It’s as if the big players are gearing up for an upward move.

MengniuSuch a deep pullback into a key zone, especially on a higher timeframe, strongly suggests a very probable price increase ahead. I estimate around 40% upside.
The scale of Yili and Mengniu (the duopoly) gives them superior access to capital markets at significantly lower financing costs. Moreover, their purchasing volume allows them to negotiate preferential prices for key inputs, such as livestock feed. This lower cost structure means the duopoly’s breakeven threshold is much lower than that of their competitors, ensuring that—even in an environment of historically low prices—they have the ability to withstand pressure and continue operating profitably while smaller and medium-sized companies become insolvent.

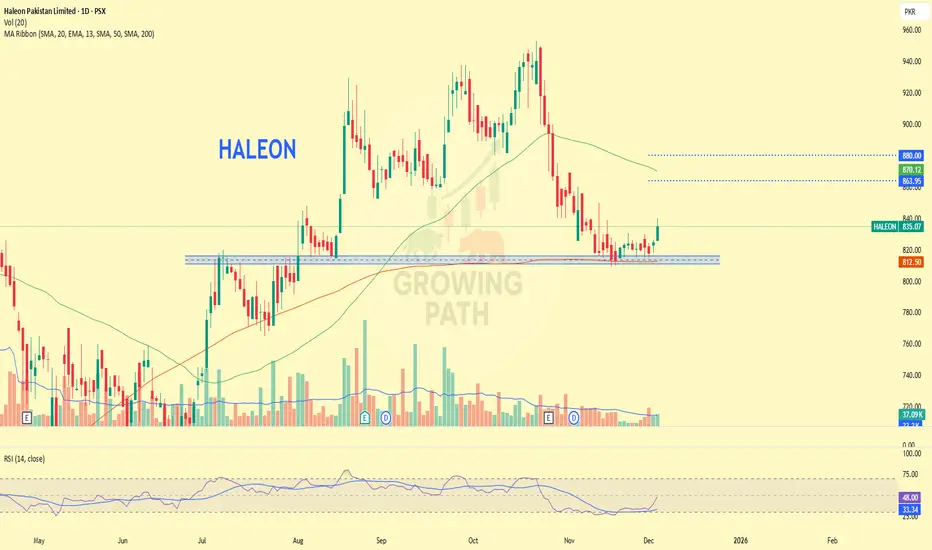
HALEON – Double Bottom ConfirmationHALEON Price has formed a clear double bottom, and the major support zone has now been tested for the third time, strengthening the bullish reversal setup. With today’s breakout candle and improving momentum, the stock shows strong potential for a continued move upward toward the 863 → 880 resistance band.
📈 Trade Plan
Buy between: 827 – 836 area
Stop-Loss: 809
Targets: 863 / 880
Holding above support keeps the bullish structure intact.