SHORT ON NAS100Nice Double Top on NAS at a major resistance level.
I will be selling nas to the next demand level for 2000-3000 points.
Double Top or Bottom

SHORT ON SPYNice Double Top at a Major supply zone on spy.
I will be selling spy to the next demand zone for almost 900 points. (INSANE)

nice inside day range reversal. after seeing 3 pushes down in the setup after an inside day . we now see the entry for a range reversal from the inside day . targeting the high of the previous day.
LONG . LONG . LONG

BTC Traders: Buy the Dip or Wait for the Break?Bitcoin broke out of its range, hit 97K, and is now consolidating near key resistance at 99K. Traders are watching for either a bullish breakout or a dip to buy. Watch the video to learn more.
This content is not directed to residents of the EU or UK. Any opinions, news, research, analyses, prices or other information contained on this website is provided as general market commentary and does not constitute investment advice. ThinkMarkets will not accept liability for any loss or damage including, without limitation, to any loss of profit which may arise directly or indirectly from use of or reliance on such information.

EURCAD: Still Bearish Outlook 🇪🇺🇨🇦
Last week, we discussed a confirmed bearish breakout of
a major horizontal support on EURCAD.
The broken structure was retested, and I see a strong bearish
intraday price action on an hourly time frame.
Probabilities will be high to see a down movement at least to 1.558 level today.
❤️Please, support my work with like, thank you!❤️
I am part of Trade Nation's Influencer program and receive a monthly fee for using their TradingView charts in my analysis.

Googl at pivotGoogl is at a pivot point here touching historic levels from 2021. The company is a cash flowing machine and FUD has taken control at this point. The market forgets that the company is diversifying away from search as a business. The market forgets about youtube, waymo, and recent wiz acquisition. Stocks bottom on bad news, not good news. I think we see 200$ soon. Double bottom is apparent to me.

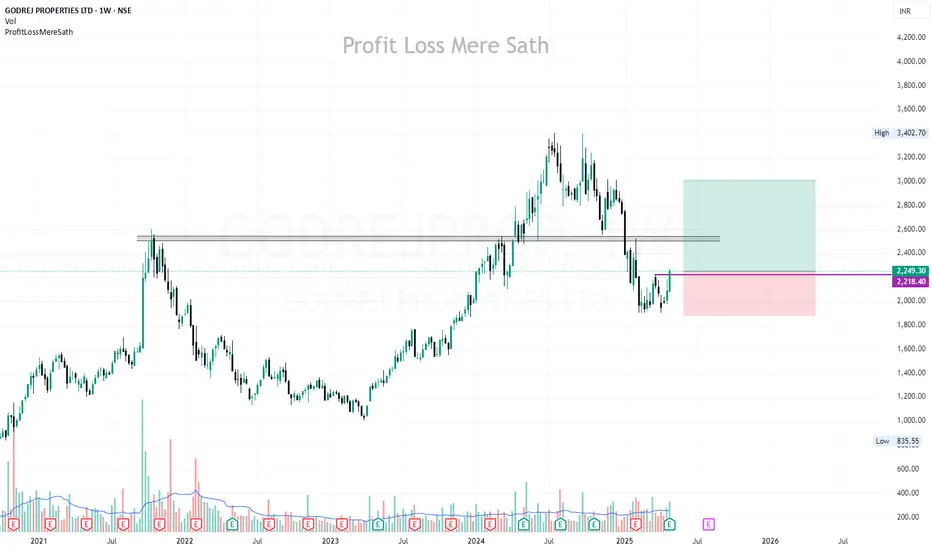
GODREJPROP | Buy @LTP | SL below 1870 | 1st Target 3000Disclaimer:
This is not financial advice. Please do your own research or consult with a financial advisor before making any investment decisions. Investments in stocks can be risky and may result in loss of capital.
Us 30 target sellBecause patten DBtop and price go to Fibonacci 50% and SND zone Drop base Drop.. possibility the good zone to sell

Good PalantirianNoticed recently there is very few NASDAQ:PLTR stock for sale on the market. As a good and kind trader I decide to borrow ad sell couple of NASDAQ:PLTR like a good move to provide liquidity to the market and help other traders to obtain so passionately desired Palantir stock.
Dear Palatirians pls don't get me wrong. I'm not betraying our faith, just need to step back for a while

NZDCAD - Bearish Triple TOPHello Traders !
On Monday 21 April, The NZDCAD reached the resistance level (0.83146 - 0.82973).
The price formed a triple top pattern.
Currently, The neckline is broken !
So, I expect a bearish move📉
______________
TARGET: 0.80610🎯

NASDAQ INDEX (US100): Time for Pullback
There is a high chance that US100 will retrace from the underlined
blue daily resistance.
I spotted a double top pattern on a 4h time frame after its test
and a nice bearish imbalance candle that was formed
during the NY session yesterday as confirmations.
Goal - 19590
❤️Please, support my work with like, thank you!❤️

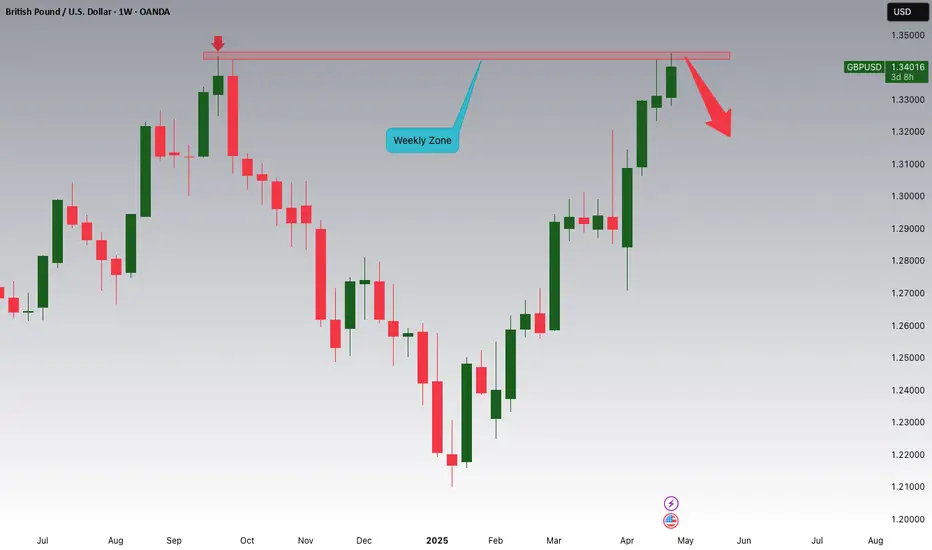
GBPUSD is Forming a Weekly Double Top!!!Hey Traders!
In today's session, we're closely watching GBPUSD for a potential short setup around the 1.34200 level.
The pair is currently forming a double top pattern on the weekly timeframe, a classic reversal signal. Price action is showing signs of rejection at the neckline, suggesting possible downside momentum from this key resistance zone.
Trade safe, Joe.
GBPUSD breakout could target 1.47GBPUSD is testing key resistance and may be gearing up for a breakout toward 1.47, with a potential 17:1 reward. Even if it reaches just a third of that move, the setup remains highly attractive.
This content is not directed to residents of the EU or UK. Any opinions, news, research, analyses, prices or other information contained on this website is provided as general market commentary and does not constitute investment advice. ThinkMarkets will not accept liability for any loss or damage including, without limitation, to any loss of profit which may arise directly or indirectly from use of or reliance on such information.

TSLA | Buy @LTP | SL below 240 | 1st Target 360⚡ Tesla (TSLA) – Breakout from Demand Zone, Big Upside Potential
TSLA recently respected the strong demand zone around $220–$240 and has bounced sharply with increasing volume, signaling renewed buying interest. Price has now cleared immediate resistance and is forming higher lows a bullish sign.
📍 Entry: $282.16
🎯 Targets:
TP1: $330 (mid-level)
TP2: $367.34 (major resistance zone)
❌ Stop-loss: Below $242.79
This setup offers an excellent risk-to-reward ratio with a potential breakout rally if broader market sentiment supports tech.
Volume spikes confirm accumulation, and momentum indicators are likely flipping bullish. Keep an eye on price action near $300 for further confirmation.

Double top mate! (GBP/USD)OK, it's not really a double top (although lots of people refer to these situations as such)
It's a re-test of the long term high and could see the current uptrend get rejected.
Can look to the daily chart for confirmation of the breakdown
Thoughts?

Wajani Investments: TSLA AnalysisDaily chart
Observations: TSLA has tested a key level turning resistance into support with a double bottom, head and shoulder as seen from the W formation. If you zoom the chart properly, you'd see TSLA direction is uptrend and the above indicators show TSLA moving higher.
Always adapt to the market as it changes. The analysis done here is more of a guidance than fact.
Let me know your thoughts.
Thank you.

USOIL - Bearish Double TOPHello Traders !
The USOIL price formed a double top pattern.
Currently, The neckline is broken !
So, I expect a bearish move📉
________________
TARGET: 59.410🎯

AMP (ASX) Quarterly 2618 patternAMP (ASX) on the quarterly has a 2618 pattern
This is a double bottom followed by a breakout in this case its to the upside confirming the double bottom, followed by a 61.8% retracement
Hence named 2618
If today closes near where it is, it will form a bullish hammer which supports a move higher in the medium term
Full disclosure I already own this stock from last year and posted about it a few times already

SHORT ON GBP/USDGBP/USD Has bearish divergence on the 4hr timeframe.
This is a bearish reversal indication. Price is also over brought on GU.
The Dollar (dxy) Looks like it will start to rise from its demand area.
I will be selling GU looking to catch over 300-400 pips to the previous swing low /demand zone.

BX, double bottomBlackstone has recorded a double bottom at $119 and a fake bullish crossover lately.
Now it is approaching a new bullish crossover and is working to create a new relative high that would create a good positive price action.

EURGBP Technical Setup: 1:3 R:R Opportunity on RetestAfter the drop to 0.8250 — a level not touched since 2022 — EURGBP rebounded to 0.8450 before starting another decline.
However, the 0.8250 support held firm once again, a higher low follow, and EURGBP eventually broke above 0.8450, confirming a double bottom pattern.
Price acceleration quickly took the pair above 0.8700, and now EURGBP is undergoing a normal correction.
The broken neckline at 0.8450 now acts as clear support.
Traders could look to buy near the 0.8450 retest, using a tight stop below the neckline, and aiming for at least a 1:3 risk-reward ratio.
Disclosure: I am part of Trade Nation's Influencer program and receive a monthly fee for using their TradingView charts in my analyses and educational articles.

KSE100, Double Top with Bearish DivergenceDouble Top
Bearish Divergence
Closing Below 109500 will bring Index to 100k
Weekly Gap @ 100k will be filled with trendline Support
Double Top projections also aligned @ 100k

BTC/USD Price Action Update – April 28, 2025📊BTC/USD Price Action Update – April 25, 2025
🔹Current Price: 94,039.17
🔹Timeframe: 15M
📌Key Demand Zones (Support):
🟢93,331.61–93,464.50 – Immediate Intraday Demand (potential bullish continuation zone)
🟢92,901.29–93,042.00 – Deeper Demand Support (stronger reaction expected if tapped)
📌Key Resistance Level:
🔴94,518.29 – Short-Term Target Resistance
📈Bullish Outlook:
Price has shown strong recovery from the demand zones. Holding above 93,331 keeps the bullish structure intact. A clean break and retest can push price toward 94,518. Watch for bullish engulfing or BOS for confirmation.
📉Bearish Outlook:
If price breaks below 93,331, expect a deeper pullback into 92,901–93,042. Loss of 92,900 could indicate short-term bearish momentum.
⚡Trade Setup Tip:
✅Look for long setups on bullish reaction at 93,464 or 93,042
✅Manage trades carefully near 94,500 resistance
✅Use tight stop-loss for scalps below demand zones
#BTCUSD #BitcoinTrading #CryptoAnalysis #SmartMoneyConcepts #SupplyAndDemand #IntradayTrading #BreakOfStructure #BTCScalping #CryptoUpdate #FXFOREVER #ForexAndCrypto
