AUDJPY: Short Term Bearish Movement 🇦🇺🇯🇵
AUDJPY may drop from the underlined intraday horizontal resistance.
We can expect a retracement at least to 99.9 level.
❤️Please, support my work with like, thank you!❤️
I am part of Trade Nation's Influencer program and receive a monthly fee for using their TradingView charts in my analysis.
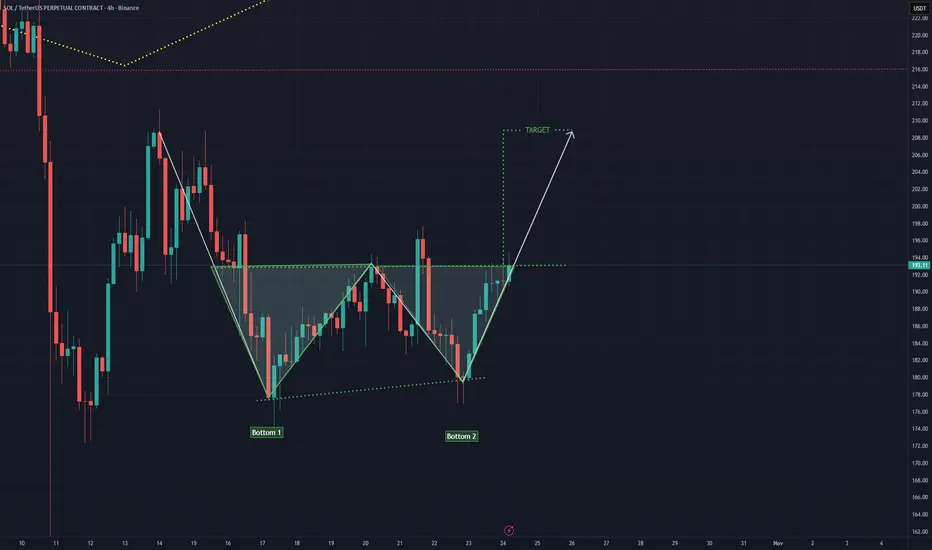
Double Top or Bottom

GBPUSD DAILY SHORTAfter the formation of the double top pattern, the price experienced a sharp and rapid drop, reaching its last major low. It is now pulling back to that same price level, and I expect another decline toward the specified zone.

DXY - Long Term Trade - Double Bottom - Swing TradeTrade Plan shared on chart. 1:3 Trade Target set. Buy Stop pending Trade set at break of Neckline of the Double Bottom. Analysis shared with detail.

DXY - Long Term Trade - Double Bottom - Swing TradeTrade Plan shared on chart. 1:3 Trade Target set. Buy Stop pending Trade set at break of Neckline of the Double Bottom. Analysis shared with detail.

Double Bottom on $ROOTNASDAQ:ROOT has retraced to its 100 W moving average and is bouncing off it at the moment. This is occurring within a lower volume lower low within a 24 W bollinger band while (importantly) not touching the lower limit. Many new investors entered last quarter (between orange lines) and if they haven't sold out, could provide the support for a base above current price.

Has GE Vernova Peaked?GE Vernova appreciated more than 400 percent since getting spun off in April 2024. Now some traders may see a peak in the maker of power-generation equipment such as turbines and windmills.
The first pattern on today’s chart is $664.55, the record closing high from August 6. GEV peaked at the same level on October 15, resulting in a potential double-top.
Second, MACD is falling and the 8-day exponential moving average (EMA) is below the 21-day EMA. That may suggest its short-term trend is turning bearish.
Third, prices are under the falling 50-day simple moving average. That may suggest its intermediate-term trend has turned bearish.
Finally, you have the September 3 low of $565.43. GEV probed that level after the last earnings report. It stayed above it for the next several sessions, but yesterday it closed below it. Is support breaking?
TradeStation has, for decades, advanced the trading industry, providing access to stocks, options and futures. If you're born to trade, we could be for you. See our Overview for more.
Past performance, whether actual or indicated by historical tests of strategies, is no guarantee of future performance or success. There is a possibility that you may sustain a loss equal to or greater than your entire investment regardless of which asset class you trade (equities, options or futures); therefore, you should not invest or risk money that you cannot afford to lose. Online trading is not suitable for all investors. View the document titled Characteristics and Risks of Standardized Options at www.TradeStation.com . Before trading any asset class, customers must read the relevant risk disclosure statements on www.TradeStation.com . System access and trade placement and execution may be delayed or fail due to market volatility and volume, quote delays, system and software errors, Internet traffic, outages and other factors.
Securities and futures trading is offered to self-directed customers by TradeStation Securities, Inc., a broker-dealer registered with the Securities and Exchange Commission and a futures commission merchant licensed with the Commodity Futures Trading Commission). TradeStation Securities is a member of the Financial Industry Regulatory Authority, the National Futures Association, and a number of exchanges.
TradeStation Securities, Inc. and TradeStation Technologies, Inc. are each wholly owned subsidiaries of TradeStation Group, Inc., both operating, and providing products and services, under the TradeStation brand and trademark. When applying for, or purchasing, accounts, subscriptions, products and services, it is important that you know which company you will be dealing with. Visit www.TradeStation.com for further important information explaining what this means.

TRUMP : SIGNALHello friends
Given the good growth we had and the entry of buyers, now that the price is correcting and a double bottom pattern has formed, there is a good opportunity to buy with risk and capital management and move towards the specified goals.
*Trade safely with us*

BTCCRYPTOCAP:BTC 1W Analysis
Bitcoin has printed a clear Double Top near $120K and broke below the neckline $105K.
Weekly structure turning bearish unless we reclaim that level.
Targets:
T1 - $92K
T2 - $89K
T3 - $84K
Bias: Bearish until weekly close $105K.
#BTC #Bitcoin #Crypto #YodaXCalls

The Double Bottom Trap That Traders Might Miss1. The Comfort Zone of Classic Patterns
Few formations attract traders’ attention like a double bottom. It’s one of those timeless chart patterns that promise hope after a long decline—a visual story of selling exhaustion followed by a bullish reversal.
But markets rarely reward what’s obvious. In futures trading, especially when examining instruments like Bitcoin Futures (BTC) and Micro Bitcoin Futures (MBT), patterns are only half the story. What truly moves price isn’t just the shape on the chart—it’s the order flow behind it.
That’s where understanding FO (Filled Orders) and UFO (UnFilled Orders) becomes essential. Both represent past and potential liquidity imbalances, and reading their relationship can transform how traders interpret “classic” setups.
2. The Bitcoin Setup: A Tale of Two Bottoms
The current BTC daily chart paints what seems like a textbook double bottom. Two price troughs form near the same horizontal area around $104,000, setting up the typical “W” shape many traders see as a bullish reversal pattern.
However, when we dig deeper into the order flow structure, the illusion begins to fade.
A FO Support level exists near $103,860, meaning that this area previously attracted enough buyers to halt a decline—but those orders have already been filled and we know this given the fact that price turned at that price level before.
The next UFO Support zone sits much lower, around $95,640. That’s where unfilled buy orders are expected to remain waiting, untouched.
This distinction matters. While FO zones mark previous turning points, UFO zones highlight potential turning points that still contain resting liquidity. In simple terms, FO areas represent “used energy,” while UFO areas represent “stored energy.”
3. FO vs. UFO – The Order Flow Reality Check
Let’s define these two concepts with precision:
FO (Filled Orders): Price zones where significant buying or selling already occurred. These levels once reversed price, but because those orders were executed, fewer remain to defend the level again.
UFO (UnFilled Orders): Price zones containing pending buy or sell orders not yet triggered. They represent areas of fresh imbalance and therefore carry a higher probability of influencing future price moves.
In our Bitcoin case, the FO Support around $103,860 has done its job already—it stopped price before. But now, the unfilled buying interest lies lower, implying that the market may need to travel down to reach fresh demand at $95,640.
On the other side, UFO Resistance hovers near $112,410, enveloping the top of the double bottom structure. Should the price rebound toward that level, sellers waiting there could re-enter the scene, potentially capping any bullish recovery.
The conclusion? This pattern isn’t as bullish as it looks.
4. When Bullish Shapes Hide Bearish Probabilities
Most traders spot the double bottom and immediately think “trend reversal.” Yet, the distance between FO and UFO levels tells a more subtle story.
Since FO Support levels carry reduced strength after being tested, they’re more likely to break than hold. In this context, the probability favors a downside continuation rather than an immediate bounce.
If price breaches $103,860, the next probable destination becomes the UFO Support at $95,640. Only then, after reaching that pocket of unfilled demand, might a significant rebound have higher odds.
It’s a reminder that technical patterns, while valuable, must always be filtered through liquidity context. A pattern without order flow validation is like reading the market’s outline without its story.
5. Quantitative Insight: A Probabilistic Lens
Think of this in probabilistic terms:
When FO zones sit above UFO zones, the market often continues toward the unfilled liquidity.
When UFO zones lie closer to current price, reversals occur faster because demand (or supply) is still waiting to be executed.
In our example, BTC shows a larger gap between FO and UFO support levels, signaling lower immediate reversal odds. The chart may appear bullish, but the underlying order flow distribution points to weakness first, strength later.
This is not a prediction—it’s an observation of potential. It allows traders to structure their expectations based on where fresh participation is more likely to emerge.
6. Risk Management: Navigating the Trap
For traders considering setups around this structure, risk management is crucial.
Entry awareness: Avoid entering long positions purely because a double bottom “looks bullish.” Consider waiting for evidence of unfilled demand being triggered (confirmation at or near UFO Support).
Stop-loss placement: Stops below FO Support can easily be hunted in liquidity sweeps; better to align risk control with genuine unfilled demand areas.
Reward-to-risk thinking: A test of the UFO Support near $95,640 could later offer a more favorable upside-to-downside ratio than buying prematurely at $104,000.
Remember, pattern-based entries without liquidity confirmation often carry poor asymmetry—small upside with large downside risk.
7. Futures Structure and Margin Awareness
Both BTC and MBT represent Bitcoin exposure via futures contracts, but their sizing differs dramatically.
BTC equals 5 Bitcoin per contract, making it suitable for larger, institutional players. (1 Tick = 5 = $25. Required Margin = $132,500)
MBT, the Micro Bitcoin Futures, equals 0.1 Bitcoin per contract, offering flexibility for smaller accounts and finer position scaling. (1 Tick = 5 = $0.50. Required Margin = $2,600)
Understanding margin requirements is essential—these products are leveraged instruments, and small price changes can result in large percentage gains or losses.
8. Key Takeaway: The Hidden Lesson
This entire setup illustrates a powerful educational point:
Chart patterns may draw the eye, but order flow tells the truth.
The double bottom may invite buyers, but the imbalance between FO and UFO zones exposes an underlying weakness. Traders who rely solely on visual patterns may walk straight into a trap. Those who align patterns with liquidity insights, however, read the market at a deeper level.
In the current context, BTC and MBT might need to visit lower support levels before finding true stability. Watching how price behaves around these unfilled order zones will reveal whether this double bottom turns into a lasting floor—or just another false start.
When charting futures, the data provided could be delayed. Traders working with the ticker symbols discussed in this idea may prefer to use CME Group real-time data plan on TradingView: www.tradingview.com - This consideration is particularly important for shorter-term traders, whereas it may be less critical for those focused on longer-term trading strategies.
General Disclaimer:
The trade ideas presented herein are solely for illustrative purposes forming a part of a case study intended to demonstrate key principles in risk management within the context of the specific market scenarios discussed. These ideas are not to be interpreted as investment recommendations or financial advice. They do not endorse or promote any specific trading strategies, financial products, or services. The information provided is based on data believed to be reliable; however, its accuracy or completeness cannot be guaranteed. Trading in financial markets involves risks, including the potential loss of principal. Each individual should conduct their own research and consult with professional financial advisors before making any investment decisions. The author or publisher of this content bears no responsibility for any actions taken based on the information provided or for any resultant financial or other losses.

Z CASH Would you risk one to gain 5?IT seems like a good area to pick up a "asset"
at a previous All time low.
Buying weakness vs strength historically a bad move.
yet..
#MONERO got delisted from #Binance ysterday
Whilst #ZEC has passed their compliance review --- coincidence???
Laughable stuff !!!
But what can we do.
Make some "money" on ZEC
whilst using XMR
if you are that way inclined.
Target 1 seems reasonable this year
Target 2 in 2025 sure why not
and anything beyond from these levels
and still are holding well done to you.

XAUUSD Long: Demand Line Supporting Move Toward $4,080 TargetHello traders! Gold (XAUUSD) continues to show resilience as price action holds above the key $3,950 Demand Zone, signaling that buyers are still defending this area effectively. After forming a Double Top pattern near the $4,150 Resistance, the market entered a correction phase, which was guided by a clean break below the neckline, followed by a retracement defined by the Fibonacci Arc. This retracement created a series of Pivot Points that now serve as short-term references for buyers and sellers. The price has since found solid support along the Demand Line, aligning with the overall ascending Trend Line that has held firm since early October. Each rejection from this zone has been met with renewed buying pressure, suggesting that the current move could represent a continuation phase within the larger bullish structure.
Currently, gold is trading around the $4,000 level, consolidating just above its Demand Line. If bullish momentum accelerates from this area, we could see a push toward the $4,080 short-term target, followed by a possible test of the $4,150 major resistance — a critical level for confirming a broader breakout.
My base scenario anticipates a gradual upward move toward $4,080, which aligns with both the trend and key resistance confluence. A clean breakout above $4,150 would open the path for a stronger bullish continuation, potentially toward $4,200+. However, a confirmed breakdown below $3,950 could shift short-term sentiment to bearish, exposing the next support area near $3,900. For now, I maintain a bullish bias, expecting further upside momentum as long as the demand structure holds firm. Manage your risk.

$HBAR 1DCRYPTOCAP:HBAR Technical Outlook (1H & 1D)
On both the 1H and 1D charts, CRYPTOCAP:HBAR has confirmed a Double Bottom pattern around the 0.155–0.16 support level, followed by a strong breakout above the neckline.
Price is now retesting the FVG 1H / 1D support zone ($0.19) — a healthy retracement that could serve as a base for continuation.
As long as price holds above this support, the structure remains bullish, with potential targets at T1: $0.218, T2: $0.23, T3: $0.245, and T4: $0.255.
Momentum indicators show a brief cooldown after the breakout, which often signals a re-accumulation phase before the next leg up.
Invalidation would occur if price closes below the $0.185 area.

$XPL - #PlasmaAMEX:XPL showing a potential double bottom pattern on the 1H chart.
Price just bounced from key support and is testing the neckline resistance.
A confirmed breakout could send it toward T1–T3 levels +14%.
Watching for volume confirmation and retest at the breakout point.
#XPL #Crypto #Trading #YodaXCalls

SOL 4H CRYPTOCAP:SOL 4H Chart
Solana forming a clear Double Bottom pattern signaling a potential trend reversal after the recent pullback.
Price is testing the neckline resistance, and a breakout above could confirm bullish continuation toward the projected target zone.
If confirmed, this setup suggests strong bullish momentum building for $SOL.
#SOL #Solana #Crypto #PriceAction #TradingView
BITCOIN (BTC/USD): Can 100K Support Hold - A Pullback in SightBitcoin may experience a rebound from a significant daily historical support level.
Following its test, the price formed a double bottom pattern on an hourly timeframe and has successfully broken above its neckline.
I anticipate a bullish movement towards 104,000.

GBPCHF Fall/Rise?GBPCHF is back down near one if it's lowest points and close to a SUPPORT area. Possible reversal getting into London Session after confirmation.

CHFJPY - Bearish Double TOPHello traders,
The CHFJPY has formed a Double Top pattern, and the neckline has been broken, confirming bearish momentum! 📉
This indicates a potential continuation to the downside.
🎯 Target : 189.405

$DASHNASDAQ:DASH 30m Chart — Bearish Reversal Pattern
Price has formed a Double Top structure near the $150 zone — showing strong rejection at resistance.
Now breaking below the neckline, confirming potential short momentum.
Technical View:
Structure: Double Top
Confirmation: Neckline Break
Bias: Bearish → Possible continuation toward lower supports ($100–$90 area)
Clean breakdown setup if selling pressure continues.
#DASH #Crypto #Trading #YodaXCalls

USD/JPY📊 Technical Analysis
Trend: The overall daily and weekly trend remains "bullish".
Structure: A rejection at 154 suggests sellers defending that area.
Liquidity zone: 153.00 aligns with previous demand, Fibonacci 38–50 % retracement, and EMA support — a likely area for buyers to reload.
Pattern: Double-top → short-term correction → continuation pattern.
✅ Bearish pullback: Price rejects 154 → retraces to 153 (liquidity sweep) → resumes uptrend | Bearish rejection candle on 4H or daily.
❌ Invalidation / breakout: Price breaks and closes above 154.30 with strong volume Continuation straight to 155–156 without retrace.
> The USD/JPY may be setting up for a short-term correction from 154.00 toward 153.00 to gather liquidity before continuing higher in line with the long-term bullish trend.

USDCAD: Time For Correction 🇺🇸🇨🇦
There is a high chance that USDCAD will continue retracing
from the underlined blue resistance.
The price formed a double top pattern on that and violated
a support line of a rising channel with a bearish imbalance candle
after its test.
I will expect a down movement to 1.4047
❤️Please, support my work with like, thank you!❤️
I am part of Trade Nation's Influencer program and receive a monthly fee for using their TradingView charts in my analysis.

Bitcoin looking bearish in the short termBTC is still in the long-term bullish. But in the short term, it has formed a double top and is currently at an area of interest, the point where it could break the neckline of this double top downwards. It has also begun forming what could be the descending channel that drives this bearish move. If the breakout below the neckline does happen, it'll likely move toward the 90k area, which coincidentally also happens to be where a fair value gap is currently waiting to be filled on a 4H. At this point, it would've broken out of the long-term bullish ascending channel and will likely form a structure that suggests reversal of the short-term bearish move, back into the channel to continue the longer-term bullish trend.
What do you think? Let me know in the comments.

BCHUSDT- Bears Taking Control? Massive Downside Move Loading!Yello Paradisers, BCHUSDT is showing signs of a potential bearish move as it has displayed a bearish CHoCH with bearish divergence on MACD histogram after an accumulation and manipulation phase, which increases the probability of a downside move.
💎 For entries, we can expect a rejection from the FVG zone and target the liquidity levels below. Safe traders can wait for a bearish candlestick pattern confirmation around the FVG area before entering to ensure a higher probability setup.
💎 However, if the price breaks out and closes a candle above the invalidation level, it will invalidate our entire bearish idea.
💎In that case, it would be better to wait for more favorable price action to form before taking any positions.
🎖Strive for consistency, not quick profits. Treat the market as a businessman, not as a gambler.
MyCryptoParadise
iFeel the success🌴

EURCAD: Consolidation Trading 🇪🇺🇨🇦
EURCAD is trading in a horizontal range.
The price has just tested its support.
There is a high chance that the price will bounce from that
and reach a resistance of the range soon.
Goal - 1.621
❤️Please, support my work with like, thank you!❤️
I am part of Trade Nation's Influencer program and receive a monthly fee for using their TradingView charts in my analysis.
