My trend line analysis.The market is currently in a clear bullish trend, forming consistent higher highs and higher lows. I’ve drawn trendlines to highlight the ongoing upward movement and key support areas that have been respected so far.
When the market approaches a possible reversal point, I prepare in advance by marking the trendline at that zone. My method is simple: I use the high or low of the last two reversal candles to draw the new trendline.
Look closely at the last two candles near each turning point — their highs or lows reveal where the trendline should be placed. This helps visualize where momentum might shift and where a potential reversal could start.
For now, the overall bias remains bullish until the price structure breaks this pattern. I’ll continue watching how price reacts near these trendlines to confirm any changes in direction.
This analysis is for educational purposes only, not financial advice.
Double Top or Bottom

Buy order GBPUSD at support buy order at old support risking 40 pips for 90 pips, RR:2,25
I am puttig in 2 orders half the size of a normal trade, one for each take profit (90 & 170).
best case scenario the trade will give 130 points (as they are two half positions of 90 & 170 respectively)

USDJPY | Double Top Near 154.00 Ahead of BoJ Markets opened cautiously with the dollar softer, as traders await a heavy data week and the upcoming Bank of Japan meeting. Verbal intervention from Japanese officials gave the yen a short-lived lift, though markets remain skeptical of actual follow-through.
Technical Lens:
USDJPY has printed a double top near 154.00, signaling potential exhaustion within the broader ascending channel. Momentum is fading near the upper boundary, with the 150.00–147.00 zone standing out as a major support area aligning with prior consolidation.
Scenarios:
If 154.00 holds as resistance → scope for a deeper pullback toward 150.00–147.00.
If price reclaims 154.00 → continuation within the channel, targeting new highs.
Catalysts:
BoJ policy meeting (Thursday) – markets price ~38% chance of a December hike.
U.S. data releases could influence dollar direction and short-term flows.
Takeaway:
Watch 154.00 as the ceiling and 150.00–147.00 as the defense zone into BoJ week.

USDJPY: Resistance Area Respected!, Sell Moment.The pair has fulfilled my previous analysis by reversing below the anticipated resistance, as we can plainly spot in the structure. presently the price is on momentum short, heading down towards the next partial support at 149.43.
Also the Double Top chat pattern is forming gradually, showing more opportunity of bearish.
Key points;
A breakdown below the 149.43 would be aiming 146.60 as the next following target.
Follow up and thanks for reading.

TTD (swingtrade) Earning plays, waiting for pullbacki have 2 option to entry TTD.
this set up to get entry when ttd earning.
BTCUSD – Multi-Timeframe Breakout Setup (Daily Confirmation + 4H🧠 Analysis:
BTC has confirmed a clear breakout on the Daily timeframe after multiple rejections within the descending channel.
The structure has shifted from lower highs to higher highs, indicating that bullish momentum is returning to the market.
This daily breakout is supported by strong momentum and a clean structure, suggesting that the move could extend into a larger swing setup.
On the 4H chart, BTC has formed a double bottom and successfully broken above the previous daily supply zone.
This provides a powerful confirmation of strength and marks the beginning of a potential continuation phase.
The 4H structure also shows a possible retest forming — which aligns perfectly with the daily breakout scenario.
On the 1H timeframe, we are currently observing the retest area in real time.
A 1H candle close above the 113.9K–114K zone would confirm continuation to the upside.
Momentum remains bullish, and there’s strong confluence between all three timeframes (D1, 4H, 1H).
🎯 Setup:
Entry: Waiting for 1H candle close above 113.9K–114.0K
Stop Loss: 112.8K (below structure)
Take Profit 1: 117K – 117.5K
Take Profit 2: 124K (or continuation if momentum remains strong)
📌 Notes:
The first target aligns with the next major resistance zone on 4H, while the second target corresponds to the higher-timeframe liquidity zone from previous swing highs.
As long as BTC holds above 113.8K, the bullish bias remains valid.
If price dips below 113.5K with strong bearish volume, the setup becomes invalidated and will require reassessment.

ZCASH 1HZCASH / USDT – 1H Analysis
ZEC is forming a Double Top pattern with strong resistance around the $355–360 zone.
After breaking below the neckline and confirming a potential retest, price could continue to drop toward the FVG 4H zone ($320–330) and possibly extend lower to the FVG 1H zone ($275–285).
Key insights:
Bearish structure confirmed after failing to reclaim resistance
MACD showing weakening momentum
Short-term targets: $320 → $280
If price reclaims $360+, the bearish scenario may be invalidated.
#YodaXCalls

NAS100 – Technical Analysis | Bulls Take ChargeNAS100 extended its bullish rally after breaking above 25,190.00 and 25,600.00, confirming strong buyer control. The index continues to print higher highs, with momentum favoring further upside as long as price remains above the breakout zone.
Support at: 25,600.00 🔽 / 25,190.00 🔽 / 25,000.00 🔽
Resistance at: 25,900.00 🔼 / 26,000.00 🔼
🔎 Bias:
🔼 Bullish: Sustained trading above 25,600.00 supports continuation toward 25,900.00 and possibly 26,000.00.
🔽 Bearish: A drop back below 25,190.00 could trigger a correction toward 25,000.00.
📛 Disclaimer: This is not financial advice. Trade at your own risk.

USDCAD Multiple-Top Rejections Bearish PressureThose multiple top rejections are signalling that pressure is still to the downside. This is just like trading a double top or triple top pattern, except now we have a multi-top rejection pattern.
The bears are strong in this market.

BTCUSDT: Price Processed To Break The Resistance..?Hi traders, what is your opinion at this point..?
BTCUSDT has successfully fulfilled my previous idea on weekend by rising towards $116K, as seen in the structure. the price is currently at the resistance level, which there is possibility of breakout aiming $118K and above as next potential targets.
Possible Outline;
A clear breakout confirmation above the resistance zone, would set off bullish persistence.
Meanwhile a reversal below this area would activate a downward signal.
Follow up for more update
Happy trading week.

BTCUSD – Liquidity Sweep into a Key Breaker Block Bitcoin has made a strong bullish push, but look closely — price just tapped into a **major breaker block zone** around **$116K**, the same area that triggered the last heavy sell-off.
This move appears to be a **classic liquidity sweep**, grabbing buy-side liquidity resting above previous highs before showing signs of exhaustion. Smart money may be using this area to fill short positions.
📊 **Technical Breakdown:**
* **Liquidity Sweep:** Price took out the highs before reacting.
* **Breaker Block:** The last bullish candle before the strong drop now acts as resistance.
* **Market Structure:** BTC is still in a **bearish structure**, and this recent rally looks like a retracement into the **premium zone**.
* **Imbalance Below:** A clean imbalance is left open toward the **$112K–$111K** area — a possible magnet for price.
📍 **Key Zones:**
* **Supply Zone:** $116,000–$116,700
* **Target:** $112,000 → $111,700
* **Invalidation:** A clean breakout above $116,800
🧩 **Bias:** Short-term bearish while below $116,800 — expecting a potential correction as price reacts off the breaker block.

BUY USDCAD at supportTrading range forming in USDCAD after solid bull move. Buying at support (or at the bottom of the trading range) for a 1:4 RR

BTC to 92-96k before next run2 same pattern in the past with 2 tops and correction. Same 2 tops we just had. Drop by Fibo to 0.5-0.6 is expected


EURGBP Bullish Breakout.- Price is in strong (MN,W1,D1) uptrend making new higher highs and higher lows.
- In the Weekly Charts we had huge bullish engulfing close that engulfed the previous 3 bearish candles.
- In the Daily Charts price formed new higher low & double bottom at (0.86795 - 0.86560), Price broke thru the double bottom neckline which is also the top of range at (0.87255 -0.87144).
Now we wait patiently for price to retest our Zone at (0.87255 -0.87144) for bullish Entries.

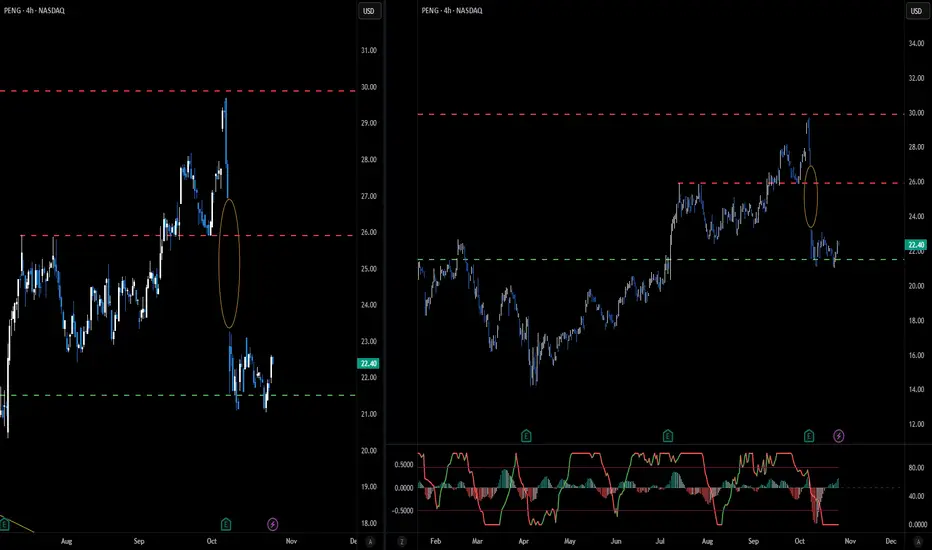
PENG will fill the gap?Bounced from strongest support and will fill the gap. First target 25,2 second 29,7. MACD daily also on the edge of pozitif.
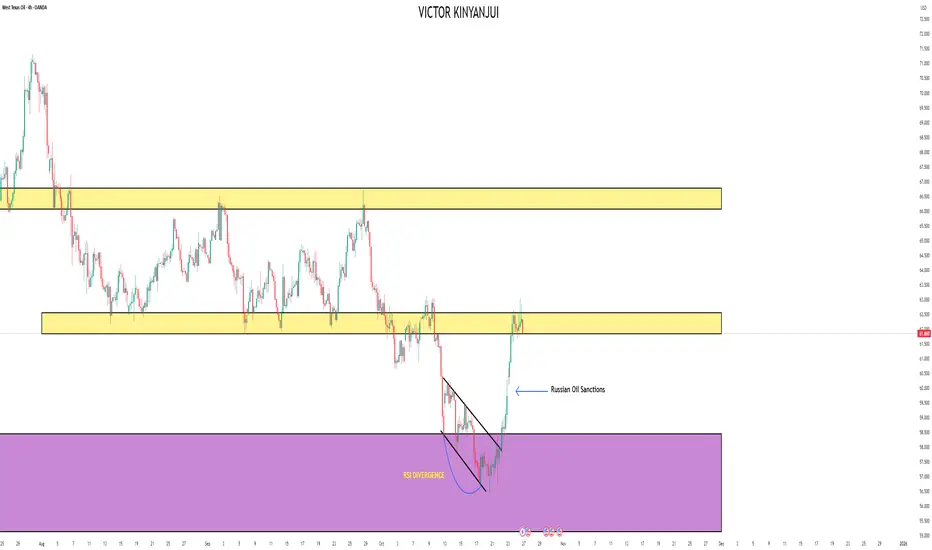
USOIL Double Top at Support Level Turned Resistance Zone.Price bounce back from a major Monthly support Level at (58.450 - 55.130), price rallied strongly to the next support level turned resistance at (62.550 - 61.835) and was strongly rejected with a double top followed by bearish engulfing candle presenting a good follow through selling the coming week.
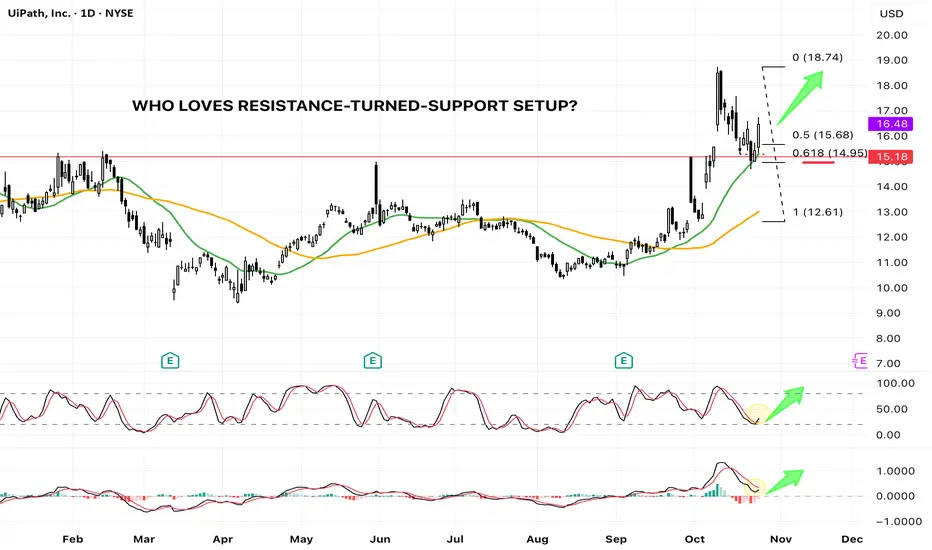
PATH - Textbook R/S Flip at Key Fib & MA Support (Bullish Setup)UiPath ( NYSE:PATH ) spent the majority of 2025 range-bound, oscillating between the $10 and $15 marks. This consolidation phase ended dramatically in early October, when the price decisively breached the long-standing 2025 horizontal resistance at approximately $15.
The breakout led to a swift rally, tagging a new year-to-date high of $18.74 . Following this strong move, the stock began a healthy retracement, pulling back to test the very level that had previously acted as resistance—the classic Resistance-Turned-Support (R/S Flip) setup.
The Confluence of Support
This current pullback is resting on a powerful confluence of technical supports, significantly increasing the probability of a bullish continuation:
1. Horizontal Support: The previous major resistance line (around $15) now acts as a crucial horizontal support.
2. Moving Average Support: The price is testing the 20-day Simple Moving Average (SMA 20, Green Line) . Importantly, this is the first time the price has pulled back to the SMA 20 since the bullish SMA 20/SMA 50 Golden Cross , signaling a strong trend retest.
3. Fibonacci Golden Pocket: The retracement has landed perfectly into the 0.618 Fibonacci Retracement level (from the $12.61 swing low to the $18.74 swing high), a statistically significant reversal zone often called the "Golden Ratio."
Momentum Indicators Confirm Bullish Bias
Beyond the price action, our auxiliary indicators are flashing constructive signals:
* Stochastic: The Stochastic oscillator is reversing from the oversold territory and is showing a clear bullish cross , indicating waning selling pressure and the start of a new upward momentum cycle.
* MACD: The Moving Average Convergence Divergence (MACD) indicator is attempting a bullish cross above the zero line , a powerful sign of increasing positive momentum.
Conclusion
The confluence of price action and indicator signals presents a high-probability bullish setup. The market is currently rewarding the successful test of the R/S flip at the 0.618 Fib and SMA 20 support.
While this setup suggests a strong likelihood for the next leg higher, traders must remember that trading involves probabilities. A clearly defined stop-loss is essential to manage risk should the market invalidate this robust support zone.
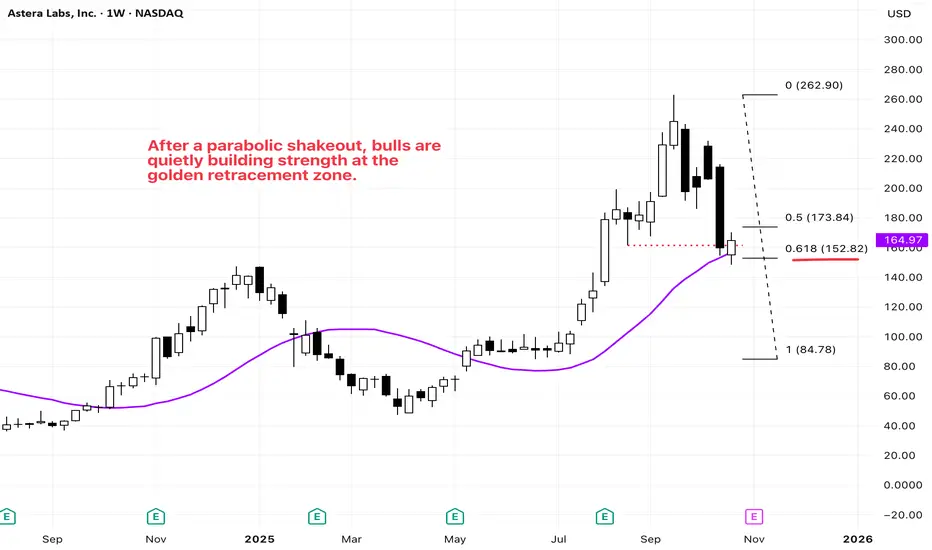
NASDAQ: ALAB — Holding the Golden Zone After a Parabolic DropALAB shows a structure similar to RDDT(see my previous idea) — a newly listed growth stock that gained strong momentum after breaking above its weekly SMA 20 in mid-May.
After reaching an all-time high, the stock started to pull back in late September.
Recently, a sharp parabolic drop drove the price down toward a confluence of supports:
* the previous swing low around $160(red dotted line),
* the weekly SMA 20 (purple),
* and the Fibonacci 0.618 retracement level of the recent rally.
This week’s candle closed bullishly, reclaiming the $160 area and confirming strong demand at this golden zone. The sharp sell-off likely flushed out retail stop orders, providing the base for a potential next leg up.
Overall, this area offers an attractive risk-to-reward setup, with technical supports aligning across multiple timeframes.
NYSE: RDDT Weekly – A Classic 0.618 Pullback in PlayRDDT has been trending higher since April, and its uptrend gained momentum after breaking above the 20-week SMA in mid-June.
The stock saw some pullback in mid-September, retesting the previous swing low around 205 (red dotted line), which also lines up with the rising trendline (green) and the 20-week SMA (purple) — right near the key Fibonacci 0.618 level.
This week, price bounced from that confluence zone and closed with a bullish candle, reclaiming the previous low. The move looks like a possible stop-hunt before the next leg higher, showing that buyers are defending this key support area.

POTEND LONG TERM SELL OF EURCADIf my trendline analysis hold, EURCAD might have just begone a downtrend. Market must lead and we follow

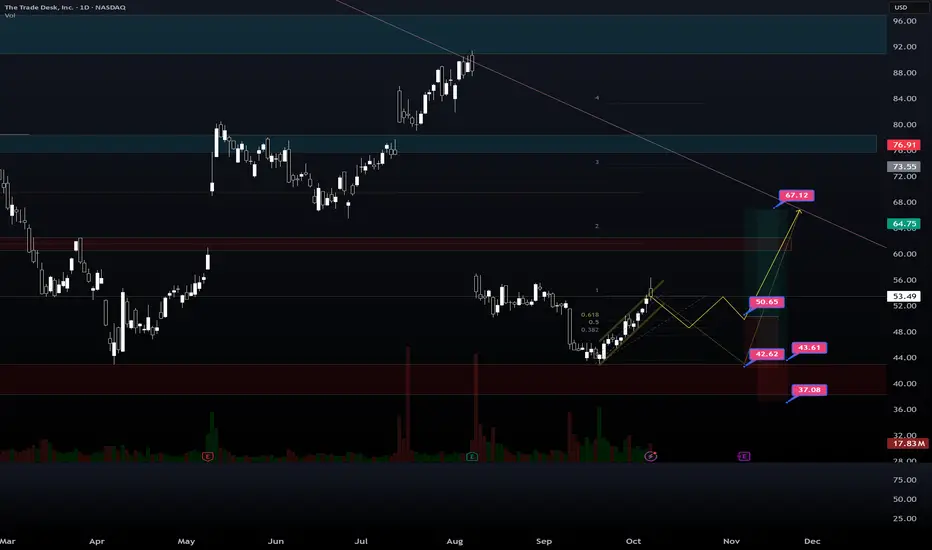
Double bottom exactly fits for TTDThe double bottom pattern fits for TTD and first resistance 66 and then first target 90. Then story continues for double bottom target of 140 which is exactly same for double top. But remember, there is a big order block at the red area. So , it would take time to reach double bottom target.

Could Gold Recover After Yesterday's CrashGold saw its biggest single-day drop since the infamous 2013 crash. Back then, I was inexperienced, but with some luck and perhaps a bit of reckless bravery, I managed to secure a tidy profit. Unfortunately, my more experienced self missed most of yesterday’s move :)
Now that gold has reached the double-top target near 4000, a short-term bounce could be on the way. However, volatility remains high, making gold a risky trade at the moment.
My plan is to enter around current levels, targeting a recovery toward the 61.8% retracement of the recent drop. It’s a calculated gamble, but the risk-reward ratio looks acceptable, at least for me.
