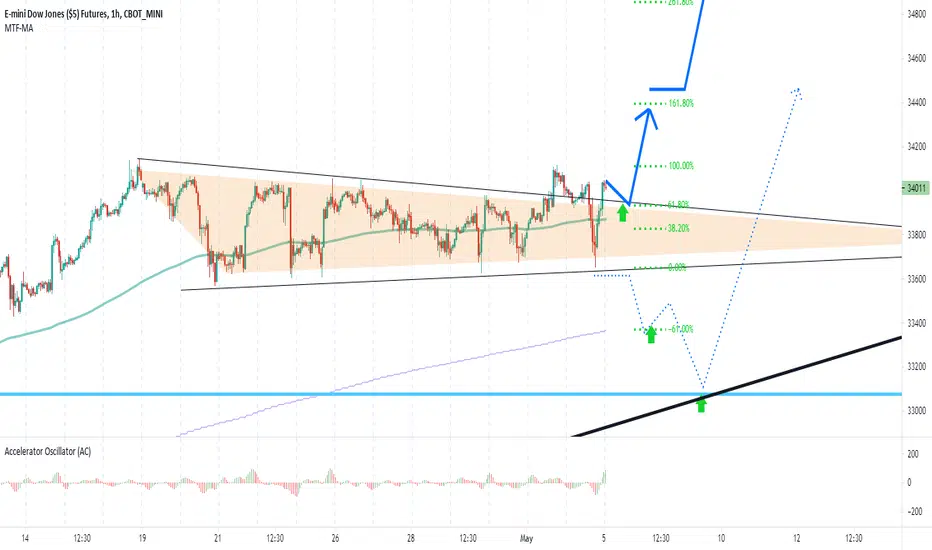
we bet ,time to sell dow and wait 8 day NFP unemployment 6.1% news comes very very bad , in comming week it will push down market,dow,dax,sp500
if you draw trend base FIBO extention(projection) on last N shape,you will see it reach level 161%(most important level on fibo extention)
we advice for next 10 day =looking for sell but put SL=100point,if you eat 2-3 SL dont fear ,continiue looking for sell ,after go 100 point to profit,move sl to open price,shot down platform ,then 4-5 day go and rest ,give time to it go down)
www.marketwatch.com
Dow30

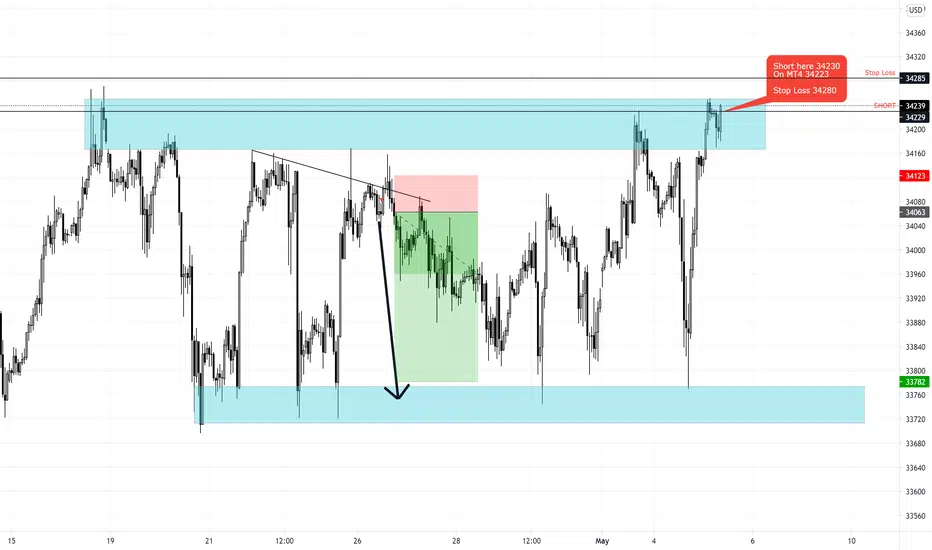
Time to Sell Short the DOW30? (Again) Short here 34230
On MT4 34223
Stop Loss 34280
I have been selling the dow range highs over the last 2 weeks.
Why not do it again?
Is DowJones Futures ready to move to newer high?So far Dow Jones Industrial Average is showing strength while Nasdaq showing weakness. Similar to what happened during February. Dow futures have been in tight range since last two weeks, maybe this week it is ready to breakout?

ALERT=WE PREDICT DOW =35000for next days target 1=34400
looking for buy ,dont open sell ,dow in way to 40.000 very exclent company earnings give is super energy +
for next days we advice = dow is full , looking for buy on gold and germany index dax ,both in + trend ,can grow above 20%
FDAX1!
GC1!
3angel on dow on daily,weekly chart , dow buyer target is 37000 !!!!
but for comming weeks it can touch important place then start new + trend
if you have old sells, must put TP for them on 33150 and buylimit there
Advice= dow dax nasdaq sp500 manner is + up trend ,if they go 100 point down,300 point back to up true?, see weekly chart exactly ,for this big banks,fund trader NEVER open sell,they only looking for buy i advicd dont sell on it,stand on buy side ,looking for buy only (when it break trend,put buystop on 15min candel high, or put buystop on last high)
personaly i am pro dax trader from 2006 i recomand to my friends trade on Gold is easiest instrument ,its secret =very very trendy to up + (on it looking for buy too) before real money you need demo min 6month on it
GC1!
FX:XAUUSD

Buy Low Sell the Highs | Time to buy US30?US30 / Dow Jones 30
We are seeing a really sideway range which has pretty clear support and resistance levels.
Will it touch the support and buyers will kick in? Will see the higher levels tomorrow ?
I have a limit buy order

How To Trail Stop Loss Effectively | Capture All day's ActionMaximise your Day Trading Profits 5X | Apply this trade management system to hold trades all day without much effort
In this video I'm going to share with you a trade management idea which would allow you to trade and hold the trade from the start to the end of the day trading session.
The Chart I'm using is US30 / DOW30. The Time frame for day trading would be the five minute chart.
The idea is to make entries on the 5 minute chart and then use a few swings to add on.
This can become part of your Trade Plan and you can apply to any time frame or symbol of your choice. It's a great way to maximise your profits using nothing but the data provided by the market itself.
Price Action is surely The King!!! I bow....

US30 update33800 is an important support line for us30. If Dow breaks this area, which also means that Dow breaks Kumo cloud and we will probably see lower prices for US30.


Dow Jones: No Fooling here! 🤡🤡🤡The Dow Jones is going to experience its biggest crash in history in just about a week. No, we’re just kidding. It’s April Fool’s Day, folks! In reality, we expect the Dow to further grow and expand all the way up to regions around 34000 points. After a short correction, we are set to tackle all-time highs above that level, too.
Happy Easter Holidays!

Dow Jones US30 IdeaTarget: 34000.00
From checking all the Dow Jones stocks they remain in trend for the upside and economic recovery is still on the rise, there are a few fundamental possibilities involving the DXY that are potential red flags which could possibly effect our longterm target of 35000.00. A break below the 1 year trendline we will see how it reacts to the 0.618 fibonacci level.
DJCFD:DJI
OANDA:US30USD
CURRENCYCOM:US30
CURRENCYCOM:US30
CAPITALCOM:US30
GLOBALPRIME:US30


US30USD 2021 Feb 01 Week
OANDA:US30USD
US30USD 2021 Feb 01 Week
Green/Red zones = preferred entry area
Price returned to a previous accumulation zone.
Hasn't seen any signals to buy yet
Resistant3 = 31526
Resistant2 = 31223 - 31271
Resistant1 = 30900 - 31038
Support1 = 29796 - 29952
Support2 = 29420 - 29465
Support3 = 28668.50


US30USD 2021 Jan 25 Week
US30USD 2021 Jan 25 Week
Green/Red zones = preferred entry area
Price in rotation still.
Volume remains low for past week.
S/R remains per previous week OANDA:US30USD
Resistant3 = 31525.8
Resistant2 = 31366.5
Resistant1 = 31222 - 31271
Support1 = 30315 - 30359
Support2 = 29796 - 29952.8
Support3 = 29420 - 29465

US30 Long re-entryFirst position got stopped taking another long here aiming for same target 12:1 RR


US30 Green Lines Represent Resistances | Red Lines Represent Support Levels | Light Blue is a Pivot Point

Dow- Different story, same ideaAs SP500 and Nas100, we also have a strong recovery on Dow since March's low, but, unlike the others, the major companies index couldn't make a new all-time high( above February's high). Also, unlike the others, the recent low is a lower low, not a higher low as we see in Nas100 and SP500.
The index now is also in resistance and is contained in a descending channel.
I expect a new leg down and in the medium term Dow can reach 25000

DJI:Short, Historic "sine"More of an idea which progressed into a timeline of the market in respect to DJI. Historic indicators showing sell indicated by the trough and peak of the sine wave overlay. Historically interesting where we find the horizon or 0 point of the wave. Major transitions overlay this period as we can see the massive accumulation of debt begins to inflate the market. This economic transition is marked by the launch of Sputnik, our landing on the moon, adoption of FIAT. Many significant economic events cement the future during this time period. Coupled with the rapid growth of the FIAT backed market there is a direct correlation with the 10 year bond yield which indicates the devaluation of this standard of currency backed by speculation and debt.
The scale was personally staggering when observing as both a timeline and as an indication of market movement on massive scale.


ridethepig | Dow and Volatility into the elections and beyondThis diagram consists of my conception of the election positional play and continues into my treatment of the end-game in an economic cycle.
1️⃣ The reciprocal relationship between risk tolerance on the one hand and a contested election on the other.
As we will soon notice, my dear followers, my conception of the next few weeks and months is largely based on the knowledge which we have painstakingly collected since 2019.
2️⃣ A house of cards.
I started picking up on the alarm bells in October last year.
My VIX models were starting to warn of a +500% move towards 85.
A sweep of the lows under 12 to capitulate any soft bulls would force put covering.
This was all done in Q419 before a contraction in globalisation entered into play from Q120.
You can check for yourself here the timestamps
…and oh surprise surprise…
85 was the exact HIGH of the FIRST COVID CHAPTER.
🔑 Pay attention to what happens next
Sure the move from 12 to 85 might have been easy to spot
- We tested it to the pipette ✅
- Buyers were exhausted and found a valid place to cover ✅
I want to highlight something very important, as you have all seen the flows live in advance....Let’s go into some details and leave make the picture crystal clear:
If you are wondering how...?
First if we look vix from 85 as we originally did, we can see the October 2019 highs are open.
Obviously, these are same levels when my models began to pick up the alarm bells.
Here is where things start making sense
Been in absolutely no doubt.
The biggest sharks in the game are repositioning.
Remember, VIX ⬆️ gives us the green light to sell risk in absolute terms .
As you can all see we continued to track the flows together across other asset classes.
In this case, the move was not without venom for European Equities.
Using the 2020 map for DAX for reference:
Perpetual bonds are the Trojan horse for government defaults. Insiders know what was cooking and wanted to unwind German Equity exposure outguessing the ‘Green New Deal’.
Well we are back to square one.
Equities completing the retrace and we are set for Covid Chapter Two.
Professional portfolios are going to come under severe stress in the coming weeks, even the most advanced players will be tested to their limits as they all have the same ingredients.
