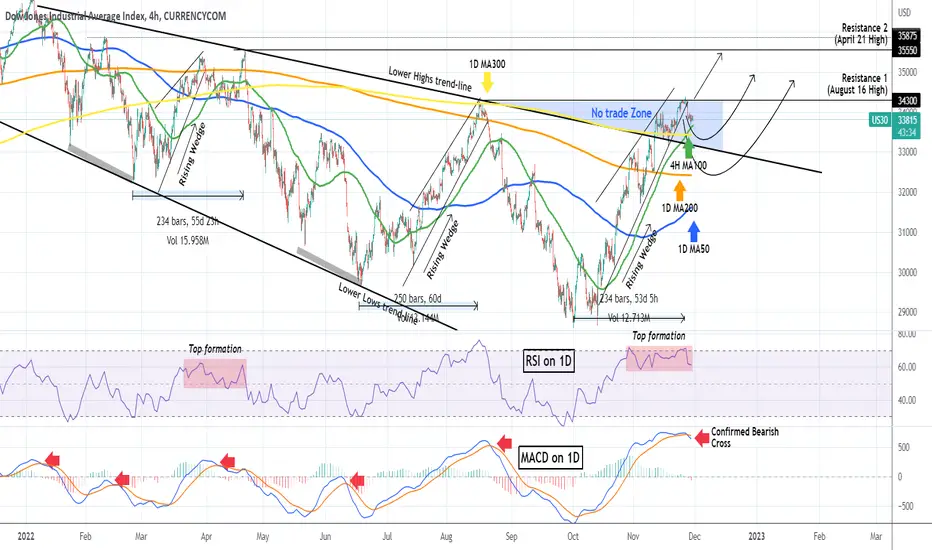
DOW JONES most likely topped at least short-termIt has been almost 6 weeks since Dow Jones (DJI) broke above the top (Lower Highs trend-line) of the Bearish Megaphone pattern that it has been trading in since the start of the year and the beginning of the 2022 correction. At the same time it broke above the 1D MA300 (yellow trend-line), which as we've mentioned numerous times was the barrier for a long-term bullish trend restoration:
As the price was basically rejected on the 34300 Resistance 1 (August 16 High), we can argue that the October - November rally has come to an end, with the price breaking below the Rising Wedge, while also the MACD on the 1D time-frame completed a Bearish Cross (red arrows). Unlike the previous counter trend rallies within the Bearish Megaphone, this time we may have the luxury to expect only a short-term pull-back, and not a new long-term selling sequence to a new market low.
As you see, we were correct for calling the area within the 34300 Resistance and the top (Lower Highs trend-line) of the former Bearish Megaphone, a 'No trade Zone'. A potential Support (and bounce point) can be that Lower Highs trend-line itself and if broken, the 1D MA50 (blue trend-line), which is traditionally the first Support during long-term uptrends. All this of course, assuming that the 4H MA100 (green trend-line), which is supporting now, breaks. If not, we can see one last attempt to break and close above Resistance 1 (34300) and target Resistance 2 (35550).
On a side note, see how the 1D RSI has been printing a Top formation similar to late March - early April. Also the November 25 top came exactly 234 days after the October 02 Low, which is symmetrical to February - April.
-------------------------------------------------------------------------------
** Please LIKE 👍, SUBSCRIBE ✅, SHARE 🙌 and COMMENT ✍ if you enjoy this idea! Also share your ideas and charts in the comments section below! This is best way to keep it relevant, support me, keep the content here free and allow the idea to reach as many people as possible. **
-------------------------------------------------------------------------------
You may also TELL ME 🙋♀️🙋♂️ in the comments section which symbol you want me to analyze next and on which time-frame. The one with the most posts will be published tomorrow! 👏🎁
-------------------------------------------------------------------------------
💸💸💸💸💸💸
👇 👇 👇 👇 👇 👇
Dow30
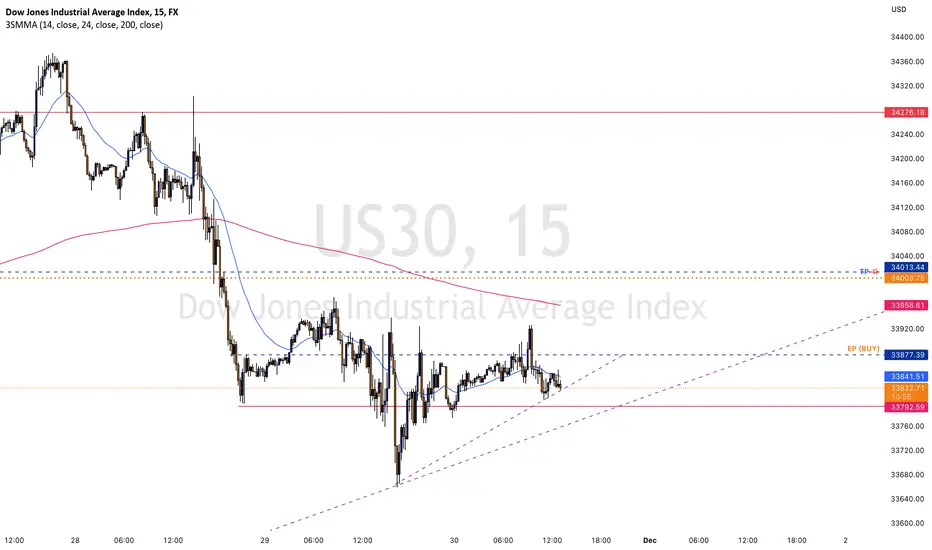
US30 (High Probability BUY Setup SOON)!!!!
Here we can see clearly the next move for Dow30, By forming Inverse Head & Shoulder Reversal Pattern (W), Buying pressure from 33631 resulted in all the initial selloff being recaptured, An overnight negative theme in Equities has led to a lower open this morning, A break of bespoke support at 33650, & the move lower is already underway,
We're using M15 timeframe for a clearer view of our analysis, nothing more, therefore we can't predict exact timeframe our analysis going to happen,
We've got our EP (blue lines) & our TP (golden lines),
Keep a close eye on U.S. indices today as it's full of fundamental news, especially with Fed Chair Powell Speaks at 6:30 (GMT + 00:00 London),
HAPPY PIP HUNTING TRADERS.
FXKIllA.
US30, TP HIT!!!Here we can see clearly our previous analysis went exactly as we predicted & published on trading view, well done to whoever took the trade with us, happy pip hunting traders.

US30USD YM1! DOW 2022 NOV 28
US30USD YM1! DOW 2022 NOV 28
Scenario1 continuation long was in place from Nov 07's analysis.
Weakness are appearing on all timeframes. Tighten stops on
long positions. Volume was thin due to US holidays. Expected
to remain thin as year end approaches.
Possible scenarios:
1) Temporary short if 34246-33800 is rejected
2) Stay out of market since volume is thin
3) Continuation long if 34246-33800 is supported
Price reaction levels
Short on Test and Reject | Long on Test and Accept
35750 35330 34246-33800
33106 31793
30513 28635
Weekly: ND on uptrend = minor weakenss
Daily: Declining volume + narrow spreads = weakness
H4: Supply observed
Remember to like and follow if you find this useful.
Have a profitable week ahead.

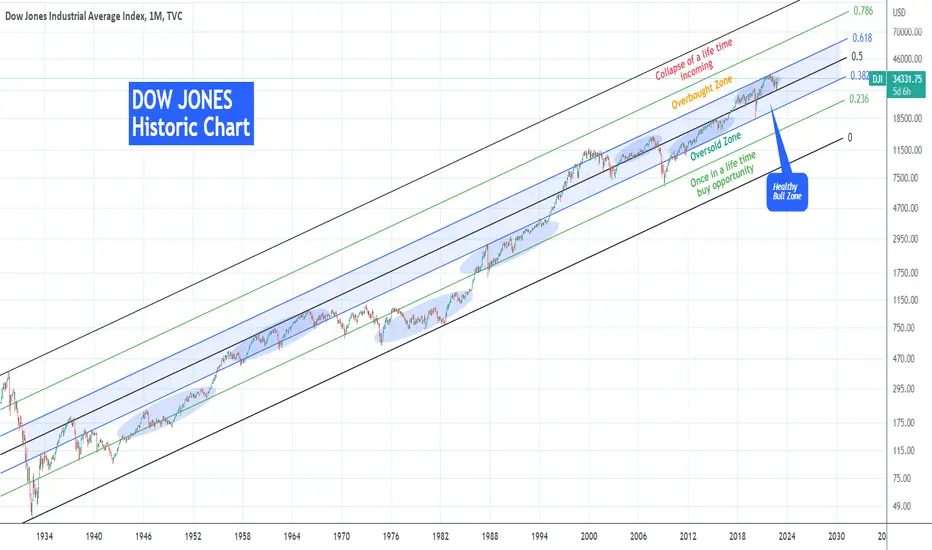
DOW JONES doing what it has always done through history. Rising.This is the Dow Jones Industrial Average Index (DJI) on the log scale since the great depression of the 1930s. A lot of talk is being done lately on whether or not this recent rally is sustainable, or if the high inflation can cause a deeper correction etc. In order to put things into perspective it is always useful to look into the longer term charts, preferably on a multi-year horizon.
This is on the 1M (monthly) time-frame where we've applied the Fibonacci Channel and its retracement levels on this 90 year price action. It is easy to realize that the Fibonacci levels have historically created zones of Support and Resistance. Right now, and despite the 2022 correction (Bear Market), Dow is within the 0.5 - 0.618 Fib, which is part of the larger 0.382 - 0.618 Fib Zone, which we call "Healthy Bull Zone" as when the index stays within it, it tends to rise on healthy growth levels.
To make things more interesting, Dow's early January top (All Time High) and subsequent rejection was made exactly on the 0.618 Fib. It shouldn't be a surprise that the recent October low and the subsequent rebound was made on the 0.5 Fib. This is a Support trend-line that 2017 only broke once during the 2020 COVID crash (which remarkably touched the 0.382 Fib and rebounded). In this 5 years Dow has been rising sustainably within this tight top half of the Healthy Bull Zone.
In fact, when the index trades within two levels tightly, it tends to do so for a very long time. Such periods are indicated by the blue ellipse patterns and besides the 2017 - 2022 one, we can see another 6 major periods.
As a result we can argue that right now Dow Jones is doing "what it always done through history" and that is rise sustainably within a tight Fibonacci zone long-term. This makes the index as bullish as it ever was.
Some added facts on this Channel. As you see we've categorized the zones based on the likely outcome they can provide. Next to the Healthy Bull Zone we see the Oversold (0.382 - 0.236 Fib) and Overbought (0.618 - 0.786 Fib) Zones, which is where the index presents a rare buy and sell opportunity respectively. In fact the 2008 Housing Crisis put us in an oversold position most recently and before that it was the 1987 Black Monday event. At the top of the Channel we have the 0.786 - 1.0 Fib 'Collapse Zone', where a mega collapse event is likely, and the index has only been there at the height of trading before the Great Depression. At the bottom of the Channel we have the 0.236 - 0.0 Fib 'Once in a life time buy opportunity Zone', which as you can imagine is the extremely oversold region where Dow has historically been the most attractive level to buy. The very bottom (March 2009) of the Housing Crisis marginally pierced through and before that (again marginally) the 1987 Black Monday.
** It is worth noting that from 1974 to 1986, the market traded almost entirely within this extremely oversold Fib zone. It was when the U.S. were ravaged by extremely high inflation levels (aftermath of the Vietnam war among others), with many sceptics today comparing the present day to that era.
-------------------------------------------------------------------------------
** Please LIKE 👍, SUBSCRIBE ✅, SHARE 🙌 and COMMENT ✍ if you enjoy this idea! Also share your ideas and charts in the comments section below! This is best way to keep it relevant, support me, keep the content here free and allow the idea to reach as many people as possible. **
-------------------------------------------------------------------------------
You may also TELL ME 🙋♀️🙋♂️ in the comments section which symbol you want me to analyze next and on which time-frame. The one with the most posts will be published tomorrow! 👏🎁
-------------------------------------------------------------------------------
👇 👇 👇 👇 👇 👇
💸💸💸💸💸💸
👇 👇 👇 👇 👇 👇
DOW JONES Holding the 1W MA50 could repeat the 2016/17 rally!This is the price action of the Dow Jones Industrial Average Index (DJI) since the 2008/09 Bear Cycle of the Housing Crisis. On the log 1W chart, we can fit it within a Channel Up pattern, with the January 2022 top as its latest Higher High. As you see there is considerable room to fall and touch the bottom (Higher Lows trend-line) of the Channel Up but on the Sep 26 - Oct 10 1W candles, the 1W MA200 (orange trend-line) acted as Support and pushed the price back above the 1W MA50 (blue trend-line).
It is important to mention that while the candle action was on Lower Lows, the 1W RSI was on Higher Lows, i.e. on a Bullish Divergence. The last time we had all this conditions fulfilled together, was during the August 2015 - February 2016 correction. As you see, the RSI was on Higher Lows while the price Double Bottomed, found Support on the 1W MA200 and rebounded back above the 1W MA50. The 1W MA50 then turned into a Support and never broke and that gave way to the very strong 2016/17 rally.
You can see that its bars pattern fractal (black) fits almost perfectly on the late 2021/2022 price action. As a result, we could expect a gradual recovery into a strong rally in Q3 2023, especially if the 1W MA50 holds as a Support. If not, the 2022 Channel Down (red) can give more Lower Lows until Dow hits the bottom of its 14 year old Channel Up.
-------------------------------------------------------------------------------
** Please LIKE 👍, SUBSCRIBE ✅, SHARE 🙌 and COMMENT ✍ if you enjoy this idea! Also share your ideas and charts in the comments section below! This is best way to keep it relevant, support me, keep the content here free and allow the idea to reach as many people as possible. **
-------------------------------------------------------------------------------
You may also TELL ME 🙋♀️🙋♂️ in the comments section which symbol you want me to analyze next and on which time-frame. The one with the most posts will be published tomorrow! 👏🎁
-------------------------------------------------------------------------------
👇 👇 👇 👇 👇 👇
💸💸💸💸💸💸
👇 👇 👇 👇 👇 👇

dow 4 hour : are you ready for sell ?wait pinbar come on 1hour or 4hour or daily candel then sell with sl on pinbar high
good luck

US30 (High Probability SELL Setup Soon)Here we can see clearly the next move for US30 today, with High Impact Fundamental News is due to be out today 2:00 pm (+00:00,BST), we can see High Probability of a Down move today,
Keep a close eye on US30
Happy pip hunting traders.

Dow Jones 30 Index: Trending higherCurrent price seems to continue to push above the mid-September highs with further short term (5-25 days) upside potential spotted near 33,785 ( 61.8% retracement from the 52 week low) long positions could be technically supported provided price hold above the 32,135 support, otherwise a break below support opens up the prospects for a test of 31,275 (38.2% retracement from the 4 week high)
Upcoming key economic events:
Wednesday November 02 2022 - United States Fed (FED) interest rate decision
Thursday November 03 2022 - Bank of England (BoE) and Norges Bank (Norway) interest rate decisions
Friday November 04 2022- United States monthly non-farm payrolls (NFP)
Not investment advice. Past performance is not indicative of future results.

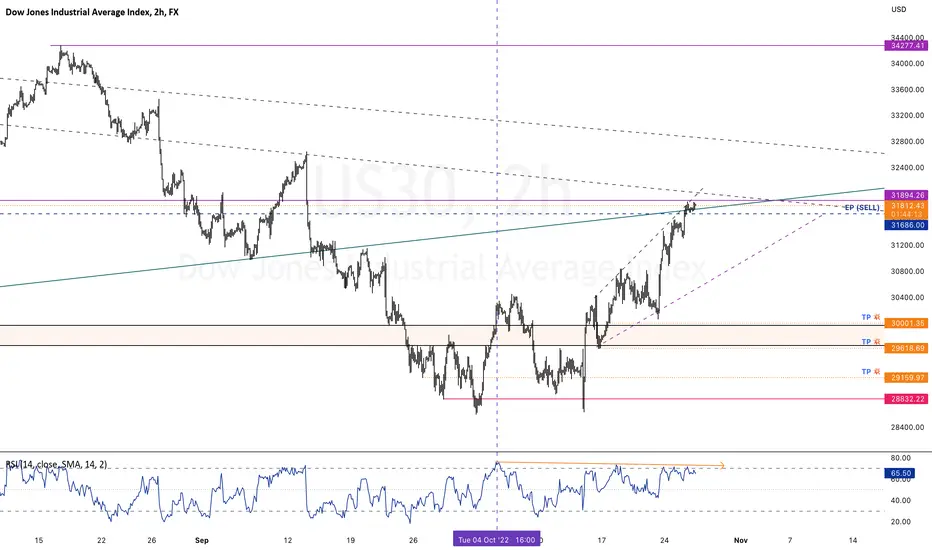
US30 (High Probability SELL Setup Soon)Here we can see clearly the next move for US30,
* Prices have continued the bullish move higher & resulted in 3 consecutive positive days.
* This has resulted in signals for sentiment being at overbought extremes & we look for a move to the downside.
* A lower correction is expected.
* A break of 31690 bis needed to confirm follow through negative momentum.
* We got our EP (blue line) & our TP's (golden lines).
* Keep a close eye on US30 today,
* Happy pip hunting traders
big short is coming and nobody knowsI am very much concern about the credit suisse's debt problem.
I believed that market has bottoomed but it seems like another one more crash is waiting for us.
This bearish trend is indicating that lower volume.
Not many investors can created remarkable volume.
So stock isn't cheap yet.

Dow Jones: Bullish Engulfing Breaks Trendline ResistanceThe Dow Jones Industrial Average has the September high in focus after a Bullish Engulfing candlestick pierced prompted prices to pierce above trendline resistance. An advancing RSI suggests healthy momentum, putting a bullish lean on upcoming price action.

S&P 500 - BROKEN RESISTANCE LINE 🚀The S&P500 price breaks the Resistance Line & Retested 🧐
the old Resistance Line becomes new support line 🔥
so, i predict a bullish move 🚀
TARGET: 3790.86 🎯
...
if you agreed with this IDEA, please leave a LIKE, SUBSCRIBE or COMMENT!

Will Dow Jones fall to 27k this year?My outlook for the stock markets this year is bearish and, in fact, I have expected a fall for around 6 months now. Although it didn't happen, YET, let's try to see the bigger picture and understand what's happening.
For the past 9 months, Dow30 was trading in a range. You may argue that we have higher highs in place, but this, in my opinion, is window dressing. In fact, Dow was trading at an average of 35500. Yes, indeed, 34k support held for 6 times, but recoveries after touching it are anemic, highs are marginal and this support held not because there was much buying power there, just lack of selling by big players.
My true opinion is that in this past 9 months we have had a large distribution, when " they" are done distributing is hard to say though...
In conclusion, I expect a drop for Dow (and indices in general) this year, and my target is 27k

US30USD YM1! DOW 2022 OCT 17US30USD YM1! DOW 2022 OCT 17
Support at 28886 long was fruitful.
Market is in rotation of 1800pts. Next target should be toward bottom
of rotation range 28635.
Possible scenarios:
1) Rotation play = trades to be taken at boundary of range.
2) Signs of breakout = look for higher lows / market loitering near
-> breakout of zone, --> test and accept of breakout = long
3) Signs of breakdown = look for lower highs / market loitering
near bottom of range --> breakdown of range --> Short on test and
reject of breakdown
Price reaction levels
Short on Test and Reject | Long on Test and Accept
32789 31793 31385
30513 28732 29639
29315 27741 26876
26212
Weekly: High vol up bar close off high toward middle = undecisive
Daily: Ave vol down bar close off at low = minor supply
H4: Very high vol down bar close at low = demand present
Remember to like and follow if you find this useful.
Have a profitable week ahead.

US30 - Support Becomes Resistance 📉the dow 30 price breaks the daily support level ,the old support becomes new resistance level ✔
the last Lower Low is broken 🔥
so, i predict a bearish move 📉
TARGET: 26628 🎯
if you agreed with this IDEA, please leave a LIKE, SUBSCRIBE or COMMENT!

YM1! US30USD DOW 2022 OCT 03
US30USD YM1! DOW 2022 OCT 03
Dow Scenario2 breakdown yielded 700pts for last week.
congrats to those who shorted.
Possible scenarios:
1) Short on rejection of trendline // 29639 // 28886
2) Prepare to long if round bottom is observed and market
retraces during an upward move and finds support.
3) Market rotates, then find trades at edge of rotation zone.
(Yellow box)
Price reaction levels
Short on Test and Reject | Long on Test and Accept
32789 31793 31385
31042 30636 30202
29639 29315
Weekly: Higher vol & narrower spread down bar, close off low
= minor demand
(ave vol on bar itself) = demand coming in
Daily: Ave vol down bar close off low = No Supply
H4: Vol showed buying on the downtrend. Coupled with possible
SPRING setup
Remember to like and follow if you find this useful.
Have a profitable week ahead.

Selling US30 into current resistance.DOW30 - Intraday - We look to Sell at 29608 (stop at 29955)
The primary trend remains bearish.
We are assessed to be in a corrective mode higher.
Bespoke resistance is located at 29700.
We therefore, prefer to fade into the rally with a tight stop in anticipation of a move back lower.
Our profit targets will be 28828 and 28600
Resistance: 29700 / 31100 / 32600
Support: 28800 / 26000 / 23500
Risk Disclaimer
The trade ideas beyond this page are for informational purposes only and do not constitute investment advice or a solicitation to trade. This information is provided by Signal Centre, a third-party unaffiliated with OANDA, and is intended for general circulation only. OANDA does not guarantee the accuracy of this information and assumes no responsibilities for the information provided by the third party. The information does not take into account the specific investment objectives, financial situation, or particular needs of any particular person. You should take into account your specific investment objectives, financial situation, and particular needs before making a commitment to trade, including seeking advice from an independent financial adviser regarding the suitability of the investment, under a separate engagement, as you deem fit.
You accept that you assume all risks in independently viewing the contents and selecting a chosen strategy.
Where the research is distributed in Singapore to a person who is not an Accredited Investor, Expert Investor or an Institutional Investor, Oanda Asia Pacific Pte Ltd (“OAP“) accepts legal responsibility for the contents of the report to such persons only to the extent required by law. Singapore customers should contact OAP at 6579 8289 for matters arising from, or in connection with, the information/research distributed.

Joe Gun2Head Trade - Selling the weakest of the US indicesTrade Idea: Selling US30
Reasoning: Selling the weakest of the US indices
Entry Level: 29352
Take Profit Level: 28585
Stop Loss: 29675
Risk/Reward: 2.37:1
Disclaimer – Signal Centre. Please be reminded – you alone are responsible for your trading – both gains and losses. There is a very high degree of risk involved in trading. The technical analysis , like all indicators, strategies, columns, articles and other features accessible on/though this site is for informational purposes only and should not be construed as investment advice by you. Your use of the technical analysis , as would also your use of all mentioned indicators, strategies, columns, articles and all other features, is entirely at your own risk and it is your sole responsibility to evaluate the accuracy, completeness and usefulness (including suitability) of the information. You should assess the risk of any trade with your financial adviser and make your own independent decision(s) regarding any tradable products which may be the subject matter of the technical analysis or any of the said indicators, strategies, columns, articles and all other features.

Selling US30 at current resistance.DOW30 - 24h expiry - We look to Sell at 29575 (stop at 29986)
The primary trend remains bearish.
We are assessed to be in a corrective mode higher.
Prices expected to stall near trend line resistance.
Preferred trade is to sell into rallies.
Our profit targets will be 28614 and 28400
Resistance: 29660 / 32700 / 36800
Support: 28600 / 26000 / 24000
Risk Disclaimer
The trade ideas beyond this page are for informational purposes only and do not constitute investment advice or a solicitation to trade. This information is provided by Signal Centre, a third-party unaffiliated with OANDA, and is intended for general circulation only. OANDA does not guarantee the accuracy of this information and assumes no responsibilities for the information provided by the third party. The information does not take into account the specific investment objectives, financial situation, or particular needs of any particular person. You should take into account your specific investment objectives, financial situation, and particular needs before making a commitment to trade, including seeking advice from an independent financial adviser regarding the suitability of the investment, under a separate engagement, as you deem fit.
You accept that you assume all risks in independently viewing the contents and selecting a chosen strategy.
Where the research is distributed in Singapore to a person who is not an Accredited Investor, Expert Investor or an Institutional Investor, Oanda Asia Pacific Pte Ltd (“OAP“) accepts legal responsibility for the contents of the report to such persons only to the extent required by law. Singapore customers should contact OAP at 6579 8289 for matters arising from, or in connection with, the information/research distributed.

S&P 500 at its last stand Here are the supports and resistances based off order blocks and volume on the way down.
It has to bounce now, and even if it does I’m thinking to 376 or 370, then right back down.
Earnings compression and Qt will keep going on, and the fed has to have fed funds rate ahead of inflation.
It’s looking more and more likely we’re going to have a serious recession rather than a light one.
Light recession 325
Anything else:
277
190

SPX500 / ES - It's Still a Bull. Now, Good Luck Riding ItBefore we begin, to substantiate what I'm about to say, I would suggest everyone blow 8 minutes watching this video .
Professional bull riders attempted to ride Asteroid 76 times.
Asteroid bucked off and stomped professional bull riders 71 times.
You should know professional bull riders aren't some Cletus-style hicks. These are professional athletes in very, very good shape, who grew up riding steers as children, often graduated to horses, and then took on the extremely fine and extremely challenging Cosmic manifestation that is encompassed in the word "ox," of which a bull can be seen as a derivative of.
They're like that and they still got wrecked. Wall Street, is, likewise, like an Ox, for they and the Federal Reserve are the guardians of the world's financial heart, whether you like it or not.
No matter how you hear about recession and inflation and rate hikes this and that on TradingView and Twitter and Discord and the news, the reality is, these markets are still bull markets.
I will repeat: You. Are. Still. In. A. Bull. Market.
This is something I had to change my own mind on recently, and sobering it was. Clarity it doth provided.
And no matter how insane it may sound with all those fundamental factors kicking around telling you that the markets should crash, they aren't going to crash. In a time not-too-far-ahead you're going to see a _major_ and violent bull run that may see SPX 5,000 for real, and it may even happen before 2022 concludes.
However, before that happens, you're going to be given a very difficult situation to buy the dip in, and that situation is upon us.
The reality is that last week's colossal CPI dump and the resulting days of downturn really did amount to a shift in market sentiment from bullish to bearish.
However, you should also note that last week formed an outside bar, with ES futures closing on a ~50 point rally above 3,900.
The reality of an outside bar is that although you're not one bit likely to see it turn around and make a new high the next week, you're also not very likely to see it continue on downwards sweeping new lows so easily.
Looking at the Daily provides some lucidity. Equilibrium of last week's outside bar is a very fun 4014 points.
What you should expect, now that SPX swept previous lows, is in all due fairness, a change in momentum and direction that serves the purpose of enticing longs to enter way, way too early, while also killing short sellers who are way, way too early.
The truth is that while no crash is ahead, you'll feel like we had a crash because we're going to 3,400~ first, and that kind of a dump is probably going to stop being this choppy up and down fearless landside down stuff and will instead come fast and strong... when it happens.
But before we get there, you are very likely to see significant upside manipulation. What's really hard about getting setup short for this move downwards is that the market makers have left a 200 point range that can be played with on and during FOMC day and when Big Jerome Powell speaks.
FOMC rate hike = Wednesday
J Powell speech = Friday
And these really are the only two news events in the cards.
Also keep in mind that counting FOMC day, there's still eight days left in the month to manipulate the markets
A very difficult scenario to trade would be to see a bullish Monday and Tuesday followed by an FOMC rate hike pump.
Even if the Fed hikes 100 bps, it can be used to pump the market. The logic you will hear in the news will be, "Well, didn't you anticipate this? Markets pumped because finally the Federal Reserve is taking care of inflation, so all this inflationary pain will be over sooner than we expected."
And then perhaps when Powell speaks on Friday he will just say hawkish things, meaning that there's no intention to pivot/dove at the next FOMC, which is not until November, and so the markets will dump.
The logic then, will be that "Rates are thus projected to reach 5.5% before the end of the year!!"
Once the markets start dumping, you will probably see 2-3 weeks of very annoying and miserable downside, with little bouncing. This will be very punishing to dip buyers. You buy the dip because Apple looks really cheap and it keeps on running.
"It's been a week and it's not bouncing. It has to bounce, right?"
It will bounce when you get scared out or liquidated and see a 45 VIX print, and not before.
The logic in all this is that although we have a significant shift in the tone of the markets, these markets are still markets that have liked to go wild bucking around and taking out both bears and bulls.
They're about to become markets, however, that takes out just bulls, but only for a little while.
The caveat to all this is the logic that "The trend is your friend... until the end."
Once the big trend shifts is when a person tends to lose a lot of money. They buy the dip expecting to play the bounce only to get freight trained as it drives downwards. Or they short a pop expecting to catch a new target low, only to get ruined by a gap up that takes 18 months to correct.
Well, you want to get rich, right? The truth is that you cannot change your life. You have what you have in your life because of certain causes. Have you ever thought about why you were born in the place and family and gender you are, and not another? Could something like this and all your social and work connections truly be random?
A lot of people get ruined because they are trying to change their lives from what they have to what they think they want, what they think will give them the happiness they desire, what they think will satisfy their egotism.
But you should know that this is a business that is established in society under Heavenly Mandate and if you are to succeed at it, it is because your life already has that predestined fortune.
If you can take a proper attitude towards trading and take a more long term approach, you may be able to reap success. If you can't, then you'll always fail, because you'll always be gambling from a heart of jealousy.
This is a time where it's very, very, very lucrative to position some trades on a two or a three month time frame.
It's also a time that it's very, very, very important to wait to see a proper bottoming price location or a proper bottoming pattern before you go long. Lest you otherwise be 400 points and 15 days too early and then have to wait 40 days to ultimately make virtually nothing.
Also, when it comes to a bull thesis, you should be weary about the situation in mainland China. The Chinese Communist Party will soon fall, and it will happen in the middle of the night North American time and US equities will gap down worse than FedEx did on Friday.
Before that happens, though, you can expect prices to have risen to high places, because the Lords of Wall Street know exactly what is happening, and when, usually because they have their hands in the pile.

US30USD YM1! DOW 2022 SEP 19 Week
US30USD YM1! DOW 2022 SEP 19 Week
After trapping longs, market declined aggressively. Temporary
demand on average volume has returned, which could be a way of
absorbing any long positions still present in the market.
Possible scenarios:
1) Long if 30406 / 30636 is supported
2) Short on rejection of 31385 / 31042 / trend channel rejection
Price reaction levels
Short on Test and Reject | Long on Test and Accept
32789 31793 31385
31042 30636 30406
Weekly: Higher vol & wider spread than previous bar, close off low
(ave vol on bar itself) = demand coming in
Daily: Ave vol down bar close toward high = Demand overcoming supply
H3: Ultra high vol bar + ave vol up bars = Demand has returned
Remember to like and follow if you find this useful.
Have a profitable week ahead.
