US30 Eyes 47,200 for Potential BounceHey Traders, in today’s trading session we’re monitoring US30 for a potential buying opportunity around the 47,200 zone.
The Dow Jones continues to trade in a broader uptrend, and price action is currently in a correction phase, approaching the 47,200 support and resistance confluence area — a key zone where buyers may look to step back in.
Watching for a bullish reaction at this level to confirm continuation of the prevailing trend.
Share your view below — do you think US30 holds this zone or breaks lower?
Trade safe,
Joe.
Dowjones

DowJones Key Trading LevelsKey Support and Resistance Levels
Resistance Level 1: 48085
Resistance Level 2: 48255
Resistance Level 3: 48500
Support Level 1: 47260
Support Level 2: 47040
Support Level 3: 46880
This communication is for informational purposes only and should not be viewed as any form of recommendation as to a particular course of action or as investment advice. It is not intended as an offer or solicitation for the purchase or sale of any financial instrument or as an official confirmation of any transaction. Opinions, estimates and assumptions expressed herein are made as of the date of this communication and are subject to change without notice. This communication has been prepared based upon information, including market prices, data and other information, believed to be reliable; however, Trade Nation does not warrant its completeness or accuracy. All market prices and market data contained in or attached to this communication are indicative and subject to change without notice.

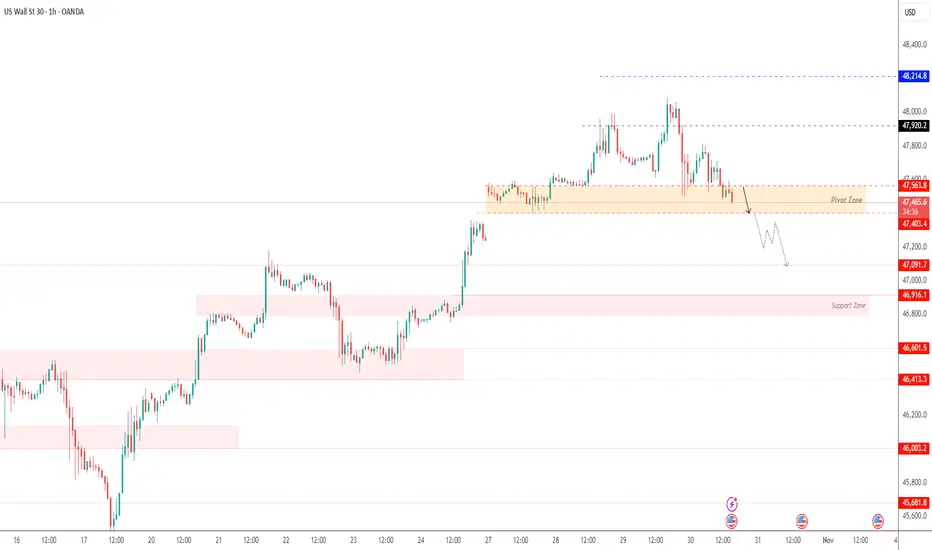
US30 - Testing Key Support Zone Amid Bearish PressureUS30 – MARKET OUTLOOK | Testing Key Support Zone Amid Bearish Pressure 🇺🇸
The Dow Jones is testing the 47,400 support zone, with downside pressure still dominant.
A 1H close below 47,400 would confirm continuation toward 47,090 → 46,920.
However, a 1H close above 47,620 may trigger a bullish rebound toward 47,920 → 48,000.
Pivot: 47,565
Support: 47,400 · 47,100 · 46,920
Resistance: 47,670 · 47,920 · 48,000
US30 remains bearish below 47,565, but a breakout above 47,620 could shift momentum to bullish.
DOW JONES approaching the end of its Bull Cycle?Dow Jones (DJI) has been trading within a 16-year Channel Up ever sine the March 02 2009 market bottom of the U.S. Housing Crisis. As this chart shows, we have divided this pattern into three different phases.
Since the March 2020 COVID crash, it appears that the Cycle got restarted as the index broke below its 1W MA200 (orange trend-line) again after 10 years. Technically that was the only time that multi-year Support trend-line broke in 15 years.
In any case, following that Cycle 'restart', it appears that the index is currently inside the Megaphone pattern that in 2015 concluded Phase 2. The conclusion came with a second test on the 1W MA200 (Double Bottom). The first test was the April 07 2025 Low.
With their 1W RSI sequences also identical, having the first 1W MA200 forcing a 30.00 (oversold) RSI rebound, we expect the index to start a new Bearish Leg that might potentially test the 1W MA200 around 39000. For long-term investors, that is the market's next Buy Entry.
-------------------------------------------------------------------------------
** Please LIKE 👍, FOLLOW ✅, SHARE 🙌 and COMMENT ✍ if you enjoy this idea! Also share your ideas and charts in the comments section below! This is best way to keep it relevant, support us, keep the content here free and allow the idea to reach as many people as possible. **
-------------------------------------------------------------------------------
💸💸💸💸💸💸
👇 👇 👇 👇 👇 👇

US30 Bullish Breakout!
HI,Traders !
#US30 is trading in a strong
Uptrend and the price made a
Bullish breakout of the key
Horizontal level of 46718.2
So we are bullish biased
And we will be expecting a
Further bullish move up !
Comment and subscribe to help us grow !

Before DOW 50K Happens (DJI long call for holders)Remember the future. Beware of the past. This time it's different. That's all.
I recommend studying Richard Wyckoff Stock Trading Technique, but not Tape Reading because that information is past its prime, in my opinion ;)
There's nothing left but upward ascent for humanity in my view. This is to do with spiritual reasons that many of us traders are privy to in our inner circles.
This chart is directed guidance towards the g20 group and the G7 group of Countries we call Home on Earth protectors.
We use capitalization as necessary to achieve the desired effect, affect, or required attribute enrichment in order to AVOID City 17, and not have to go back to the old ways of fearing totalitarian rule.
I posit that Donald Trump, The President of the United States of America, will eventually reply to my Christmas letter from 1993 and finish Home Alone 3, but I degress.
Some of us write letters. This is one such letter to the public; I used to write letters to Bill Gates on an IBM PS2, if you know your stuff.
This is my final chart, at least for a while. I always say something like that when I post a grand prediction like this one.
I bid you all well, and hope you find fruitfulness in your future life endeavors.
BLUEDOG OUT

DowJones key support at 47260Key Support and Resistance Levels
Resistance Level 1: 48085
Resistance Level 2: 48255
Resistance Level 3: 48500
Support Level 1: 47260
Support Level 2: 47040
Support Level 3: 46880
This communication is for informational purposes only and should not be viewed as any form of recommendation as to a particular course of action or as investment advice. It is not intended as an offer or solicitation for the purchase or sale of any financial instrument or as an official confirmation of any transaction. Opinions, estimates and assumptions expressed herein are made as of the date of this communication and are subject to change without notice. This communication has been prepared based upon information, including market prices, data and other information, believed to be reliable; however, Trade Nation does not warrant its completeness or accuracy. All market prices and market data contained in or attached to this communication are indicative and subject to change without notice.

DowJoned bullish breakout supported at 47260Key Support and Resistance Levels
Resistance Level 1: 48085
Resistance Level 2: 48255
Resistance Level 3: 48500
Support Level 1: 47260
Support Level 2: 47040
Support Level 3: 46880
This communication is for informational purposes only and should not be viewed as any form of recommendation as to a particular course of action or as investment advice. It is not intended as an offer or solicitation for the purchase or sale of any financial instrument or as an official confirmation of any transaction. Opinions, estimates and assumptions expressed herein are made as of the date of this communication and are subject to change without notice. This communication has been prepared based upon information, including market prices, data and other information, believed to be reliable; however, Trade Nation does not warrant its completeness or accuracy. All market prices and market data contained in or attached to this communication are indicative and subject to change without notice.

US30 Intraday Plan – Bullish Bias Above 47,700 - 28/10/2025US30 has been maintaining strong bullish structure with a series of higher highs and higher lows on the lower timeframes. After breaking through the 47,700 zone, price is now retesting that area — which may act as intraday support going into the U.S. session.
📊 Scenarios:
Bullish Scenario (Primary Bias)
Watch for a pullback into the 47,730–47,700 zone — this area may serve as a liquidity grab / confirmation zone before continuation.
If support holds, potential upside targets are:
TP1 → 47,850
TP2 → 47,950
TP3 → 48,000 (psychological level & round number target)
Bearish Scenario (Alternative)
If price rejects near 47,780 and fails to hold above 47,700, we could see a deeper retracement.
Downside targets in that case:
TP1 → 47,500
TP2 → 47,350–47,300
📈 Bias: Bullish above 47,700
📉 Invalidation: Sustained break below 47,600
This plan focuses on waiting for confirmation at key levels rather than chasing momentum. Watch the first 15–30 minutes after NY open for direction confirmation — expect volatility and potential fakeouts.

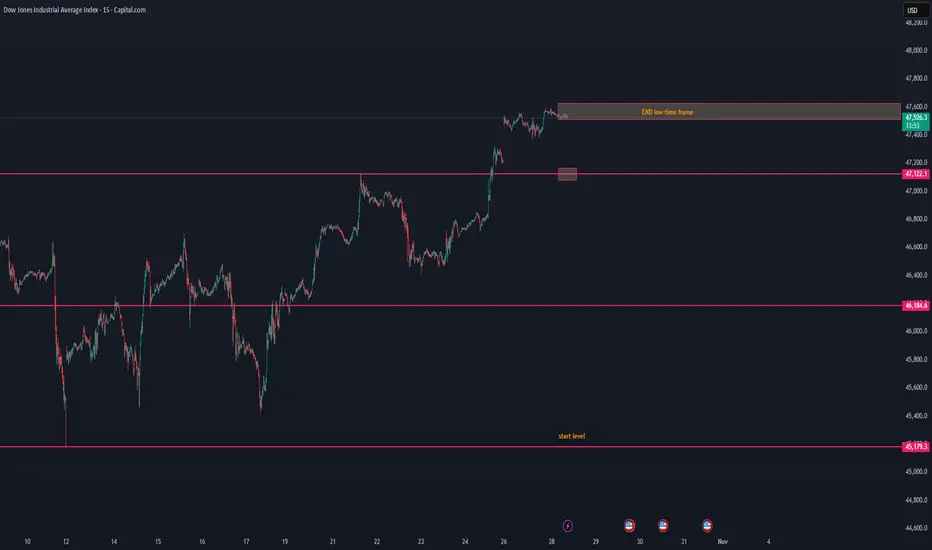
US30 lost its low time frame — possible breakdown aheadUS30 lost its low time frame — possible breakdown ahead ⚠️
US30 has lost its low time frame structure, showing early signs of weakness after the recent push to 47.5K.
The current price action suggests that momentum is fading, and sellers may start to take control.
📉 Short-term view:
Structure break below 47.5K zone confirms loss of bullish control.
The next visible support area sits around 47.1K, followed by 46.1K.
With time, price could continue to drift down toward the start level near 45.1K if buyers fail to defend.
📊 Observation:
Volume has started to cool off, and price is trading below the short-term EMA range — a typical setup before a gradual downward retrace.
💬 Summary:
US30 lost its low time frame momentum and looks to break down step by step toward the start level zone. We’ll monitor if buyers can react near 47.1K or if this becomes a broader correction phase.
US30 H4 | Bearish ReversalDow Jones (US30) is reacting off the sell entry, which aligns with hte 161.8% Fibonacci extension and the 61.8% Fibonacci projection, and could drop from this level to the downside.
Sell entry is at 47,651.31, which lines up with the 161.8% Fibonacci extension and the 61.8% Fibonacci projection.
Stop loss is at 48,228.80, whic lines up with the 100% Fibonacci projection.
Take profit is at 46,892.33, which is an overlap support that lines u;p with hte 38.2% Fibonacci retracement.
Stratos Markets Limited (tradu.com ):
CFDs are complex instruments and come with a high risk of losing money rapidly due to leverage. 68% of retail investor accounts lose money when trading CFDs with this provider. You should consider whether you understand how CFDs work and whether you can afford to take the high risk of losing your money.
Stratos Europe Ltd (tradu.com ):
CFDs are complex instruments and come with a high risk of losing money rapidly due to leverage. 70% of retail investor accounts lose money when trading CFDs with this provider. You should consider whether you understand how CFDs work and whether you can afford to take the high risk of losing your money.

Is Nasdaq Set for a Pullback? | Fibonacci Resistance Zone ahead!In this video I map out the idea of the Nasdaq being over extended and on route to approaching a key Fibonacci resistance level 27000 ,
This may set up a potential correction in the week ahead."
This is a counter-trend setup within a larger uptrend, so risk management is key. I'm not calling a top to the entire rally, but rather a healthy pullback to bring in new buyers."
I demonstrate how i see the price action moving forward over the course of the month ahead with valuable insights.
Tools used in this video Standard Fib , Fib Expansion, Fib extension + Anchored vwap and Volume profile and TPO chart

EUR/USD | Breaks Higher After CPI Data – Next Stop 1.17?By analyzing the EUR/USD chart on the 2-hour timeframe, we can see that after an initial rise, price corrected to 1.15765, then gained strong buying pressure and climbed up to 1.165 so far.
Following today’s CPI report , which came in lower than expected, the euro strengthened and the U .S. dollar weakened .
I expect EUR/USD to continue its upward move, with the next target at 1.16710 . If price breaks above this level, the following targets are 1.16815 and 1.16950.
Please support me with your likes and comments to motivate me to share more analysis with you and share your opinion about the possible trend of this chart with me !
Best Regards , Arman Shaban

US30 - Intraday Playbook for NY Session 27/10/2025Here’s my structured 15M game plan heading into the US session today. We’re currently sitting inside a bullish trend, but we’re also at a point where price could either continue higher or shift momentum if key demand levels fail. So I’m prepared for both bullish continuation and a possible bearish reversal scenario.
✅ Overall Trend Context:
Higher highs / higher lows remain intact on the 4H / 1H.
Recent bullish leg may need a liquidity sweep / pullback before continuation.
Key intraday structure levels are now clearly defined.
📈 Bullish Continuation Scenario (Primary Bias)
I’ll look for long setups if price pulls back into demand zones and shows bullish rejection.
⚠️ Valid only while price holds above 47,200.
✅ Long Zone #1: 47,300 – 47,350 (first demand / shallow pullback zone)
✅ Long Zone #2: 47,150 – 47,200 (deeper liquidity pool)
Bullish Confirmation Triggers (15M or 5M):
Rejection wick from demand
Bullish engulfing / candle flip
Break of minor 5M structure after tap
🎯 Bullish Targets:
TP1: 47,450 (reaction zone)
TP2: 47,500 – previous high
TP3: 47,600+ if momentum extends
📉 Bearish Reversal Scenario (Alternate Plan)
I will only shift bearish if price breaks below the key higher-low level.
🔻 Bearish bias becomes active if we break & hold below 47,200.
✅ Plan: Wait for a break → retest of 47,200 – 47,250 as resistance → look for rejection
(5M / 15M bearish engulfing, failed reclaim, or lower high confirmation)
🎯 Bearish Targets:
TP1: 47,050 – first liquidity pocket
TP2: 46,900 – prior swing low / demand zone
TP3: 46,750 – deeper structural support
📍 Key Notes
✅ I won’t chase anything at market open — I’ll wait for liquidity grab and confirmation.
❌ No longs if 47,200 breaks decisively and turns into resistance.
❌ No shorts while above 47,200 unless a clear fakeout rejection occurs at 47,500.

US Stock Indexes Broke New RecordsCBOT: Micro E-Mini Dow Jones Futures ( CBOT_MINI:MYM1! )
After a 9-day delay due to the U.S. government shutdown, the Bureau of Labor Statistics (BLS) released the September CPI data on October 24th. Here are the highlights:
• The Consumer Price Index for All Urban Consumers (CPI-U) increased 0.3% on a seasonally adjusted basis in September, after rising 0.4% in August.
• On an annual basis, the headline inflation rose 3.0% before seasonal adjustment.
• The CPI index for all items less food and energy, commonly known as the Core CPI, rose 0.2% in September, after rising 0.3% in each of the 2 preceding months.
As cooling inflation data spurred investor optimism, U.S. stocks reached new heights again on Friday. The market expects the Federal Reserve to stay on its rate-cutting path, boosting the U.S. economy and justifying higher stock valuations.
The Dow Jones Industrial Average rose 472.51 points, or 1.01%, to 47,207.12, securing its first close above the 47,000 level. The S&P 500 added 0.79% to 6,791.69, while the Nasdaq Composite climbed 1.15% to 23,204.87. All three closed at records.
Following the CPI data, traders increased their stakes that the Fed will cut rates in October and December. Odds for a December cut jumped to 98.5% from roughly 91% before the data, per the CME FedWatch tool. Odds for a cut next week remained above 95%.
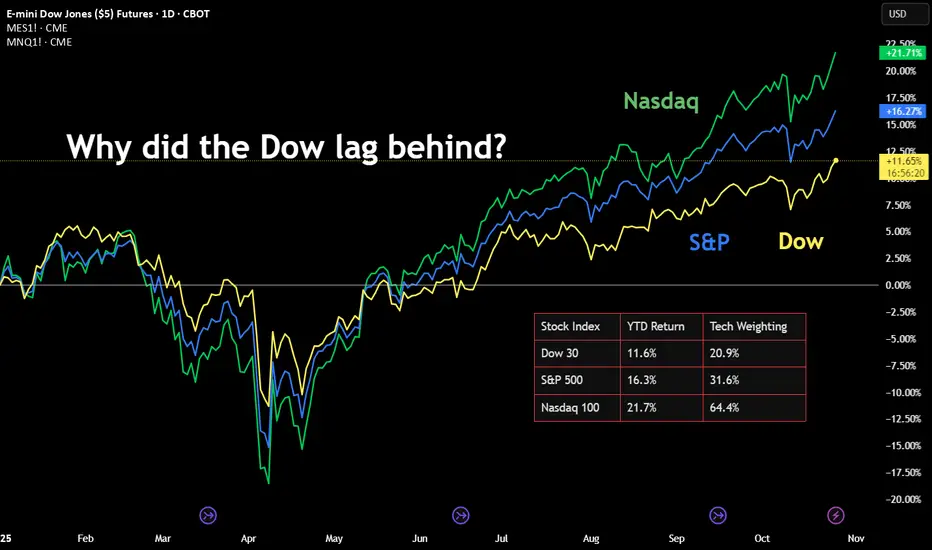
The Case of Dow over S&P and Nasdaq
As of Friday, the Dow gained 10.55% year-to-date, while the S&P rose 15.01% and the Nasdaq was 20.18% higher in 2025.
Why did the Dow lag behind the S&P and the Nasdaq? A simple answer is due to its lower index weight on technology. Since the current bull market is primarily driven by A.I., the Dow benefited less comparing to the other two stock indexes.
The Dow has six component companies in the technology sector. Their combined weight comes to 20.91% of the 30-stock index as of today.
• Microsoft (MSFT), 6.82%
• IBM (IBM), 4.00%
• Apple (AAPL), 3.42%
• Salesforce (CRM), 3.32%
• Nvidia (NVDA), 2.43%
• Cisco (CSCO), 0.92%
For a comparison, the S&P 500 has a weighing of 31.6% on Information Technology, while the Nasdaq-100 has a weighing between 62.48% - 64.45% for Technology.
In my opinion, the stock market has already beaten up so much on the A.I. hype, and it is late in the bull market cycle. The Nasdaq-100 has a lofty valuation with a Price/Earnings ratio of 33.25 (trailing 12-month), according to Birinyi Associates. Meanwhile, the Dow has a more reasonable P/E ratio of 24.90.
I am bullish on U.S. stocks long term. However, I share the growing concerns about potential collusion among AI companies. Types of AI collusion under investigation:
• Partnerships and investments: Tech giants invest billions into AI startups. Are these deals designed to control the AI ecosystem and suppress competition?
• Algorithmic price-fixing: Companies may use AI-powered pricing algorithms to inflate prices. Antitrust agencies are actively scrutinizing potential collusive outcomes.
• AI companies may use shared platforms or common algorithms to align market strategies, potentially forming a tacit "hub-and-spoke" conspiracy.
• Companies initially release AI models as "open source" to gain market share, accumulate data, and establish an ecosystem, only to later close off access.
• Dominant tech firms with control over cloud computing infrastructure, proprietary data, and massive financial resources could entrench their positions in the AI market.
To summarize, the Dow is a safer bull-market strategy given its more reasonable valuation. Investors are wise to stay clear off the potential crush on the A.I. hype.
Trading with Micro E-Mini Dow Jones Futures
If a trader shares a bullish view on the Dow, he may consider using stock index futures to enhance investment returns.
Micro E-Mini Dow Jones futures (MYM) offer smaller-sized versions of CME Group’s benchmark Dow Jones futures (YM) contracts. Micro futures have a contract size of 0.5 times the DJIA index, which is 1/10th of the standard contract.
CME data shows that the E-Mini and Micro Dow Jones futures have a combined open interest of 105,674 contracts as of Friday. Due to the government shutdown, the CFTC Commitment of Traders report has not been updated since September 23rd. We are currently in the dark about the “Smart Money” positions in the Dow.
Buying or selling one MYM contract requires an initial margin of $1,371. With Friday settlement price of 47,396, each December contract (MYMZ5) has a notional value of $23,857. Compared with investing in stocks, the futures contracts offer a built-in leverage of about 17 times (=23857/1371).
Hypothetically, if Dow futures price moves up 5% to 49,766 by December, the index gain of 2,370 points will translate into $1,185 for a long position, given each index point equal to $0.50 for the Micro contract. Using the initial margin of $1,371 as a cost base, the trade would produce a theoretical return of 86.4% (=1185/1371).
Futures contracts have expiration days, and you may not hold them forever like stocks. To stay long in the DJIA, a trader may consider a futures rollover strategy. An illustration:
• A trader buys the lead contract December now, and holds it till the end of November
• He will then sell December and buy March, which will become the next lead contract
• He will repeat this process: buy June 2025 and sell March 2026 in February 2026
• Repeat this again to buy September 2026 and sell June 2026 in August 2026
This series of trades allows a trader to establish a long position in the DJIA throughout the year, while holding the most liquid contracts.
There is no guarantee that each trade will yield positive returns. But if the Dow is trending up over time, the position would likely pay off.
The leverage feature in futures works both ways. It would magnify the losses as well as improving the winnings. The good news is, a trader could put stop-loss on his futures trades, limiting the downside risks.
For example, our trader may set stop-loss at 45,000 when he buys the MYM at 47,396. If the Dow falls to 40,000, his position will be liquidated well before that when the price hits 45,000. The maximum loss incurred will be $1,198 (= (47396 - 45000) * 0.5), which is less than the initial margin of $1,371.
The combination of Futures Rollover with Stop-loss could yield higher returns (thanks to the leverage) while maintaining a limited loss exposure. If the index bounces up and down but trends up in the long stretch, the trader will see both wins and losses. Since the wins are unbounded but the losses are contained, the overall returns would likely be positive.
Happy Trading.
Disclaimers
*Trade ideas cited above are for illustration only, as an integral part of a case study to demonstrate the fundamental concepts in risk management under the market scenarios being discussed. They shall not be construed as investment recommendations or advice. Nor are they used to promote any specific products, or services.
CME Real-time Market Data help identify trading set-ups and express my market views. If you have futures in your trading portfolio, you can check out on CME Group data plans available that suit your trading needs www.tradingview.com
US30 (1H) — Demand Zone Mapping & Bullish ScenariosHere’s my latest mapping for US30 on the 1-hour timeframe.
After a strong bullish impulsive move, I’m now watching for a potential retracement to one of the key demand zones before the next leg higher.
Zone 1: 47,100 – 47,000
This is the nearest demand zone and the first area where buyers might step in again.
If price holds here and forms a bullish reaction (e.g., engulfing candle or strong wick rejection), I’ll be watching for a possible continuation toward 47,750 – 48,100.
This level aligns closely with the 0.236 Fibonacci retracement, so it could serve as a shallow pullback for aggressive buyers.
Zone 2: 46,850 – 46,700
This zone sits around the 0.5 Fibonacci retracement, which usually acts as a more balanced correction area.
If price rejects Zone 1 but finds support here, it could form a stronger base for a continuation rally.
I’ll be monitoring this level closely for a cleaner structure before re-entry.
Zone 3: 46,600 – 46,400
This deeper zone overlaps with the 0.618–0.786 Fibonacci area, often referred to as the “golden pocket.”
If the market extends its retracement this far, it could present a high-probability buy setup—especially if liquidity sweeps below the previous low before reversing upward.
This would indicate smart money accumulation before a potential breakout.
Upside Targets
If bullish momentum continues, my key upside targets remain:
47,430 (0.27 ext)
47,750 (0.618 ext)
48,100 (1.0 ext)
I’ll look for confirmation and structure before committing to any position.
Bias remains bullish unless price breaks below 46,300, which would invalidate this short-term outlook.
Summary
I’m expecting a short-term pullback followed by a continuation toward new highs.
The goal is to wait patiently for price to come to the demand zones instead of chasing moves.
Plan the trade. Wait for confirmation. Execute with discipline.

DowJones bullish reaction to US 3% Inflation dataKey Support and Resistance Levels
Resistance Level 1: 47156
Resistance Level 2: 47285
Resistance Level 3: 47413
Support Level 1: 46450
Support Level 2: 46270
Support Level 3: 46126
This communication is for informational purposes only and should not be viewed as any form of recommendation as to a particular course of action or as investment advice. It is not intended as an offer or solicitation for the purchase or sale of any financial instrument or as an official confirmation of any transaction. Opinions, estimates and assumptions expressed herein are made as of the date of this communication and are subject to change without notice. This communication has been prepared based upon information, including market prices, data and other information, believed to be reliable; however, Trade Nation does not warrant its completeness or accuracy. All market prices and market data contained in or attached to this communication are indicative and subject to change without notice.

24-10-2025 Intraday Plan (CPI + NY Open Scenario) – US30 5M/1M💬 Intraday Plan (CPI + NY Open Scenario) – US30 5M/1M
📍 Bias remains bullish above 46,700 (structure still forming higher lows).
📍 Expecting CPI at 13:30 to create a liquidity grab — ideally sweeping lows into the ascending trendline/support.
📍 After CPI spike settles, looking for a NY Open breakout above 46,850 (key resistance).
📍 If we get a break + retest of 46,850, I’ll look for long entries targeting:
✅ TP1: 47,000
✅ TP2: 47,100
✅ TP3: 47,200 (liquidity extension)
❌ If CPI breaks below 46,700 and fails to recover, I’ll reassess for a bearish scenario.
🕒 No trades during initial CPI spike – waiting for structure confirmation post-news & into NY session.
📌 Plan: CPI grab → NY breakout → retest entry → continuation.

DowJones at pivotal 46450 levelKey Support and Resistance Levels
Resistance Level 1: 47156
Resistance Level 2: 47285
Resistance Level 3: 47413
Support Level 1: 46450
Support Level 2: 46270
Support Level 3: 46126
This communication is for informational purposes only and should not be viewed as any form of recommendation as to a particular course of action or as investment advice. It is not intended as an offer or solicitation for the purchase or sale of any financial instrument or as an official confirmation of any transaction. Opinions, estimates and assumptions expressed herein are made as of the date of this communication and are subject to change without notice. This communication has been prepared based upon information, including market prices, data and other information, believed to be reliable; however, Trade Nation does not warrant its completeness or accuracy. All market prices and market data contained in or attached to this communication are indicative and subject to change without notice.

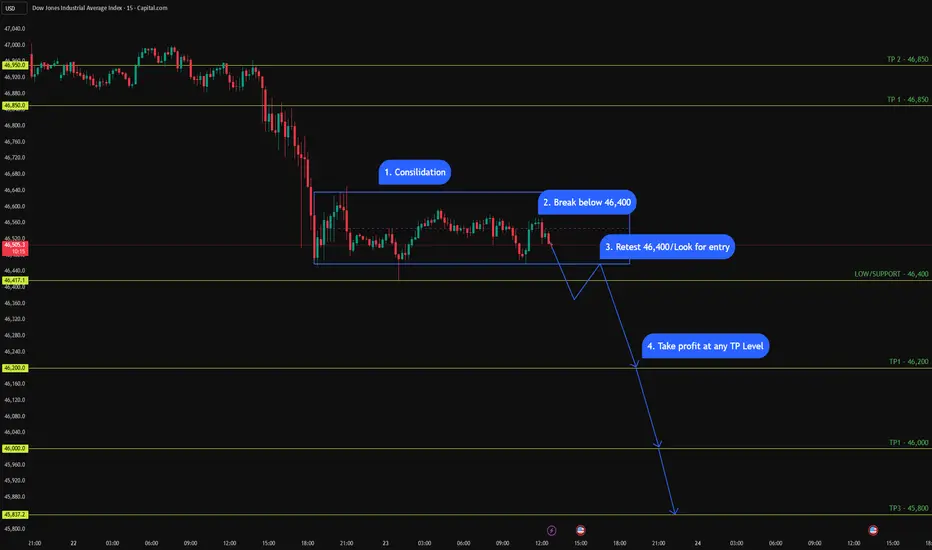
US30 (15M - 1M Daily Setup) - Bearish Bias US30 (15M - 1M Daily Setup) - Bearish Bias 📉
Price is consolidating under key resistance, forming lower highs. I’m watching 46,400 as the make-or-break level.
✅ Plan:
1️⃣ Consolidation phase complete
2️⃣ Looking for a clean break below 46,400
3️⃣ Retest → possible short entry
4️⃣ Target zones:
• TP1 → 46,200
• TP2 → 46,000
• TP3 → 45,800
📍 Bias stays bearish as long as price remains below 46,850 – 47,000.
Let’s see if the breakdown plays out. 👀
Dow bullish breakout supported at 46600Key Support and Resistance Levels
Resistance Level 1: 47156
Resistance Level 2: 47285
Resistance Level 3: 47413
Support Level 1: 46600
Support Level 2: 46460
Support Level 3: 46270
This communication is for informational purposes only and should not be viewed as any form of recommendation as to a particular course of action or as investment advice. It is not intended as an offer or solicitation for the purchase or sale of any financial instrument or as an official confirmation of any transaction. Opinions, estimates and assumptions expressed herein are made as of the date of this communication and are subject to change without notice. This communication has been prepared based upon information, including market prices, data and other information, believed to be reliable; however, Trade Nation does not warrant its completeness or accuracy. All market prices and market data contained in or attached to this communication are indicative and subject to change without notice.

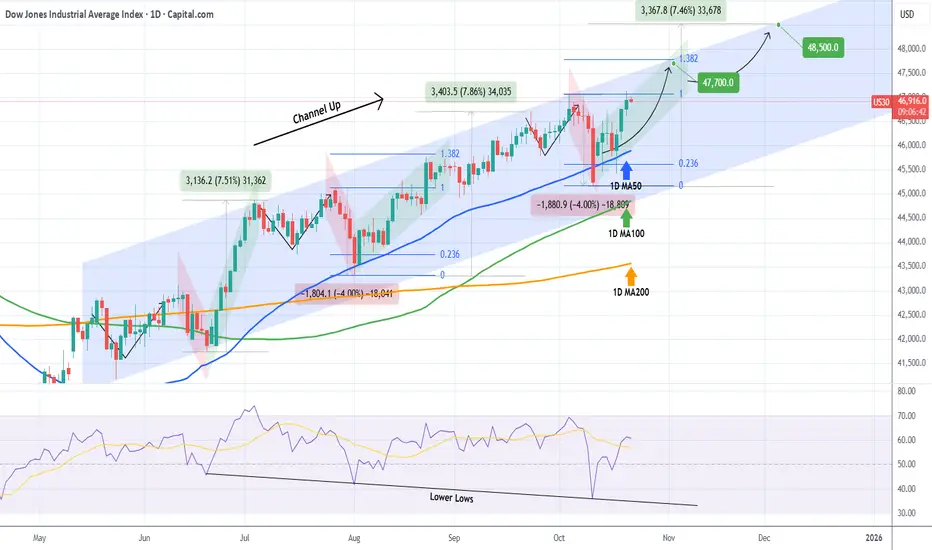
DOW JONES eyes two Bullish Targets before the end of the year.Dow Jones (DJI) has been trading within a 5-month Channel Up and is currently on its new Bullish Leg following the October 10 bounce on its 1D MA50 (blue trend-line).
As you can see, there is a high degree of symmetry between both the Bearish and Bullish Legs within this pattern and if that continues to hold, the immediate Target of the current Bullish Leg is the 1.382 Fibonacci extension at 47700, which we've already mentioned on our previous analysis.
This time however, we also set a second Target towards the end of the year, being a +7.50% rise (standard Leg as you can see) from the bottom at 48500. Both Targets would make ideal technical Higher Highs for the Channel Up.
Notice also how the October 10 bounce took place also on the 1D RSI's Lower Lows trend-line. An additional indication of a strong support for the long-term bullish trend.
-------------------------------------------------------------------------------
** Please LIKE 👍, FOLLOW ✅, SHARE 🙌 and COMMENT ✍ if you enjoy this idea! Also share your ideas and charts in the comments section below! This is best way to keep it relevant, support us, keep the content here free and allow the idea to reach as many people as possible. **
-------------------------------------------------------------------------------
💸💸💸💸💸💸
👇 👇 👇 👇 👇 👇
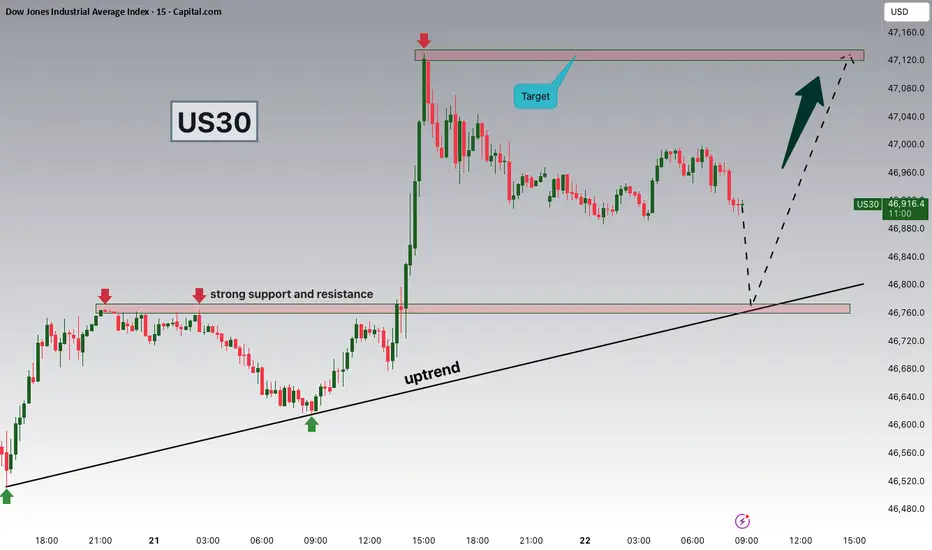
Dow Jones Testing 46,760 – Bounce or Breakdown Ahead?Hey Traders, in today’s trading session we’re closely monitoring US30 for a buying opportunity around the 46,760 zone. The Dow Jones remains in a broader uptrend and is currently undergoing a correction phase, approaching a key support and resistance confluence at 46,760.
Market Structure:
The index continues to print higher highs and higher lows, confirming bullish market structure. The current retracement could offer a potential continuation setup if buyers regain control near this level.
Key Level:
46,760 — an important technical zone where trendline support meets horizontal structure, providing a potential reaction point for bulls.
Outlook:
If buying pressure emerges from this area, a move toward 47,400–47,600 could be on the table in the coming sessions.
💬 What’s your take on US30 here?
Do you see a bounce from support or a deeper pullback coming? Share your view in the comments!
Trade safe,
Joe.