Dow Jones Industrial Average ($US30): Market Mover or Stumbling?(1/9)
Good afternoon, everyone! ☀️ Dow Jones Industrial Average ( BLACKBULL:US30 ): Market Mover or Stumbling Block?
With the Dow at $42,407.80, is this blue-chip index a steady climber or a shaky step? Let’s chart the course! 🔍
(2/9) – PRICE PERFORMANCE 📊
• Current Price: $ 42,407.80 as of Mar 24, 2025 💰
• Recent Move: Up 0.8% from $41,985.35 on Mar 21, per data 📏
• Sector Trend: Mixed with tech, aerospace gains 🌟
It’s a bumpy climb—let’s see what’s driving it! ⚙️
(3/9) – MARKET POSITION 📈
• Composition: 30 U.S. blue-chip firms, all sectors but transport, utilities 🏆
• Trend: Volatile but up 1.2% weekly as of Mar 21, per data ⏰
• Sentiment: Cautious optimism amid trade tensions 🎯
Firm but tested by macro winds! 📊
(4/9) – KEY DEVELOPMENTS 🔑
• Fed Update: Rates steady, economic uncertainty up, per data 🌍
• Sector Gains: Boeing up 7% on Air Force deal, per data 📋
• Market Reaction: Dow up after tariff reprieve hopes 💡
Navigating a stormy market! 🌪️
(5/9) – RISKS IN FOCUS ⚡
• Trade Tensions: U.S.-China tariffs spark inflation fears 🔍
• Economic Slowdown: Consumer sentiment at 2022 lows 📉
• Policy Shifts: Trump tariffs add uncertainty ❄️
It’s a rocky path—watch the curves! 🛑
(6/9) – SWOT: STRENGTHS 💪
• Blue-Chip Base: 30 industry leaders 🥇
• Sector Gains: Tech, aerospace lift index 📊
• Resilience: Up 12.7% from 52-week low 🔧
Got a sturdy engine under the hood! 🏦
(7/9) – SWOT: WEAKNESSES & OPPORTUNITIES ⚖️
• Weaknesses: Volatility, 5.9% off peak 📉
• Opportunities: Rate cut hopes, tech rebound 📈
Can it climb higher or stall out? 🤔
(8/9) – POLL TIME! 📢
Dow at $42,407.80—your take? 🗳️
• Bullish: $44,000+ soon, rally resumes 🐂
• Neutral: Steady, risks balance out ⚖️
• Bearish: $40,000 looms, correction deepens 🐻
Chime in below! 👇
(9/9) – FINAL TAKEAWAY 🎯
Dow’s $42,407.80 price shows cautious gains 📈, but volatility’s in the air 🌿. Dips are our DCA fuel 💰—buy low, ride high! Gem or bust?
Dowjones

US30 Dow Jones Possible RetraceThe US30 Dow Jones is showing bullish momentum and is currently overextended. In this video, we explore a trade idea that involves a retracement to the 50% equilibrium level of the previous price swing. This is not financial advice.

Weekly Market Forecast SP500 NASDAQ DOW: Short Term BUYS!In this video, we will analyze the S&P 500, NASDAQ, AND DOW JONES Futures for the week of March 24 - 28th. We'll determine the bias for the upcoming week, and look for the best potential setups.
The equity markets have been choppy lately, but this week may be different. The economic calendar shows a smooth week ahead, as there are no NFP, FOMC, or similarly volatile news ahead to potentially reverse a market out of the blue. The indices show potential to break consolidation and move upwards. So we wait until there are definitive market structure shifts to occur, acting as confirmations.
Only then do we pounce!
Enjoy!
May profits be upon you.
Leave any questions or comments in the comment section.
I appreciate any feedback from my viewers!
Like and/or subscribe if you want more accurate analysis.
Thank you so much!
Disclaimer:
I do not provide personal investment advice and I am not a qualified licensed investment advisor.
All information found here, including any ideas, opinions, views, predictions, forecasts, commentaries, suggestions, expressed or implied herein, are for informational, entertainment or educational purposes only and should not be construed as personal investment advice. While the information provided is believed to be accurate, it may include errors or inaccuracies.
I will not and cannot be held liable for any actions you take as a result of anything you read here.
Conduct your own due diligence, or consult a licensed financial advisor or broker before making any and all investment decisions. Any investments, trades, speculations, or decisions made on the basis of any information found on this channel, expressed or implied herein, are committed at your own risk, financial or otherwise.

US30 - Catch The Next Wave!US30 is currently in an uptrend, with price action respecting a well-defined ascending channel. We anticipate another bounce from channel support.
In Wave 2, price was rejected at the 38.2% Fibonacci retracement level, and we expect a similar reaction for Wave 4.
Our strategy is to wait for price to enter the buy zone, between the 38.2% and 50% Fibonacci retracement levels, and look for bullish reversal signals before entering a position.
Potential Bullish Reversal Signals:
Trendline break
Break of structure (BOS)
Other confirmation patterns
Trade Plan:
- Monitor price movement into the buy zone, aligning with channel support.
- Enter long positions upon confirmation of bullish price action, placing stop-loss below the established low formed after bullish confirmation.
Target levels: 45,000 and 48,500, with the remainder held for a potential extended swing trade.
Goodluck and as always, trade safe!

Dow Jones The Week Ahead 24th March '25 Dow Jones bearish & oversold, the key trading level is at 42488
This communication is for informational purposes only and should not be viewed as any form of recommendation as to a particular course of action or as investment advice. It is not intended as an offer or solicitation for the purchase or sale of any financial instrument or as an official confirmation of any transaction. Opinions, estimates and assumptions expressed herein are made as of the date of this communication and are subject to change without notice. This communication has been prepared based upon information, including market prices, data and other information, believed to be reliable; however, Trade Nation does not warrant its completeness or accuracy. All market prices and market data contained in or attached to this communication are indicative and subject to change without notice.

Promising Breakout Setup Ahead! Chart 1W CBOT_MINI:YM1! BLACKBULL:US30
Promising Breakout Setup Ahead!
The chart highlights RSI and Williams %R trendline breakout plays. My strategy? Identify trendlines on the chart, monitor RSI and Williams %R, and target breakouts on these momentum indicators.
Current Situation:
All key signals have already triggered.
Strong bullish seasonality
Favorable COT data (small specs bearish, commercials bullish)
Low open interest
This setup aligns with high-probability breakout criteria.
Chart Indicator
SMA 1W 52 (red)
SMA 1W 18 (green)
Bottom Indicators
WilVal
Williams R% 9 length
RSI 9 length
Not Financial Advice
for more questions ask in the comments or
check my X @valuebuffet

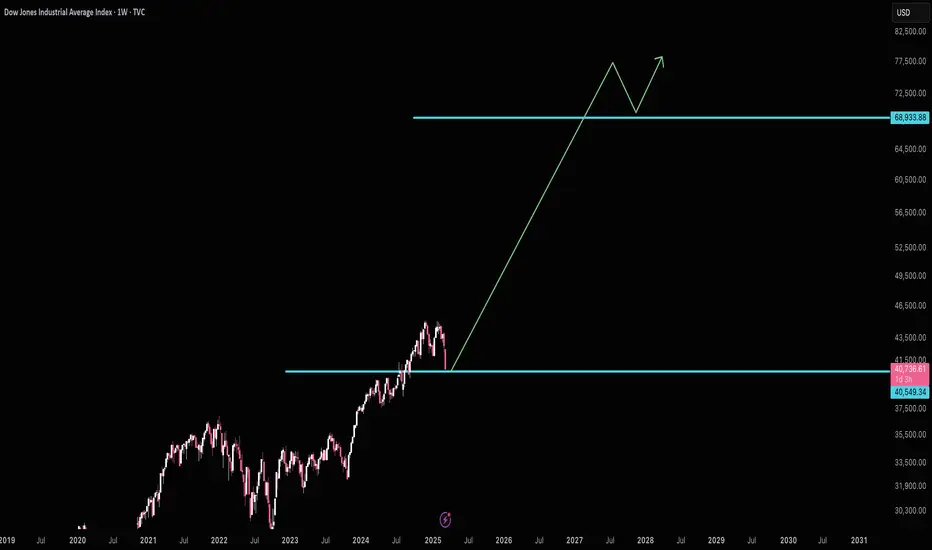
DOW JONES targeting 50000 on this final Bull yearDow Jones / US30 posted the first green weekly candle after hitting last week the 1week MA50.
This is obviously a critical support level as it has been holding since the October 30th 2023 rebound.
As this chart shows, Dow has been repeating the same patterns, Cycle after Cycle.
Right now it has entered the Final Year of Bull, which is the part where it rises aggressively to form the Top before the new Bear begins in the form of a Megaphone pattern.
The previous Bull peaked on the 2.382 Fibonacci extension of the Megaphone.
This means that a 50000 Target for Dow is perfectly plausible by the end of 2025.
Follow us, like the idea and leave a comment below!!

Dow Jones INTRADAY Bearish oversold bounce backKey Support and Resistance Levels
Resistance Level 1: 42488
Resistance Level 2: 43067
Resistance Level 3: 43575
Support Level 1: 40657
Support Level 2: 40109
Support Level 3: 39584
This communication is for informational purposes only and should not be viewed as any form of recommendation as to a particular course of action or as investment advice. It is not intended as an offer or solicitation for the purchase or sale of any financial instrument or as an official confirmation of any transaction. Opinions, estimates and assumptions expressed herein are made as of the date of this communication and are subject to change without notice. This communication has been prepared based upon information, including market prices, data and other information, believed to be reliable; however, Trade Nation does not warrant its completeness or accuracy. All market prices and market data contained in or attached to this communication are indicative and subject to change without notice.

Recession searches spike on Google!!Good day traders and investors.,
The term recession has had a few spikes over the years since Google has been around, but what does it mean? These searches are typical made by the common folks.
Did the herd get it right this time?? Probably not, I have generally bet against them. The Google search trends has the data to back the information. Generally this means the bottom is either in or close. Also on two occasions there have been a couple of back to back spikes. Almost like one was a precursor.
You can see very clear in this naked chart of the DOW JONES, that only includes the GOOGLE TRENDS search of the term “RECESSION”. I have time aligned the GOOGLE TRENDS data to the DOW JONES it really shows a clear picture. The herd is always a day late and a dollar short. By the time they are searching it most of the pain is gone and the market is at or near a bottom. The only question that remains is, how long? If it lasts too long it could hurt any forward movement.
Let me know what you think
Kind regards,
WeAreSat0shi

DowJones INTRADAY Volatility ahead Fed Rate decisionAs the Federal Reserve wraps up its two-day meeting today, investors will be paying close attention to Chair Jerome Powell’s comments, as they could spark market volatility.
Although Powell recently stated that “the economy’s fine,” traders will closely examine his remarks and the updated forecasts (the dot plot) for any signs of concern. The Fed’s projections are expected to show slower economic growth while acknowledging persistent inflation. Typically, the Fed waits for clear changes in the data before taking more decisive action.
Key Support and Resistance Levels
Resistance Level 1: 42488
Resistance Level 2: 43067
Resistance Level 3: 43575
Support Level 1: 40657
Support Level 2: 40109
Support Level 3: 39584
This communication is for informational purposes only and should not be viewed as any form of recommendation as to a particular course of action or as investment advice. It is not intended as an offer or solicitation for the purchase or sale of any financial instrument or as an official confirmation of any transaction. Opinions, estimates and assumptions expressed herein are made as of the date of this communication and are subject to change without notice. This communication has been prepared based upon information, including market prices, data and other information, believed to be reliable; however, Trade Nation does not warrant its completeness or accuracy. All market prices and market data contained in or attached to this communication are indicative and subject to change without notice.

GOOGL, Short, 1D✅ GOOGL broke the key support at 166.25, confirming bearish momentum. The price is expected to decline further toward the next key support at 149.50.
SHORT 📉
✅ Like and subscribe to never miss a new analysis! ✅

DOW JONES INDEX (US30): Pullback From Resistance
Dow Jones Index looks bearish after a test of a key daily/intraday resistance.
An inverted cup & handle pattern on that on an hourly and a strong
intraday bearish momentum this morning leaves clear bearish clues.
I think that the market can retrace at least to 41580 support.
❤️Please, support my work with like, thank you!❤️

XAU/USD: Another ATH (All Time High) Ahead? (READ THE CAPTION)By analyzing the gold chart in the 2-hour timeframe, we can see that the price has finally made its big move, just as we predicted! After a correction to $2905, demand increased, pushing the price up by over 400 pips to $2949.
Currently, gold is trading around $2940, and there are two key scenarios:
1️⃣ Holding support at $2940, leading to a rise above $2950 as the first target.
2️⃣ Breaking below $2940 and stabilizing under it, which could trigger a further correction to $2923.
This analysis will be more complete with your support, and more details will be added soon!
Please support me with your likes and comments to motivate me to share more analysis with you and share your opinion about the possible trend of this chart with me !
Best Regards , Arman Shaban

Dow Holds Steady Above 41,000Unlike the Nasdaq and SP500, Dow did not trace the full potential of its double top formation between 2024 and 2025 peaks, yet in a similar manner to the US indices, it rebounded from the 0.618 Fibonacci retracement of the May 2024-Jan 2025 uptrend, coinciding with oversold levels on the 3-Day RSI previously seen in October 2023.
The Dow’s rebound from the 40,660 low aligns with the bottom end of the duplicated channel of its respected up-trend between May 2024 and Jan 2025, strengthening positive rebound opportunities in tandem with the broader market sentiment.
Should the Dow hold above the 41,000-mark, levels 41,700, 42,600, and 43,400 may come back to play. From the downside, a clean close back below the 40,600-mark can extend losses in the direction of the double top formation’s target, aligning with possible support levels at 40,200, 39,500, and 38,700.
Key Events to Watch:
- Trade war Developments
- FOMC Meeting on Wednesday
Written by Razan Hilal, CMT

US30 Rebounds from Key Support – Bulls Eyeing New HighsKey Support & Trendline Confluence:
The price recently bounced off the long-term ascending trendline, which has been a strong support level since late 2023.
The 38.2% Fibonacci retracement level ($40,205) provided additional confluence for a potential reversal.
Resistance Levels & Breakout Potential:
Immediate Resistance: $42,000 – A break above this level could confirm a bullish continuation.
Major Target: $45,065 – If momentum sustains, this all-time high could be tested soon.
Bullish Scenario:
A successful breakout above $42,000 could lead to an accelerated move toward $45,065 and beyond.
The trendline’s support indicates that bulls remain in control, and the recent rebound suggests renewed buying interest.
Risk Management & Confirmation:
Bullish confirmation: Sustained price action above $41,500 with strong volume.
Invalidation level: A breakdown below $40,000 could indicate a potential trend reversal.
Conclusion & Strategy:
Short-Term: Monitor price action around $42,000 for breakout confirmation.
Mid-Term: Expect a bullish move toward $45,000+ if the trendline holds.
Long-Term: If price breaks all-time highs, further upside potential is possible.
🚀 Bullish Confirmation Above $42,000 | ⚠️ Caution Below $40,000

DowJones The Week Ahead 17th March '25Dow INTRADAY bearish & oversold capped by resistance at 200 DMA
This communication is for informational purposes only and should not be viewed as any form of recommendation as to a particular course of action or as investment advice. It is not intended as an offer or solicitation for the purchase or sale of any financial instrument or as an official confirmation of any transaction. Opinions, estimates and assumptions expressed herein are made as of the date of this communication and are subject to change without notice. This communication has been prepared based upon information, including market prices, data and other information, believed to be reliable; however, Trade Nation does not warrant its completeness or accuracy. All market prices and market data contained in or attached to this communication are indicative and subject to change without notice.

Dow INTRADAY bearish & oversold capped by resistance at 41640Key Support and Resistance Levels
Resistance Level 1: 41640
Resistance Level 2: 41956
Resistance Level 3: 42450
Support Level 1: 40650
Support Level 2: 40080
Support Level 3: 39650
This communication is for informational purposes only and should not be viewed as any form of recommendation as to a particular course of action or as investment advice. It is not intended as an offer or solicitation for the purchase or sale of any financial instrument or as an official confirmation of any transaction. Opinions, estimates and assumptions expressed herein are made as of the date of this communication and are subject to change without notice. This communication has been prepared based upon information, including market prices, data and other information, believed to be reliable; however, Trade Nation does not warrant its completeness or accuracy. All market prices and market data contained in or attached to this communication are indicative and subject to change without notice.

AriasWave Market Update - You Might Want To Watch This... Part 1In this video, I'm finally breaking my silence. I can’t hold back my bearish outlook any longer, so I’m launching a series of videos to break down exactly why I see trouble ahead and what it could mean.
While I won’t cover everything in this first video, I’m kicking off the conversation now that the floodgates are open—thanks, in part, to the circus in Washington, D.C. (or so you think). From crypto and stocks to bond yields and beyond, I’ll cover it all.
Stay tuned so you’re not left chasing false hope in a dead-cat bounce.

Us30 Reversal /Re entry 📝 US30 (Dow Jones) - Bearish Outlook | 1H Chart 📉
🔹 Market Bias: Bearish
🔹 Key Zones:
Sell Entry: 40,850 - 41,100 (Retracement to resistance)
Stop Loss (SL): Above 41,250 (Beyond liquidity grab zone)
Take Profit (TP):
TP1: 40,500 (First support)
TP2: 40,250 (Key demand zone)
TP3: 39,920 (Final target)
🔹 Analysis:
Price is trading below the 50 & 200 EMA → Downtrend intact 📉
Lower highs & lower lows → Bearish market structure
Potential fakeout before the drop, especially around high-impact news at 4 PM SAST ⚠️
🔹 News Event Consideration:
If data is weak → US30 likely continues dropping 📉
If data is strong → Possible short-term spike before reversal 🔄
🔹 Risk Management:
Be cautious of stop hunts & manipulation before the news.
If price breaks above 41,250 & holds, reconsider bearish bias.
🚀 Trade smart, manage risk, and stay updated on market sentiment!
#US30 #DowJones #StockMarket #TechnicalAnalysis #Trading #PriceAction #Forex #Indices

Dow 200 Points from Major SupportThe Dow Jones is just about 200 points from major support. I should caution there's often a move through support and slightly below, but this is where all the buyers are.
(I should have drawn the arrow to hit the next major resistance/support around 2031 lol, but you get the idea)
Good luck!
Dow Just crossed the infamous 200MA - Should we worry?The Dow Jones, continues to underperform international markets in 2025.
The Trump Administration is an unstable one which is causing such fear and uncertainty.
It seems like the very essence of policies, procedures and compliance are falling out with the ad hoc and sudden decisions being made by a small group of plutocrats.
Here is why the Dow Jones might remain to stay in trouble and for further downside to come.
Tariff Tensions:
Trump's ramping up tariffs on Canadian metals, and it's freaking out investors 😱📉
Recession Fears:
Mixed signals about a possible recession have everyone on edge 😬🔻
Tech Trouble:
Tech giants like Tesla are tanking, dragging the whole market down 🤖📉
Global Trade Chaos:
Uncertain trade policies are stirring global chaos and confusion 🌍🤯
Market Volatility:
Investor nerves are sky-high with volatility spiking, making everyone super cautious 😟📈
And the technicals speak for themselves.
The Price has broken below the M FOrmation and wait for it... The Infamous 200MA.
So the signs of downside are strong. WIll the US markets allow such downside to come, we'll have to see but as things stand - we have a bearish outlook with a target of 36,296.
What do you think?
Disclosure: I am part of Trade Nation's Influencer program and receive a monthly fee for using their TradingView charts in my analysis.

DOW JONES: Starting the final stage of 3year Bull Cycle.Dow Jones got oversold on its 1D technical outlook (RSI = 29.297, MACD = -550.130, ADX = 76.606) as it is currently testing its 1W MA50. This is a level that has been intact since November 2023 and is of high importance to the trend as it has a key cyclical attribute. The driving growth pattern of Dow since the 2009 bottom is a Channel Up and every time a Bull Cycle starts, the 1W MA50 is the first level of support, with every touch of it being the strongest buy opportunity. When the 3 year Bull Cycle is coming to an end, the 1W MA50 breaks and the index approaches the 1M MA50 during its Bear Cycle correction, which becomes the ultimate buy entry for the new long term 3 year Bull Cycle.
The current Cycle should starts getting completed technically after September 2025, so there is a high chance that the 1W MA50 holds here. The three Bull Cycles we've had so far had a fairly similar growth percentage, rising by +70.38% to +76.64%. If the +70.38% minimum range is followed on the current (4th) Bull Cycle, then we're aiming at 48,000 (TP) towards the end of the year. The 1M CCI seems to be printing the exact same build up to the Bear Cycle as in the past.
## If you like our free content follow our profile to get more daily ideas. ##
## Comments and likes are greatly appreciated. ##

DOW-JONES INDEX BEARISH BREAKOUT|SHORT|
✅DOWJONES/US30 index is
Going down now and the price
Made a bearish breakout which
Is confirmed so we are bearish
Biased and we will be expecting
A further bearish continuation
SHORT🔥
✅Like and subscribe to never miss a new idea!✅
