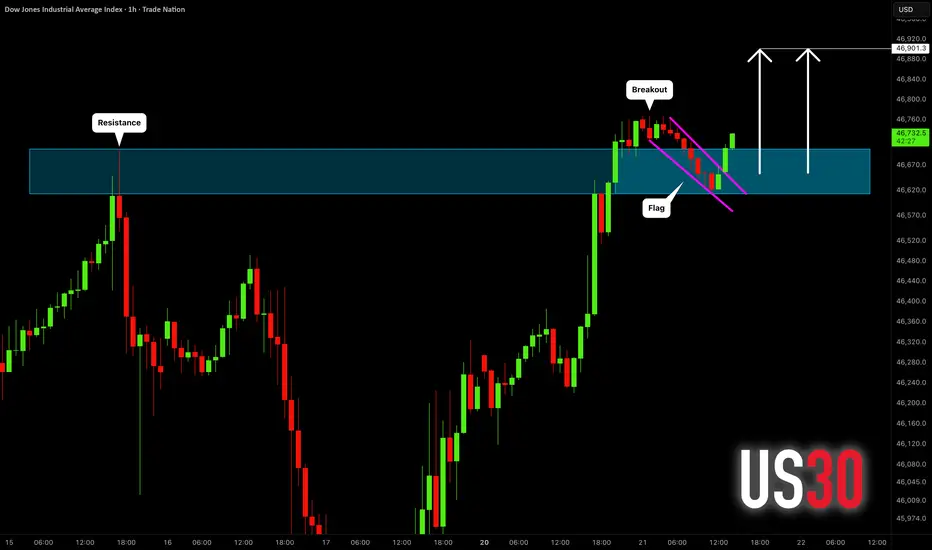
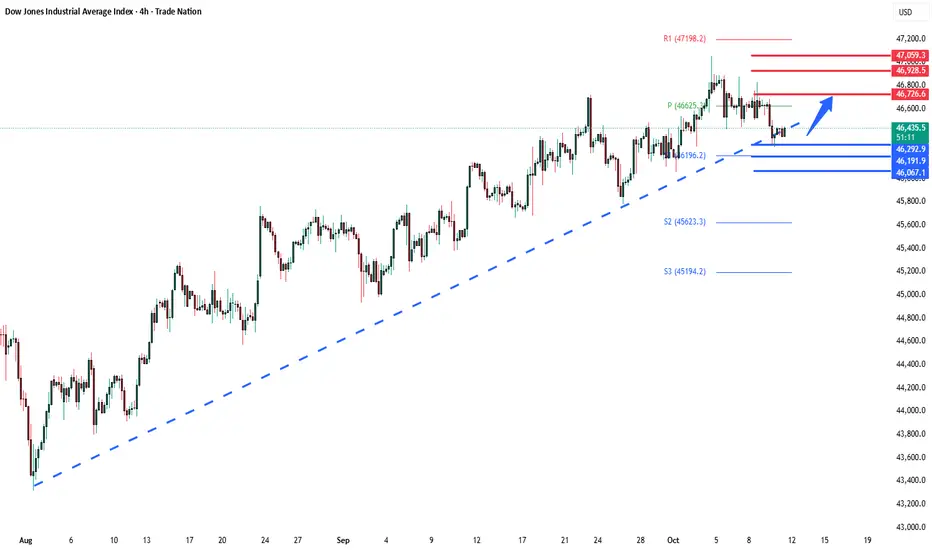
DOW JONES INDEX (US30): Bullish Continuation Confirmed
US30 index violated a major horizontal resistance yesterday.
The price started a correctional movement then, steadily
falling within a bullish flag pattern.
A breakout of its resistance line is a strong bullish signal.
Odds will be high, the index will hit 46900 level soon.
❤️Please, support my work with like, thank you!❤️
I am part of Trade Nation's Influencer program and receive a monthly fee for using their TradingView charts in my analysis.
Dowjones
US30 Eyes 46,600 Resistance as Correction Extends Within TrendHey Traders, in tomorrow’s trading session we are monitoring US30 for a potential selling opportunity around the 46,600 zone. The Dow Jones remains in a broader downtrend and is currently in a corrective phase, approaching a key resistance level aligned with the descending trendline.
Structure:
Price continues to form lower highs and lower lows, indicating persistent bearish momentum. The ongoing pullback toward 46,600 could offer a potential continuation setup in line with the prevailing downtrend.
Key level in focus:
46,600 — a significant resistance zone and trendline confluence area where sellers have previously regained control.
Fundamentals:
Market sentiment remains fragile as uncertainty over US fiscal policy and geopolitical risks weigh on risk assets, supporting potential downside pressure on the Dow.
Next move:
Watching for bearish confirmation signals near 46,600 — a rejection from this zone could open the door for a continuation toward recent lows.
Trade safe,
Joe.

DOW JONES INDUSTRIAL HIGH PROBABILITY SETUP SOON!!!🚨 DJ30 HIGH PROBABILITY SELL SETUP 🚨
* Here We Can See Clearly The Next Potential Move For US30 Coming Hours/Days.
* Keep Your Eyes Close On Your Trading Positions.
* Happy PIP Hunting Traders.
FXKILLA.

US banks on shaky ground Macro conditions are turning hostile. The commercial real estate market, especially office, is structurally impaired in certain segments. Vacancy rates in major US metros are above 20%. Office prices are down 30–40% from their 2022 peaks. With over $1.2 trillion in CRE debt maturing by 2027, refinancing risk is climbing, fast.
Wells Fargo is sitting in the crosshairs. Its latest earnings showed net interest income down 13% year-on-year. Revenue fell 6%. The top line is weakening just as credit risk is rising. Commercial loan charge-offs surged to $923 million in 2023, up from just $152 million the year before. That’s a sixfold increase.
Of that, the bulk came from office-related exposure. The bank has set aside more reserves, but at year-end 2023, its allowance for credit losses on commercial real estate was $1.9 billion, just 2.6% of its $72 billion CRE book. That ratio looks optimistic.
Wells Fargo’s total book value of equity stands at around $170 billion. If CRE losses reach 5–7% of the commercial book, well within historical stress-case scenarios, that implies $3.5 to $5 billion in write-downs. That’s a 2–3% direct hit to equity. Not catastrophic, but meaningful when earnings are already trending lower.
The risk isn’t just the loss itself, it’s the market response. Investors are not pricing in a deep CRE downturn. A fresh wave of write-offs could hit sentiment and compress the stock’s valuation multiple. In a rising loss cycle, confidence matters more than capital ratios.
Until we see a reset in CRE values or more aggressive derisking from management, the stock remains vulnerable. The earnings outlook is soft. The balance sheet is exposed. This is a short or, at best, an underweight.
The forecasts provided herein are intended for informational purposes only and should not be construed as guarantees of future performance. This is an example only to enhance a consumer's understanding of the strategy being described above and is not to be taken as Blueberry Markets providing personal advice.

Dow oversold bounce back supported at 45379Key Support and Resistance Levels
Resistance Level 1: 46297
Resistance Level 2: 46485
Resistance Level 3: 46695
Support Level 1: 45379
Support Level 2: 45205
Support Level 3: 45030
This communication is for informational purposes only and should not be viewed as any form of recommendation as to a particular course of action or as investment advice. It is not intended as an offer or solicitation for the purchase or sale of any financial instrument or as an official confirmation of any transaction. Opinions, estimates and assumptions expressed herein are made as of the date of this communication and are subject to change without notice. This communication has been prepared based upon information, including market prices, data and other information, believed to be reliable; however, Trade Nation does not warrant its completeness or accuracy. All market prices and market data contained in or attached to this communication are indicative and subject to change without notice.

Bearish drop?Dow Jones (US30) could rise to the pivot, whichis a pullback resistance and could reverse to the 1st support.
Pivot: 46,211.80
1st Support: 45,274.72
1st Resistance: 46,876.77
Disclaimer:
The above opinions given constitute general market commentary, and do not constitute the opinion or advice of IC Markets or any form of personal or investment advice.
Any opinions, news, research, analyses, prices, other information, or links to third-party sites contained on this website are provided on an "as-is" basis, are intended only to be informative, is not an advice nor a recommendation, nor research, or a record of our trading prices, or an offer of, or solicitation for a transaction in any financial instrument and thus should not be treated as such. The information provided does not involve any specific investment objectives, financial situation and needs of any specific person who may receive it. Please be aware, that past performance is not a reliable indicator of future performance and/or results. Past Performance or Forward-looking scenarios based upon the reasonable beliefs of the third-party provider are not a guarantee of future performance. Actual results may differ materially from those anticipated in forward-looking or past performance statements. IC Markets makes no representation or warranty and assumes no liability as to the accuracy or completeness of the information provided, nor any loss arising from any investment based on a recommendation, forecast or any information supplied by any third-party.

US30 Trade Plan – Range Breakout + Smart Money ManipulationI’m currently watching the US30 (Dow Jones Index) 🏦. On the 4-hour timeframe, we can see a strong uptrend forming — higher highs and higher lows 📈. Whether this trend continues remains to be seen, but having a solid trading plan is key ✅.
Here’s mine: On the 30-minute timeframe, price is currently moving within a defined range. If we see a break above the range, followed by a retracement and failed retest of the range high, I’ll be looking for a long opportunity 🚀.
If price instead breaks below the range, there could also be a short opportunity, though my preference is to stay long given the higher-timeframe bullish structure ⚙️.
⚠️ Keep an eye out for market manipulation — smart money algorithms often trigger fake breakouts to draw in buyers before sweeping liquidity and continuing the move. Stay alert and manage risk carefully.
📉 Disclaimer: This content is for educational purposes only and not financial advice.

US30 Short From Resistance!
HI,Traders !
#US30 went up sharply
But the price will soon hit
A wide horizontal resistance
Of 46641.8 from where we will
Be expecting a pullback and
A local move down !
Comment and subscribe to help us grow !

The ugliest crash in our history close? I truly believe with western powers developing digital IDs and other technology, etc. to monitor and control the public... and in some cases replace the human race... it's in line with what I believe will be one of the biggest market crashes in human history, equal or bigger to 1929.
GET READY.
IT WILL HAPPEN WITHIN THE BLACK ZONE.
The powers in control know!
The 2030 Agenda is prepared for this.
And they are keeping the public distracted.
History repeats!
There is a purpose to everything!

DowJones retest of pivotal 46680 level? Key Support and Resistance Levels
Resistance Level 1: 46680
Resistance Level 2: 46875
Resistance Level 3: 47060
Support Level 1: 46190
Support Level 2: 45965
Support Level 3: 45700
This communication is for informational purposes only and should not be viewed as any form of recommendation as to a particular course of action or as investment advice. It is not intended as an offer or solicitation for the purchase or sale of any financial instrument or as an official confirmation of any transaction. Opinions, estimates and assumptions expressed herein are made as of the date of this communication and are subject to change without notice. This communication has been prepared based upon information, including market prices, data and other information, believed to be reliable; however, Trade Nation does not warrant its completeness or accuracy. All market prices and market data contained in or attached to this communication are indicative and subject to change without notice.
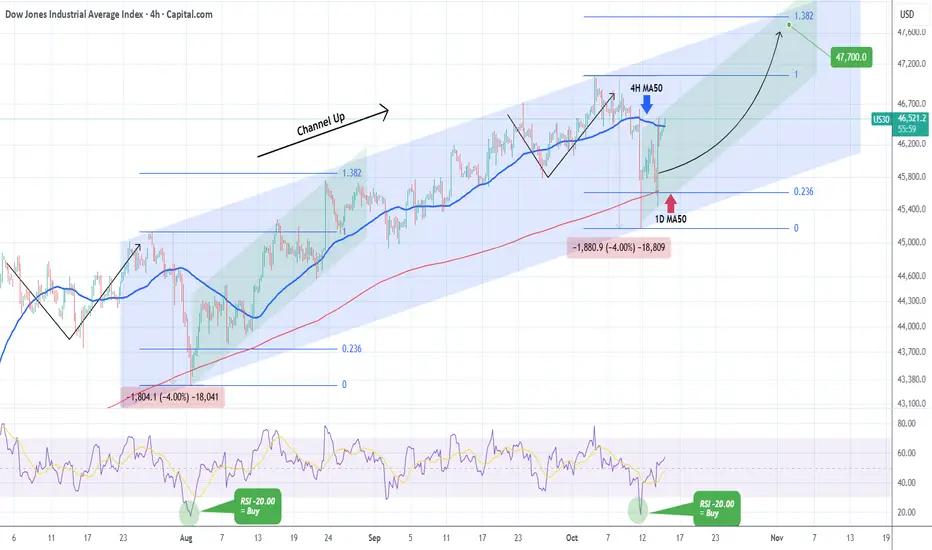
DOW JONES bounced at the bottom of the Channel Up. Buy signal.Dow Jones (DJI) has been trading within a 3-month Channel Up, with last Friday's flash crash breaching marginally below its 1D MA50 (red trend-line). That touched the bottom of the pattern and is technically a Higher Low, identical to the what the previous Bearish Leg did on the August 01 Low.
As you can see both Legs declined by -4.00% with their 4H RSIs touching the -20.00 level and rebounded. That is a technical Buy Signal, the strongest you can get within this Channel Up, and as long as the pattern's bottom holds, we expect another rise to the 1.382 Fibonacci extension (Our Target is 47700), similar to August's Bullish Leg.
-------------------------------------------------------------------------------
** Please LIKE 👍, FOLLOW ✅, SHARE 🙌 and COMMENT ✍ if you enjoy this idea! Also share your ideas and charts in the comments section below! This is best way to keep it relevant, support us, keep the content here free and allow the idea to reach as many people as possible. **
-------------------------------------------------------------------------------
💸💸💸💸💸💸
👇 👇 👇 👇 👇 👇
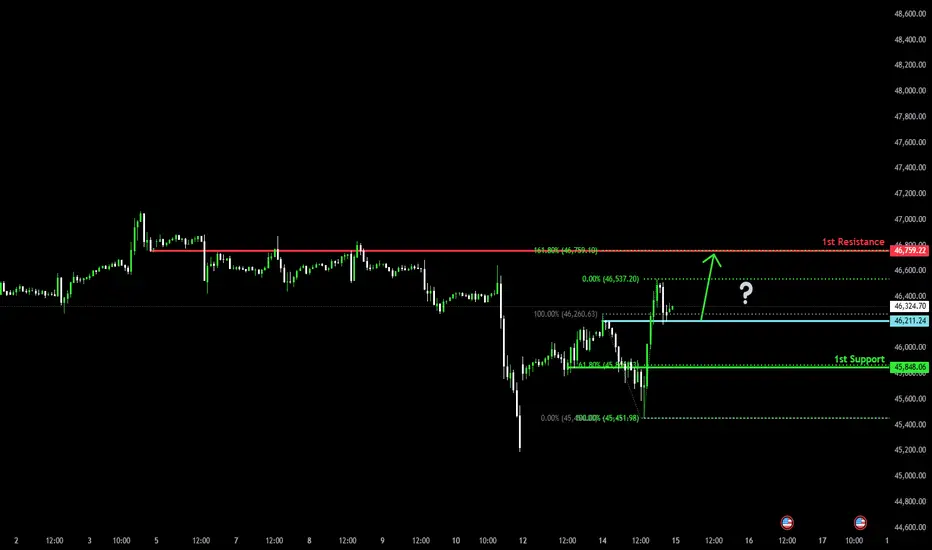
Bullish momentum to extend?Dow Jones (US30) is reacting off the pivot, which acts as a pullback support and could rise to the 1st resistance that aligns with the 161.8% Fibonacci extension.
Pivot: 46,211.24
1st Support: 45,848.06
1st Resistance: 45,759.22
Disclaimer:
The above opinions given constitute general market commentary, and do not constitute the opinion or advice of IC Markets or any form of personal or investment advice.
Any opinions, news, research, analyses, prices, other information, or links to third-party sites contained on this website are provided on an "as-is" basis, are intended only to be informative, is not an advice nor a recommendation, nor research, or a record of our trading prices, or an offer of, or solicitation for a transaction in any financial instrument and thus should not be treated as such. The information provided does not involve any specific investment objectives, financial situation and needs of any specific person who may receive it. Please be aware, that past performance is not a reliable indicator of future performance and/or results. Past Performance or Forward-looking scenarios based upon the reasonable beliefs of the third-party provider are not a guarantee of future performance. Actual results may differ materially from those anticipated in forward-looking or past performance statements. IC Markets makes no representation or warranty and assumes no liability as to the accuracy or completeness of the information provided, nor any loss arising from any investment based on a recommendation, forecast or any information supplied by any third-party.
Dow Jones Returns to the 46,000 Level Since the beginning of the week, the Dow Jones Index has maintained a notable bullish bias, extending a two-day winning streak as the equity benchmark posts a gain of around 2.20% in the short term. For now, buying pressure has supported the price recovery following the sharp correction seen last Friday, which was triggered by the escalation of trade tensions between China and the United States.
Although no major trade agreement has been announced, the aggressive tone of the tariff threats appears to have eased slightly, helping the market regain confidence in the short term. However, it’s important to note that if tensions escalate again, the Dow Jones could once more show heightened sensitivity to such developments, quickly reactivating selling pressure in the coming trading sessions.
Uptrend at Risk
The uptrend line, which had been sustained through much of 2025, has started to weaken following last Friday’s sharp correction. As a result, the average bullish momentum has entered a neutral zone in the short term. Currently, there is a recovery attempt from the previous downward move, though it has not yet been strong enough to bring prices back to recent highs.
If buying pressure fails to remain decisive over the next few sessions, a period of market indecision could emerge, potentially leading to a sideways range in the short term.
RSI
The RSI line continues to hover around the 50 level, reflecting a neutral momentum over the past 14 sessions. As long as the indicator stays within this range, neutrality may dominate the market bias, leading to indecisive price movements in the coming days.
MACD
The MACD histogram also remains near the neutral (0) level, indicating that there is no clear directional strength in short-term moving averages. This reinforces the idea of indecision in the market, suggesting that the price action may remain range-bound without a defined trend in the near term.
Key Levels to Watch:
46,790 points – Major Resistance: Corresponds to the all-time high area of the index. Buying activity approaching or surpassing this level could reactivate the bullish trend and establish a dominant buying bias.
45,741 points – Near-Term Barrier: Aligns with the 50-period simple moving average. As long as prices continue to fluctuate around this level, a new short-term consolidation range could form.
44,834 points – Critical Support: Represents the most stable neutral zone in recent weeks and coincides with the Ichimoku cloud boundary in the short term. A decisive break below this level could trigger a stronger bearish bias, putting the year-long uptrend at risk and potentially signaling the start of a new downward phase in the short term.
Written by Julian Pineda, CFA – Market Analyst

DowJones trend change? Key resistance zone at 46262Key Support and Resistance Levels
Resistance Level 1: 46262
Resistance Level 2: 46476
Resistance Level 3: 46700
Support Level 1: 45433
Support Level 2: 45253
Support Level 3: 45025
This communication is for informational purposes only and should not be viewed as any form of recommendation as to a particular course of action or as investment advice. It is not intended as an offer or solicitation for the purchase or sale of any financial instrument or as an official confirmation of any transaction. Opinions, estimates and assumptions expressed herein are made as of the date of this communication and are subject to change without notice. This communication has been prepared based upon information, including market prices, data and other information, believed to be reliable; however, Trade Nation does not warrant its completeness or accuracy. All market prices and market data contained in or attached to this communication are indicative and subject to change without notice.

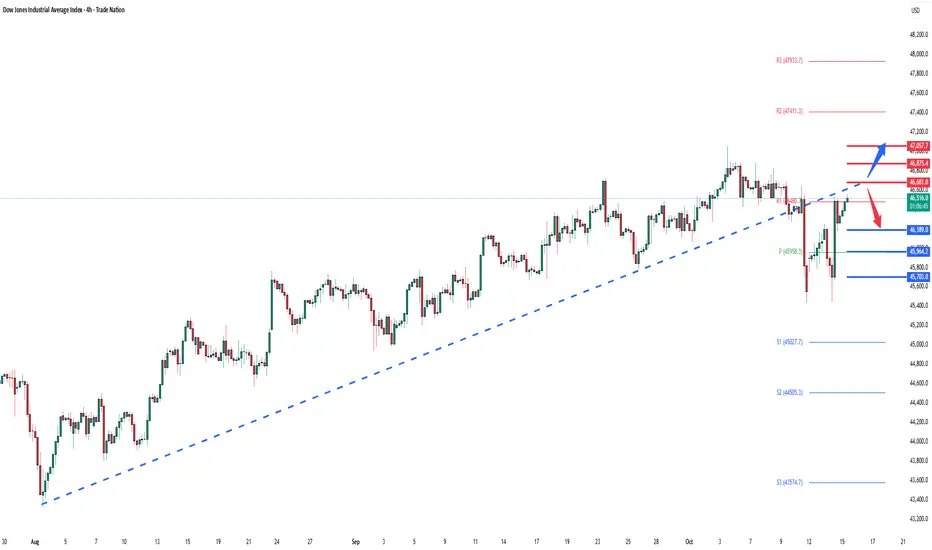
Dow Jones - Looking To Sell Pullbacks In The Short TermH4 - Strong bearish move.
Uptrend line breakout.
No opposite signs.
Currently it looks like a pullback is happening.
Expecting bearish continuation after pullback until the strong resistance zone holds.
If you enjoy this idea, don’t forget to LIKE 👍, FOLLOW ✅, SHARE 🙌, and COMMENT ✍! Drop your thoughts and charts below to keep the discussion going. Your support helps keep this content free and reach more people! 🚀

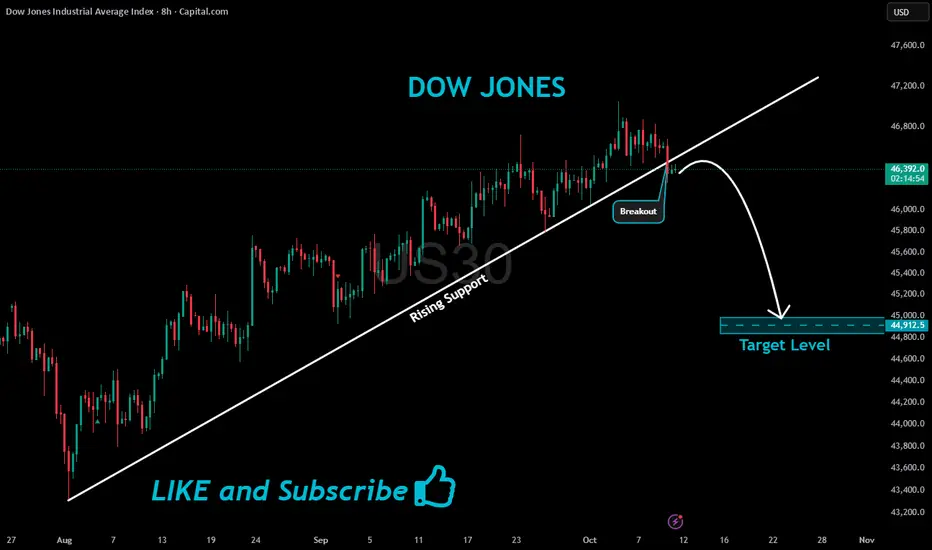
US30 Bearish Breakout!
HI,Traders !
#US30 made a bearish
Breakout of the rising support
Line and we are bearish biased
So we will be expecting a
Further bearish move down !
Comment and subscribe to help us grow !
DowJones key trading levels Friday 10th OctoberKey Support and Resistance Levels
Resistance Level 1: 46726
Resistance Level 2: 46930
Resistance Level 3: 47060
Support Level 1: 46290
Support Level 2: 46190
Support Level 3: 46070
This communication is for informational purposes only and should not be viewed as any form of recommendation as to a particular course of action or as investment advice. It is not intended as an offer or solicitation for the purchase or sale of any financial instrument or as an official confirmation of any transaction. Opinions, estimates and assumptions expressed herein are made as of the date of this communication and are subject to change without notice. This communication has been prepared based upon information, including market prices, data and other information, believed to be reliable; however, Trade Nation does not warrant its completeness or accuracy. All market prices and market data contained in or attached to this communication are indicative and subject to change without notice.
Dow Jones v/s Gold Ratio — History Repeating?Currently both DJI & Gold are at there peak levels, but the ratio has already breached a historical support, signaling further downfall.
Whenever the Dow-to-Gold ratio tests or breaks the 12.0 level, stories are created in history.
* 1929: Great Depression hit — stocks crashed, gold outperformed.
* 1973: Oil shock & stagflation — gold surged as inflation soared.
* 2008: Global Financial Crisis — stocks collapsed, gold became the safe haven.
- 2020: COVID tested the level but failed to break it.
Now, in 2025, the ratio has again breached the historic level of 12.0 — the same zone that preceded past market meltdowns.
Each time stocks looked strong relative to gold, the cycle turned
* Gold rallied.
- Stocks corrected.
----------------------------------------------------------------------------------------------------------------
What is the Dow-to-Gold Ratio?
Dow/Gold Ratio = Value of Dow Jones Index ÷ Price of Gold (per ounce)
This ratio tells us how many ounces of gold it takes to buy one unit of the Dow Jones Industrial Average.
For example:
If Dow = 46,000 and Gold = 4000 → Ratio = 11.5.
That means it takes 11.5 ounces of gold to buy one unit of Dow.
If the ratio falls to 6, which the chart is signaling, then it will mean:
1. Stocks might weaken or
2. Gold might become stronger or
3. If both weaken, then stocks will fall more than gold
----------------------------------------------------------------------------------------------------------------
Interpretation
1. Whenever the ratio is high, it means stocks are expensive compared to gold (risk-on period) .
2. Whenever the ratio falls, it means gold is outperforming stocks (risk-off, crisis or correction phase) .
Overall, the Dow to Gold ratio suggests that this is not a normal period - a period of crisis & correction - a risk-off period
Each time this ratio reached around current levels, a major stock market downturn followed

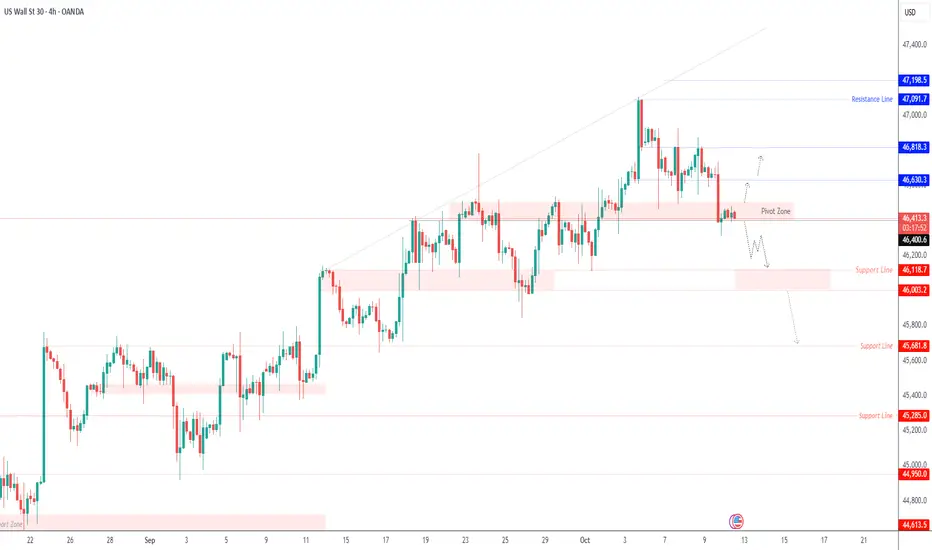
US30 – Key Pivot Test at 46,400 Before Directional BreakoutUS30 – Overview | Key Levels in Focus Before Next Move
The Dow Jones remains in a consolidation phase, awaiting a clear breakout signal as traders weigh broader U.S. market uncertainty.
The price is holding around a key technical zone, with 46,400 acting as the short-term pivot between bullish and bearish momentum.
Technical Outlook
A 1H close below 46,400 would confirm a bearish continuation, targeting 46,120 → 46,000, and a sustained break below this zone could extend toward 45,680.
On the other hand, if the price closes above 46,510, it would reinforce bullish momentum toward 46,630 → 46,810, with potential to test 47,090 if buying pressure strengthens.
Pivot Line: 46,400
Resistance: 46,630 · 46,810 · 47,090
Support: 46,120 · 46,000 · 45,680
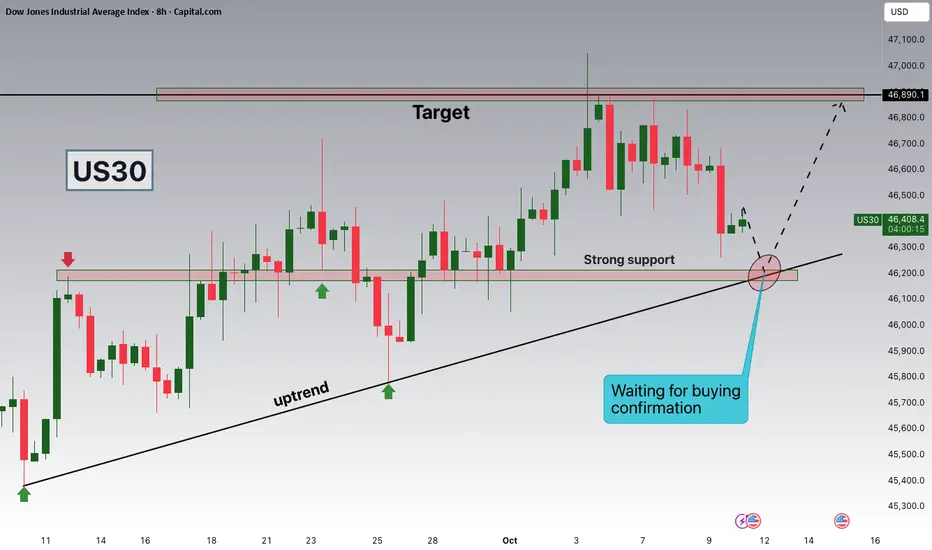
US30 Eyes 46,200 Support as Bulls Prepare for Next Leg Higher!Hey Traders,
In today’s session, we’re monitoring US30 for a potential buying opportunity around the 46,200 zone. The Dow Jones remains within a clear uptrend, and price is currently in a healthy correction phase, approaching a key confluence of support and trendline structure near 46,200.
A sustained reaction from this level could signal a continuation of bullish momentum in the broader equity market.
Trade safe,
Joe.
DowJones consolidation supported at 46420Key Support and Resistance Levels
Resistance Level 1: 46930
Resistance Level 2: 47060
Resistance Level 3: 47200
Support Level 1: 46420
Support Level 2: 46290
Support Level 3: 46190
This communication is for informational purposes only and should not be viewed as any form of recommendation as to a particular course of action or as investment advice. It is not intended as an offer or solicitation for the purchase or sale of any financial instrument or as an official confirmation of any transaction. Opinions, estimates and assumptions expressed herein are made as of the date of this communication and are subject to change without notice. This communication has been prepared based upon information, including market prices, data and other information, believed to be reliable; however, Trade Nation does not warrant its completeness or accuracy. All market prices and market data contained in or attached to this communication are indicative and subject to change without notice.

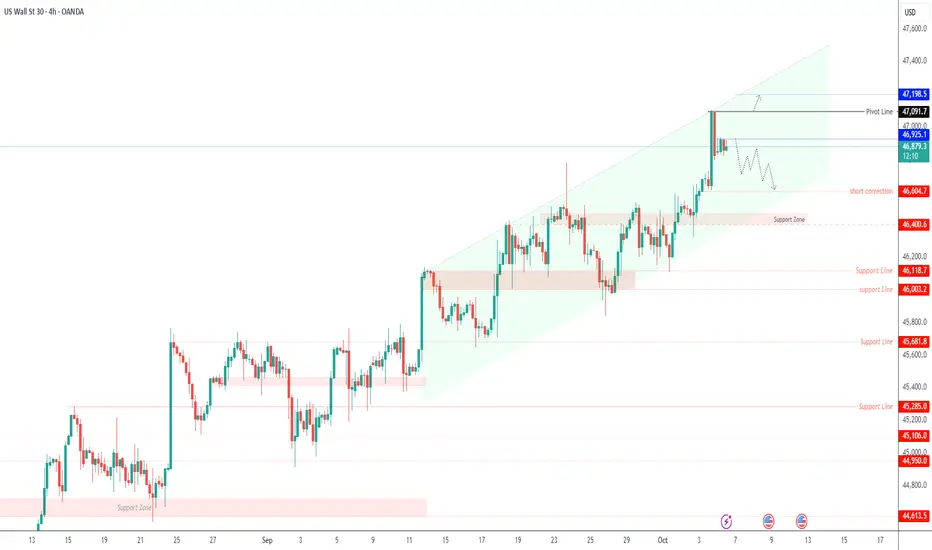
US30 – Short-Term Correction Expected After Record HighUS30 – Overview
The Dow Jones reached a new record high, but now shows signs of a short-term correction before the next move.
A minor pullback toward 46,680–46,610 is possible before the next directional breakout.
Technical Outlook
A break below 46,400 would confirm a shift to a bearish trend, with potential downside continuation.
On the other hand, a confirmed break above 46,925 would reinforce the bullish momentum, targeting 47,090 → 47,200 in extension.
Pivot: 46,925
Support: 46,680 – 46,600 – 46,400
Resistance: 47,090 – 47,200 – 47,350
DowJones Key trading levels ahead of FOMC minutesKey Support and Resistance Levels
Resistance Level 1: 46930
Resistance Level 2: 47060
Resistance Level 3: 47200
Support Level 1: 46420
Support Level 2: 46290
Support Level 3: 46190
This communication is for informational purposes only and should not be viewed as any form of recommendation as to a particular course of action or as investment advice. It is not intended as an offer or solicitation for the purchase or sale of any financial instrument or as an official confirmation of any transaction. Opinions, estimates and assumptions expressed herein are made as of the date of this communication and are subject to change without notice. This communication has been prepared based upon information, including market prices, data and other information, believed to be reliable; however, Trade Nation does not warrant its completeness or accuracy. All market prices and market data contained in or attached to this communication are indicative and subject to change without notice.
