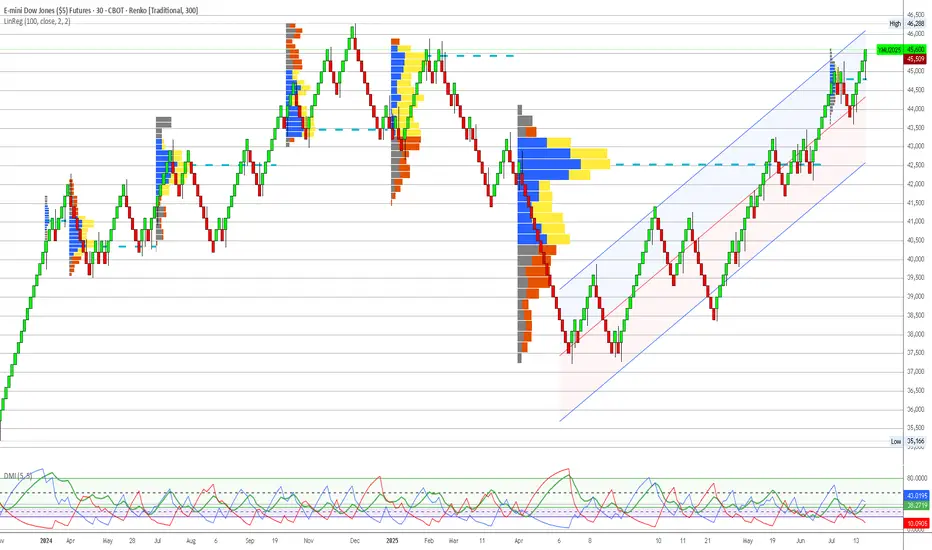
DOW JONES close to a Triangle break-out leading to 47500!Dow Jones (DJI) has been trading within a Channel Up pattern since April 24. Following the August 21 Low, it entered a short-term Ascending Triangle pattern, looking identical to May - June, which also started after a 4H MA50 (blue trend-line) test.
That pattern was a re-Accumulation phase, which after breaking upwards pushed the price just below its 2.5 Fibonacci extension.
With also similar 4H RSI sequences, we expect a similar reaction upon a Triangle break-out, targeting 47500 (Fib 2.5 extension).
-------------------------------------------------------------------------------
** Please LIKE 👍, FOLLOW ✅, SHARE 🙌 and COMMENT ✍ if you enjoy this idea! Also share your ideas and charts in the comments section below! This is best way to keep it relevant, support us, keep the content here free and allow the idea to reach as many people as possible. **
-------------------------------------------------------------------------------
💸💸💸💸💸💸
👇 👇 👇 👇 👇 👇
Dowjones

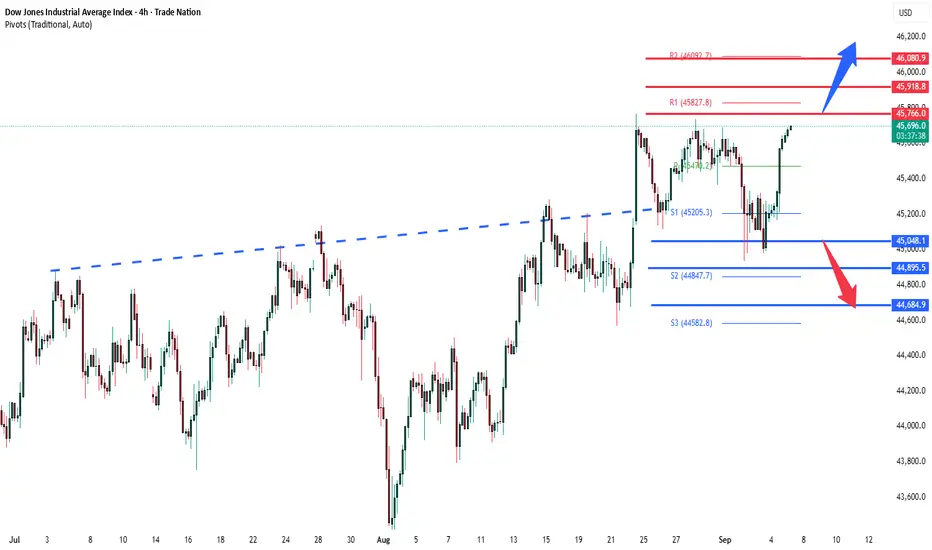
DowJones important support at 45190Key Support and Resistance Levels
Resistance Level 1: 45800
Resistance Level 2: 46000
Resistance Level 3: 46200
Support Level 1: 45190
Support Level 2: 44960
Support Level 3: 44720
This communication is for informational purposes only and should not be viewed as any form of recommendation as to a particular course of action or as investment advice. It is not intended as an offer or solicitation for the purchase or sale of any financial instrument or as an official confirmation of any transaction. Opinions, estimates and assumptions expressed herein are made as of the date of this communication and are subject to change without notice. This communication has been prepared based upon information, including market prices, data and other information, believed to be reliable; however, Trade Nation does not warrant its completeness or accuracy. All market prices and market data contained in or attached to this communication are indicative and subject to change without notice.

US30 Strategy: Sideways Range, Liquidity Run, and Entry Zones📊 Dow Jones (US30) Update 📊
The Dow Jones (US30) is currently bullish 🟢📈 and pushing higher on the 4H timeframe ⏰. We can see a value area forming 🏦, with price ranging sideways 🔄 and building liquidity above and below the range 💧.
My plan is to watch for a potential liquidity run above the range 🚀, followed by a deep pullback 🔽 that could present a high-probability entry opportunity 🎯.
⚠️ This outlook is for educational purposes only and not financial advice. 📚

Dow Jones (YM) - Technical Analysis Report - 20250908Analysis Date: September 8, 2025
Current Price: 45,537
Market Session: Post-Market Analysis
---
Executive Summary
Dow Jones presents a moderately extended equity position with manageable risk characteristics compared to other major indices. While trading above institutional accumulation levels, the extension is less severe than S&P 500 or Nasdaq, making it the least dangerous of the equity exposures. However, institutional positioning analysis reveals limited upside potential with asymmetric risk favoring defensive strategies.
---
Quarterly Volume Profile Analysis
Institutional Positioning Intelligence
The quarterly volume profile (Q3 2025) reveals a concerning pattern typical of extended equity markets in late-cycle environments:
Primary Institutional Activity Zone: 42,000-43,500
Moderate blue volume concentration representing historical institutional positioning
Current price (45,537) trades approximately 2,000+ points above primary accumulation
Volume density significantly lighter than commodity accumulation patterns
Institutional activity appears distributed rather than concentrated
Extension Analysis:
Core Accumulation: 42,500-43,000 (peak institutional activity)
Extended Zone: 43,500-44,500 (moderate institutional interest)
Current Level: 45,537 (approximately 5-7% above institutional positioning)
Void Risk: Above 46,000 (minimal institutional support visible)
Resistance Structure Analysis:
45,800-46,200: Immediate resistance with mixed volume activity
46,500-47,000: Historical distribution zones from previous highs
47,500+: Complete institutional void representing extreme overextension
Price Structure Context
Historical Pattern Recognition:
The current Dow Jones setup displays classic late-cycle equity characteristics where price has methodically ground higher above institutional accumulation zones. Unlike the catastrophic voids seen in S&P 500 and Nasdaq, YM shows a more measured extension that may be sustainable in the near term.
Relative Risk Assessment:
Manageable Extension: 5-7% above institutional levels vs 15%+ in other indices
Blue-Chip Nature: Dow composition includes more defensive, dividend-paying companies
Institutional Memory: Historical support levels around 42,000-43,000 well-established
Risk Definition: Clear institutional boundaries provide defensive positioning reference
Sector Composition Considerations
Dow Jones Defensive Characteristics:
Utilities and consumer staples providing defensive anchor
Financial sector exposure to interest rate sensitivity
Industrial components reflecting economic cycle positioning
Technology weight lower than growth-focused indices
---
Execution Chart Technical Analysis
Current Technical Configuration - DETERIORATING MOMENTUM
DEMA Analysis - WARNING SIGNALS EMERGING:
Black Line (Fast DEMA 12): Currently at 45,537
Orange Line (Slow DEMA 20): Currently at 45,480
Configuration: Bullish but narrowing gap indicating momentum loss
Trend Bias: Technical momentum weakening despite bullish configuration
DMI/ADX Assessment - MOMENTUM DETERIORATION:
ADX Level: Declining from previous highs, currently around 25-30
+DI vs -DI: +DI losing dominance, -DI starting to gain ground
Momentum Direction: Showing signs of exhaustion after extended advance
Trend Strength: Weakening ADX suggests institutional conviction fading
Stochastic Analysis - OVERBOUGHT CONDITIONS:
Tactical Stochastic (5,3,3): Overbought territory with negative divergence
Strategic Stochastic (50,3,3): Extended levels showing momentum fatigue
Divergence Analysis: Price making new highs while momentum indicators lag
Support and Resistance Levels
Critical Technical Levels:
Current Resistance: 45,800 (near-term extension limit)
Key Resistance: 46,200 (major resistance zone)
Major Resistance: 46,800 (dangerous overextension territory)
Immediate Support: 45,200 (DEMA cluster)
Key Support: 44,500 (institutional extension boundary)
Major Support: 42,500-43,000 (primary institutional accumulation)
---
Trading Scenarios and Setup Criteria
Scenario 1: Defensive Profit-Taking Setup (PRIMARY)
Optimal Conditions for Position Reduction:
DEMA momentum loss: Gap narrowing between black and orange lines
DMI deterioration: -DI gaining on +DI with weakening ADX
Stochastic overbought: Both timeframes showing exhaustion signals
Volume analysis: Declining volume on any advance attempts
Resistance respect: Failure to break above 46,000 cleanly
Profit-Taking Protocol:
Primary Action: Reduce positions by 50-75% at current levels
Secondary Reduction: Complete exit on any bounce to 46,000+
Stop Management: Trail stops using 300-point intervals
Cash Allocation: Redirect capital to commodity opportunities
Scenario 2: Range-Trading Setup (SECONDARY)
Conditions for Tactical Range Trading:
Defined range: 44,500-45,800 (institutional boundary to resistance)
DEMA maintaining bullish bias within range
Volume profile respect at key levels
ADX below 25 indicating sideways consolidation
Range Trading Parameters:
Long Zone: 44,500-44,800 (institutional boundary approach)
Short Zone: 45,600-45,800 (resistance approach)
Stop Distance: 300-450 points maximum
Position Size: Reduced allocation (1% account risk maximum)
Scenario 3: Breakdown Short Setup (AGGRESSIVE)
Short Entry Conditions:
DEMA bearish crossover: Black line breaking below orange line
Support violation: Break below 44,500 institutional boundary
Volume confirmation: Increased volume supporting breakdown
DMI alignment: -DI gaining clear dominance over +DI
Short Setup Parameters:
Entry Range: 44,200-44,400 on confirmed breakdown
Stop Loss: Above 45,000 (failed breakdown)
Targets: 43,000, 42,500, 42,000 (institutional accumulation zones)
Risk Management: Tight stops given counter-trend positioning
---
Risk Management Protocols
Position Sizing Guidelines
Conservative Approach (Strongly Recommended):
Maximum Risk: 1% of account (reduced from standard due to extension risk)
Contract Calculation: Account Size × 0.01 ÷ (Stop Distance × $5)
Example: $100,000 account with 400-point stop = 50 contracts maximum
Rationale: Extended positioning requires defensive allocation
Stop Loss Hierarchy
Tactical Stop: 45,000 (execution chart support cluster)
Strategic Stop: 44,500 (institutional extension boundary)
Emergency Stop: 43,800 (institutional accumulation approach)
Portfolio Management Framework
Defensive Positioning Strategy:
Current Holdings: Reduce exposure by 50-75%
New Positions: Avoid until return to institutional levels
Capital Reallocation: Redirect to commodity opportunities (NG, CL)
Monitoring Frequency: Daily assessment of momentum deterioration
---
Market Context and External Factors
Fundamental Considerations Affecting Dow Performance
Economic Cycle Positioning:
Federal Reserve policy uncertainty affecting financial sector components
Industrial sector sensitivity to economic slowdown concerns
Consumer discretionary weakness impacting retail components
Utility sector providing defensive characteristics in uncertain environment
Sector Rotation Implications:
Value vs growth rotation potentially favoring Dow components
Dividend yield advantage in higher interest rate environment
Defensive sector weighting providing relative outperformance potential
International exposure through multinational components
Technical Market Structure
Relative Performance Analysis:
Outperforming S&P 500 and Nasdaq on risk-adjusted basis
Less extended from institutional levels than growth indices
Better volume profile support at key technical levels
Defensive sector composition providing downside protection
---
Monitoring Checklist and Alert Levels
Daily Monitoring Requirements
DEMA Configuration: Watch for gap narrowing or bearish crossover
Institutional Respect: Monitor behavior at 44,500 extension boundary
Volume Analysis: Track volume patterns on any advance attempts
Sector Rotation: Monitor defensive vs growth sector performance
Correlation Analysis: Track relationship with bond yields and dollar strength
Critical Alert Levels
Risk Escalation Alerts:
DEMA bearish crossover below 45,400
Break below 44,500 institutional extension boundary
Volume breakdown with accelerating selling pressure
ADX rising with -DI dominance confirming bearish momentum
Defensive Action Triggers:
Any failure to break above 46,000 on multiple attempts
Stochastic negative divergence with price at new highs
Sector rotation away from Dow components toward defensives
Federal Reserve policy announcements affecting interest rate expectations
---
Strategic Outlook and Risk Assessment
Risk/Reward Analysis
Asymmetric Risk Profile:
Upside Potential: Limited 500-800 points to dangerous overextension
Downside Risk: 2,000+ points to institutional accumulation zones
Risk/Reward Ratio: Unfavorable 1:3+ downside vs upside
Probability Assessment: Moderate (40%) for further upside, High (70%) for correction
Portfolio Allocation Recommendation
Defensive Positioning Required
Dow Jones represents the least dangerous equity exposure in current market conditions but still requires defensive management. The 5-7% extension above institutional levels, while manageable compared to other indices, suggests limited upside potential with significant correction risk. Priority should be placed on systematic profit-taking and capital reallocation to higher-conviction commodity opportunities.
Allocation Framework:
Current Portfolio Weight: Reduce to 5-8% maximum (from previous levels)
Entry Method: Avoid new positions until institutional level return
Hold Period: Short-term tactical only, exit on weakness
Exit Strategy: Systematic reduction on any bounce attempts
---
Conclusion and Strategic Assessment
Dow Jones offers the best risk profile among equity indices but remains fundamentally challenged by extension above institutional positioning. The defensive sector composition and less severe overextension provide relative safety, but the asymmetric risk profile strongly favors capital preservation over growth seeking. Current conditions warrant defensive positioning with readiness to exit entirely on any momentum deterioration.
Strategic Priority: Capital preservation and systematic risk reduction while maintaining readiness for complete exit if institutional extension boundaries are violated.
Next Review: Daily monitoring of momentum indicators and institutional level approach
Position Management: Systematic profit-taking with defensive stop management
---
Important Disclaimer
Risk Warning and Educational Purpose Statement
This analysis is provided for educational and informational purposes only and does not constitute financial advice, investment recommendations, or trading signals. All trading and investment decisions are solely the responsibility of the individual trader or investor.
Key Risk Considerations:
Futures trading involves substantial risk of loss and is not suitable for all investors
Past performance does not guarantee future results
Market conditions can change rapidly, invalidating any analysis
Leverage can amplify both profits and losses significantly
Individual financial circumstances and risk tolerance vary greatly
Professional Guidance: Before making any trading decisions, consult with qualified financial advisors, conduct your own research, and ensure you fully understand the risks involved. Only trade with capital you can afford to lose.
Methodology Limitations: Volume profile analysis and technical indicators are tools for market assessment but are not infallible predictors of future price movement. Market dynamics include numerous variables that cannot be fully captured in any single analytical framework.
The views and analysis presented represent one interpretation of market data and should be considered alongside other forms of analysis and individual judgment.
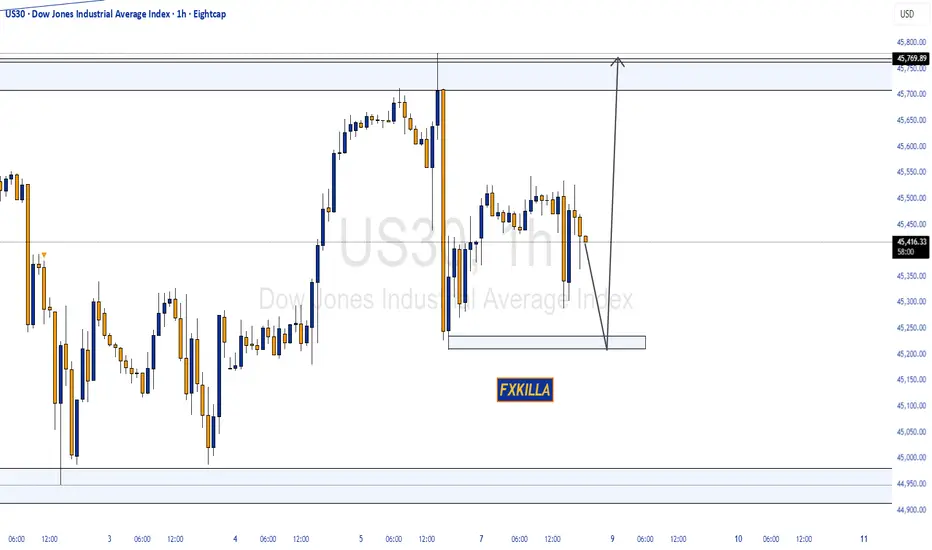
DOW JONES HIGH PROBABILITY SETUP SOON!!!🚨 US30 HIGH PROBABILITY SELL/BUY SETUP 🚨
* Here We Can See Clearly The Next Potential Moves For US30 Coming Hours/Days.
* Keep Your Eyes Close On Your Trading Positions.
* Happy PIP Hunting Traders.
FXKILLA.
USDJPY SELL SETUP SHOOOOOOOOOOOOOOOORTHELLO, How are you?
The price entered SUPPLY Zone ,then exited from it to under ,so I expected fall
especially It is in consolidation area and in premium zone
with downtrend on DAILY FRAME
so I WILL SELL ,but after confirmation

Dow Jones Under Pressure as Bond Yields SurgeUS30 – Dow Jones Update
The Dow Jones erased 250 points as September began with soaring bond yields, dragging stocks lower after the long weekend. Nasdaq was the session’s biggest loser despite showing pre-market strength.
Technical Outlook:
The index reached our support target at 44,950, exactly as projected yesterday.
For now, price is expected to consolidate within the 45,285 – 45,110 zone before the next move.
🔼 A confirmed 4H close above 45,285 would support a bullish continuation toward 45,460 → 45,680.
🔻 Conversely, sustained trade below 45,110 would re-open the bearish path toward 44,950 → 44,720.
Key Levels:
Pivot: 45,285
Support: 45,110 – 44,950 – 44,720
Resistance: 45,460 – 45,680 – 45,860

Dow Jones Overextended: Watching for an Institutional Unwind 📊 Dow Jones (US30) remains bullish 🟢, but in my view, it’s looking overextended 📈. Price has traded into a key level 🎯 where we could see a potential pullback, especially as we approach the end of the week 📅, when institutions and big money 💼 may begin unwinding positions.
👀 The play here is to watch for the high of the week/day ⏫ and look for a counter-trend reversal 🔄 that could drive price lower into the weekly close 📉.
⚠️ Keep in mind: Monday’s opening often creates a stop run 🛑 possibly offering a deeper pullback, giving us a double dose of liquidity grabs 💧. This sets the stage for a fairly deep retracement, which could present an opportunity to counter trend short if conditions align 🧩.
📌 My focus is on a break below the current range 🔓 as a trigger for potential entry.
⚠️ This is for educational purposes only and not financial advice 📚

US30 Bullish Setup: From Pullback to Measured Moves📊 The US30 (Dow Jones) is trending bullish on the 4-hour chart ⏰. We’ve just seen a pullback into equilibrium ⚖️, and I’ve taken a long position 📈. In the video 🎥, I break down how I set my targets 🎯 using the Fibonacci retracement 🔢 — first identifying the equilibrium pullback, then projecting measured moves above for profit targets 🚀. (Not financial advice ⚠️)

Will US30 Reach A New Record High After Today's NFP?Fundamental approach:
- The Dow Jones Industrial Average (US30) rose this week amid cooling US labor signals that reinforced expectations for a Sep Fed rate cut, while upbeat ISM services activity tempered growth concerns.
- ADP private payrolls slowed and jobless claims ticked higher, bolstering bets for easier policy ahead of today's NFP release. This kept risk appetite supported through Thu record-setting close in broader indices.
- The ISM Services PMI accelerated to 52.0 in Aug, with stronger business activity and new orders, but continued employment contraction, a mix consistent with disinflationary growth that equity markets favored. Salesforce (CRM) underperformed on a cautious revenue outlook even as rate-cut hopes lifted cyclicals within the Dow complex.
- Looking ahead, the index could extend gains if payrolls and earnings metrics cool without signaling a hard landing, as this may cement Fed easing later this month. Today's jobs report and subsequent Fed communications could be key catalysts for rate expectations and index momentum.
Technical approach:
- US30 bounced up from retesting the ascending channel's lower bounce, confluence with the support at 45000, and EMA21.
- If US30 breaches the resistance at around 45700, the index may accelerate to retest the confluencing area of several Fibo Extension levels at around 46680-46900.
- On the contrary, closing below 45000 may prompt a further correction to retest EMA78.
Analysis by: Dat Tong, Senior Financial Markets Strategist at Exness

DowJones Key Trading Levels ahead of US Employment DataKey Support and Resistance Levels
Resistance Level 1: 45766
Resistance Level 2: 45920
Resistance Level 3: 46080
Support Level 1: 45050
Support Level 2: 44900
Support Level 3: 44730
This communication is for informational purposes only and should not be viewed as any form of recommendation as to a particular course of action or as investment advice. It is not intended as an offer or solicitation for the purchase or sale of any financial instrument or as an official confirmation of any transaction. Opinions, estimates and assumptions expressed herein are made as of the date of this communication and are subject to change without notice. This communication has been prepared based upon information, including market prices, data and other information, believed to be reliable; however, Trade Nation does not warrant its completeness or accuracy. All market prices and market data contained in or attached to this communication are indicative and subject to change without notice.
Dow Jones (DJI) – 1H Technical OutlookDow Jones (DJI) – 1H Technical Outlook
Bias: Bearish while below 45,450.
Key Resistance: 45,350 – 45,450 (failure to break above keeps sellers in control).
Immediate Supports:
45,100
44,980 – 44,860
Major support at 44,700
📉 Primary Scenario:
If price remains capped below 45,450, a downward move towards 44,700 is likely after a minor corrective bounce.
📈 Alternative Scenario:
A breakout and sustained close above 45,500 would invalidate the bearish view and open the door for a rally towards 45,800 – 46,000.

US30 Pullback Toward 44,600 Within Ongoing UptrendHey Traders, in today's trading session we are monitoring US30 for a buying opportunity around the 44,600 zone. Dow Jones (US30) is trading in an uptrend, with price currently correcting toward this key support/resistance level.
Structure: The broader bias remains bullish, but price is pulling back after recent highs.
Key level in focus: 44,600 — a significant area where buyers may look to step in and continue the upward trend.
Fundamentals: Market sentiment remains broadly supportive for equities, with risk appetite steady as investors weigh U.S. economic data and central bank policy outlook.
Trade safe,
Joe.

US30 Bearish Breakout!
HI,Traders !
#US30 made a bearish
Breakout of the rising support
Line and we are bearish biased
So we will be expecting a
Further bearish move down !
Comment and subscribe to help us grow !

DOW JONES Buy opportunity on oversold 4H RSI.Dow Jones (DJI) has been trading within a Channel Up since the July 31 High and yesterday hit its bottom (Higher Lows trend-line) and rebounded.
Every short-term break just below the 4H MA50 (blue trend-line) of this pattern since August 11, has been the most optimal buy opportunity. Technically as long as the 1D MA50 (red trend-line) holds, the medium-term trend remains bullish.
Given also that the 4H RSI made an oversold rebound, first since August 04, we have a strong buy signal currently, which based on the previous Bullish Legs of the pattern, can rise by at least +2.67%. As a result, our short-term Target is 46100.
-------------------------------------------------------------------------------
** Please LIKE 👍, FOLLOW ✅, SHARE 🙌 and COMMENT ✍ if you enjoy this idea! Also share your ideas and charts in the comments section below! This is best way to keep it relevant, support us, keep the content here free and allow the idea to reach as many people as possible. **
-------------------------------------------------------------------------------
💸💸💸💸💸💸
👇 👇 👇 👇 👇 👇

Dow Jones Falls from Record HighsOver the past two trading sessions, the Dow Jones index has declined by just over 0.7%, with selling pressure remaining constant. This move has been tied to the rebound in U.S. 10-year Treasury yields, which climbed to 4.27%, reducing the short-term appeal of equities. In addition, investors are awaiting the release of U.S. employment data at the end of the week, as the results could influence the Federal Reserve’s upcoming policy decisions.
Uptrend Remains Intact
Despite the recent pullback, the short-term declines have not been strong enough to break the uptrend that has remained in place for the past several months. This technical structure continues to be the most relevant in the short term. Unless selling pressure consolidates over more sessions, the upward trend is likely to remain dominant in the coming days.
Technical Indicators
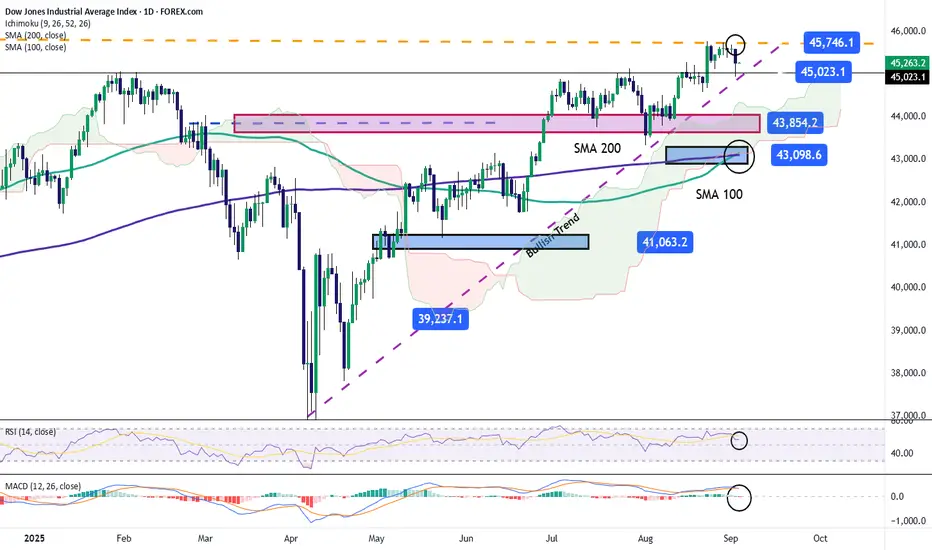
RSI: although the RSI remains above the 50 level, it has begun to show a downward slope in the short term, which could indicate a shift in market momentum. If the line continues to decline, selling pressure could become more relevant in the sessions ahead.
MACD: the MACD histogram continues to hover around the 0 line, indicating that the average strength of the moving averages remains in neutral territory. This highlights the lack of clear direction in the short term.
Key Levels to Watch:
45,746 points – Relevant Resistance: corresponds to the Dow Jones record highs. A sustained breakout above this level could pave the way for a continuation of the uptrend.
45,023 points – Near-Term Support: coincides with recent lows and may act as a barrier for potential short-term pullbacks.
43,098 points – Critical Support: aligns with the 100- and 200-period simple moving averages. A move down to this zone could confirm a break in the uptrend and give way to a dominant bearish bias.
Written by Julian Pineda, CFA – Market Analyst
Dow Jones Holds Pressure Under Pivot Zone 45,530–45,590US30 – Overview
The Dow Jones remains under bearish momentum, having stabilized in the bearish zone with downside potential toward 45,285.
Technical Outlook:
🔻 Bearish scenario: As long as price trades below the pivot zone 45,590 – 45,530, pressure will remain to the downside, targeting 45,430 → 45,285 → 45,100.
🔺 Bullish scenario: A reversal and stabilization above 45,590 would open the way to 45,680, and a confirmed breakout higher could extend toward 45,860.
Key Levels:
Pivot zone: 45,530 – 45,590
Support: 45,430 – 45,285 – 45,100
Resistance: 45,680 – 45,860
📌 Bias: Bearish below 45,530–45,590; bullish only above 45,590 with confirmation.

XAU/USD | Breakout in Progress – Are You Ready for the Next ATH?By analyzing the gold chart on the 4-hour timeframe, we can see that, as expected from our analysis two days ago, the price began its bullish move from the $3383 zone and successfully hit all four targets at $3393, $3398, $3404, and $3409 — but it didn’t stop there! Gold continued its rally beyond those levels.
As anticipated in yesterday’s outlook, we closely watched the $3419–$3429 supply zone for a potential bearish reaction. When price reached $3424, it dropped to $3404, validating our second scenario as well. Although the drop could’ve extended further, the combined result of both scenarios delivered over 500 pips of total profit!
After hitting $3404, gold gained demand again — and with the release of the U.S. Core PCE data, this bullish trend strengthened, pushing price up toward its all-time high (ATH) near $3500. Gold is now trading around $3447, just 500 pips away from that historic level.
Given the increasing odds of a Fed rate cut in September, the bullish momentum is likely to continue. In my view, a new ATH for gold could be on the horizon in the coming weeks.
Hope this analysis helps you ride the wave — make the most of it! 💰📈
THE LATEST ANALYSIS 👇🏼
Will $3500 be the next stop for gold? 👀
👇 Drop your thoughts below & don’t miss the next update!

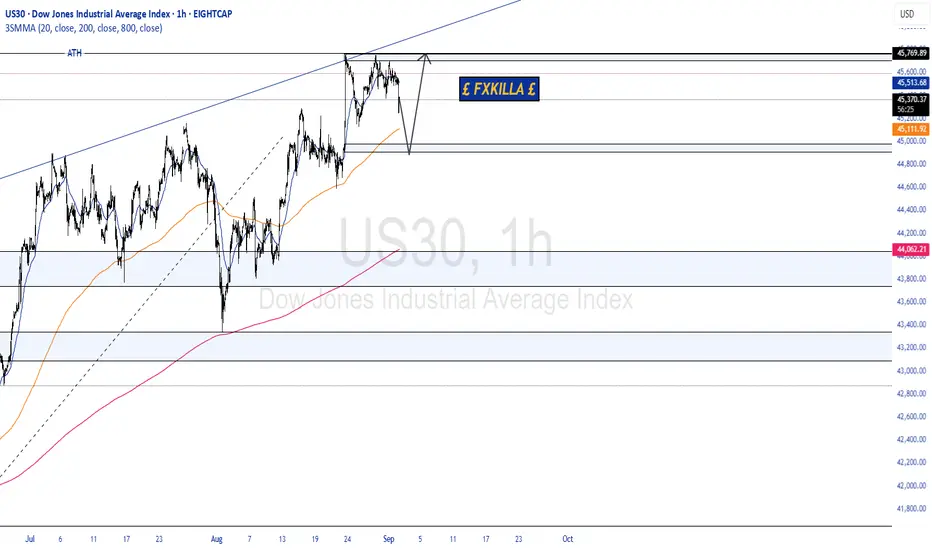
DOW JONES HIGH PROBABILITY SETUPS SOON!!🚨 US30 HIGH PROBABILITY SELL/BUY SETUPS 🚨
*Here We Can See Clearly The Next Potential Moves For US30 Coming Hours/Days.
* Keep Your Eyes Close On Your Trading Positions.
* Happy PIP Hunting Traders.
£ FXKILLA £
DowJones Key Trading Levels - resistance at 45766 Key Support and Resistance Levels
Resistance Level 1: 45766
Resistance Level 2: 45920
Resistance Level 3: 46080
Support Level 1: 45050
Support Level 2: 44900
Support Level 3: 44730
This communication is for informational purposes only and should not be viewed as any form of recommendation as to a particular course of action or as investment advice. It is not intended as an offer or solicitation for the purchase or sale of any financial instrument or as an official confirmation of any transaction. Opinions, estimates and assumptions expressed herein are made as of the date of this communication and are subject to change without notice. This communication has been prepared based upon information, including market prices, data and other information, believed to be reliable; however, Trade Nation does not warrant its completeness or accuracy. All market prices and market data contained in or attached to this communication are indicative and subject to change without notice.

Us30 active buy Us30 active buy aiming for +120 pips Target to create the wick on the last daily candle without a wick
aslong as we remain above MAs we are bullish

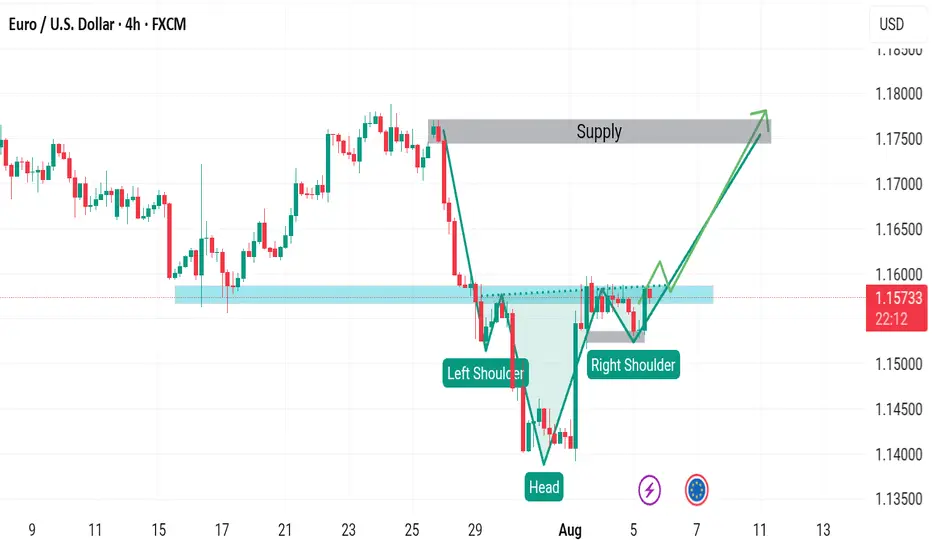
EURUSD BUY SETUPThe price will form a head and shoulders pattern because the candle in the second shoulder is very strong, which indicates that it will break the neck of the pattern. We also have a stronger bounce from below, so I expect an uptrend.
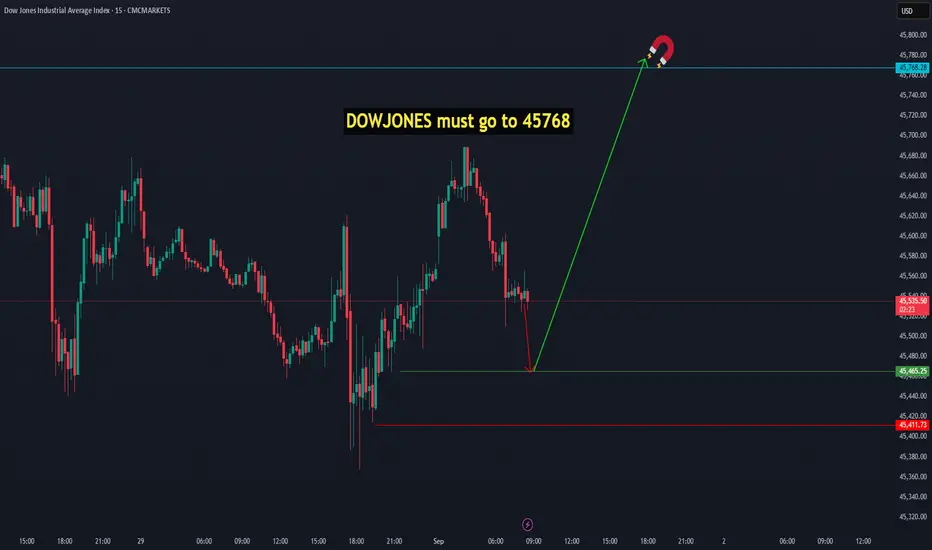
DOWJONES must go to 45768Dow Jones has the potential to start its upward move from the price range of 45,465 to 45,411, targeting 45,768. Even if this support range is broken and price goes lower, the target of 45,768 remains certain and must eventually be reached. CMCMARKETS:US30