US 30US.30 - Dow Jones
- Consolidation Phase
- Bearish Channel as an corrective pattern in Short Time Frame
- RSI - Divergence
- Sell and Buy Side Liquidity
- Fair Value Gap
Dowjonesforecast

US30 Short From Resistance!
HI,Traders !
#US30 is once again
About to retest a horizontal
Resistance level of 0.5840
Which is a strong supply
Area from where a local
Bearish pullback is to
Be expected !
Comment and subscribe to help us grow !

Dow Jones - Looking To Sell Pullbacks In The Short TermM15 - Strong bearish move.
No opposite signs.
Currently it looks like a pullback is happening.
Expecting bearish continuation until the two strong resistance zones hold.
If you enjoy this idea, don’t forget to LIKE 👍, FOLLOW ✅, SHARE 🙌, and COMMENT ✍! Drop your thoughts and charts below to keep the discussion going. Your support helps keep this content free and reach more people! 🚀
--------------------------------------------------------------------------------------------------------

US30 Is Overbought!
HI,Traders !
#US30 is trading in a
Strong uptrend and the pair
Will soon hit a horizontal
Resistance of 48690.4
So after the retest a
Local bearish pullback
Is to be expected !
Comment and subscribe to help us grow !

Dow Jones Attempts to Reach New HighsThe index has managed to maintain a gain of more than 2% over the past six trading sessions, attempting once again to approach its historical highs as the market holds a consistent short-term bullish bias. For now, buying pressure has remained supported by a temporary rebound in market confidence, driven by expectations of lower interest rates from the Federal Reserve next week. If this improvement in confidence continues, current buying pressure could remain dominant in the sessions ahead.
Uptrend Line Remains Relevant
The long-term upward trendline visible in the Dow Jones has continued to hold despite recent fluctuations, and so far, no meaningful bearish correction has emerged to threaten its structure in the short term. As a result, it remains the most important technical factor to watch, especially if price manages to reach the previous high zone again, which would confirm a dominant bullish bias heading into year-end.
RSI
The RSI continues to fluctuate slightly above the neutral 50 level, suggesting that average buying momentum over the last 14 sessions remains dominant. If the RSI line continues to show steady growth, buying pressure could strengthen further.
MACD
The MACD remains very close to the neutral zero line, reflecting a sense of neutrality in the strength of short-term moving averages. Although there is buying pressure in the Dow Jones, the lack of a clear recovery in the histogram may lead to a period of consistent indecision, producing narrow-range candles and signaling a possible pause in the bullish momentum.
Key Levels to Watch:
48,248 points – Major resistance
This level corresponds to the historical highs and remains the most important bullish barrier. Buying movements approaching this zone could reactivate a strong bullish bias and extend the current upward trendline.
46,821 points – Nearby barrier
A level aligned with the 50-period simple moving average. It may serve as a key area to monitor in case of potential short-term bearish corrections.
45,677 points – Primary support
This level corresponds to the recent lows. If price approaches this zone again through bearish movements, it could signal the end of the current uptrend and open the door to a more meaningful bearish bias in the short term.
Written by Julian Pineda, CFA, CMT – Market Analyst

Dow Jones - Looking To Sell Pullbacks In The Short TermH1 - Strong bearish move.
No opposite signs.
Expecting bearish continuation until the two Fibonacci resistance zones hold.
If you enjoy this idea, don’t forget to LIKE 👍, FOLLOW ✅, SHARE 🙌, and COMMENT ✍! Drop your thoughts and charts below to keep the discussion going. Your support helps keep this content free and reach more people! 🚀
-------------------------------------------------------------------------------------------------------------------

Trading US30 DOW JONES: Bullish Momentum Here's My Trade PlanYesterday in my video 🎥, I mentioned that if US30 broke out to the upside, I'd look to enter long. That’s exactly what happened—big breakout! 🌟 Now, I’m waiting for a pullback 🕰️ to my optimal entry zone and a confirmed market structure shift for another buy opportunity 💵. (Not financial advice) 📝

US30 Strategy: Waiting for Confirmation Amid Conflicting Trends🔥📉 Currently checking out the US30 (Dow Jones)! On the ⏰ 4-hour chart, the vibe is definitely bearish, but when you zoom out to the 📅 daily chart, things look much more bullish 🚀. For me, this index is at a real crossroads! 👉
🔎 On the 30-minute chart, I’m watching closely for a bullish breakout above the recent high and a key break of structure 🟢📈 — that would spark a potential buy opportunity!
💼 If instead, price slips below the current high and we see a bearish shift in structure 🚩📉, I’m eyeing a possible sell setup!
❗️Of course, this is just my view, not financial advice! 🚫💸

DOW JONES INDUSTRIAL HIGH PROBABILITY SETUP SOON!!!🚨 DOW30 HIGH PROBABILITY BUY SETUP 🚨
* Here We Can See Clearly The Next Potential Moves For US30 Coming Hours/Days.
* Keep Your Eyes Close On Your Trading Positions.
* Happy PIP Hunting Traders.
FXKILLA.

Dow Jones Returns to the 46,000 Level Since the beginning of the week, the Dow Jones Index has maintained a notable bullish bias, extending a two-day winning streak as the equity benchmark posts a gain of around 2.20% in the short term. For now, buying pressure has supported the price recovery following the sharp correction seen last Friday, which was triggered by the escalation of trade tensions between China and the United States.
Although no major trade agreement has been announced, the aggressive tone of the tariff threats appears to have eased slightly, helping the market regain confidence in the short term. However, it’s important to note that if tensions escalate again, the Dow Jones could once more show heightened sensitivity to such developments, quickly reactivating selling pressure in the coming trading sessions.
Uptrend at Risk
The uptrend line, which had been sustained through much of 2025, has started to weaken following last Friday’s sharp correction. As a result, the average bullish momentum has entered a neutral zone in the short term. Currently, there is a recovery attempt from the previous downward move, though it has not yet been strong enough to bring prices back to recent highs.
If buying pressure fails to remain decisive over the next few sessions, a period of market indecision could emerge, potentially leading to a sideways range in the short term.
RSI
The RSI line continues to hover around the 50 level, reflecting a neutral momentum over the past 14 sessions. As long as the indicator stays within this range, neutrality may dominate the market bias, leading to indecisive price movements in the coming days.
MACD
The MACD histogram also remains near the neutral (0) level, indicating that there is no clear directional strength in short-term moving averages. This reinforces the idea of indecision in the market, suggesting that the price action may remain range-bound without a defined trend in the near term.
Key Levels to Watch:
46,790 points – Major Resistance: Corresponds to the all-time high area of the index. Buying activity approaching or surpassing this level could reactivate the bullish trend and establish a dominant buying bias.
45,741 points – Near-Term Barrier: Aligns with the 50-period simple moving average. As long as prices continue to fluctuate around this level, a new short-term consolidation range could form.
44,834 points – Critical Support: Represents the most stable neutral zone in recent weeks and coincides with the Ichimoku cloud boundary in the short term. A decisive break below this level could trigger a stronger bearish bias, putting the year-long uptrend at risk and potentially signaling the start of a new downward phase in the short term.
Written by Julian Pineda, CFA – Market Analyst

Dow Jones - Looking To Sell Pullbacks In The Short TermH4 - Strong bearish move.
Uptrend line breakout.
No opposite signs.
Currently it looks like a pullback is happening.
Expecting bearish continuation after pullback until the strong resistance zone holds.
If you enjoy this idea, don’t forget to LIKE 👍, FOLLOW ✅, SHARE 🙌, and COMMENT ✍! Drop your thoughts and charts below to keep the discussion going. Your support helps keep this content free and reach more people! 🚀
UShort

Dow Jones US30 Analysis: Bullish Trend, Trade Plan📊 The US30 (Dow Jones) remains in a strong bullish trend, showing a clear sequence of higher highs and higher lows on the 4-hour chart 📈. However, when viewed on the daily timeframe, price now appears somewhat overextended ⚠️.
🔎 Dropping down to the lower timeframes and applying the Anchored VWAP (AVWAP) indicator, it’s evident that price is trading well above VWAP, signaling a premium zone. The risk here is that traders may continue buying into strength without acknowledging that price could easily retrace back into VWAP.
💡 Remember — smart money buys at a discount, not at a premium. In bullish trends like this, patience is crucial.
📹 In the video, I outline my trade plan, which focuses on waiting for a healthy pullback and then looking for a bullish setup if the structure aligns in our favor. I’m not interested in chasing price when it’s this extended — instead, I prefer to wait for the retracement and enter at better value, reducing risk and improving trade quality 🎯.
⚠️ Disclaimer: This analysis is for educational purposes only and not financial advice. Always trade responsibly and manage risk carefully.

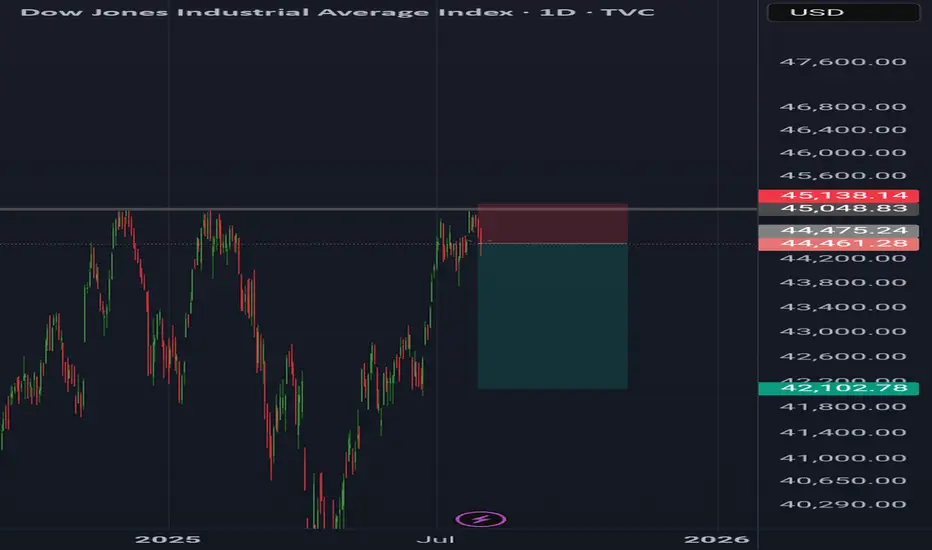
Dow jonesDow Jones daily analysis
Time frame daily
Risk rewards ratio >3.5
Short position
Because price couldn't break the 45.048 again and earthquake in 5he east of Russia and Japan makes the markets drop down
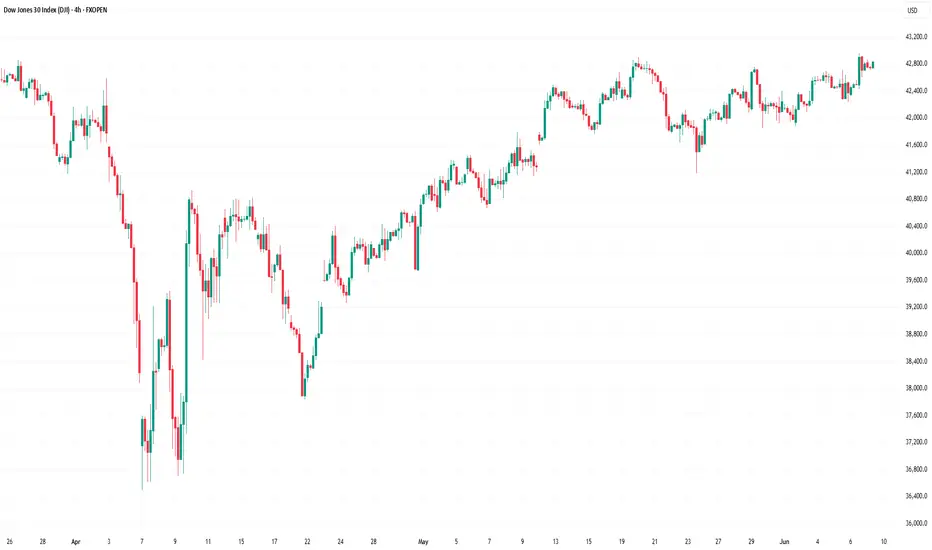
Dow Jones Index Rises Towards Key ResistanceDow Jones Index Rises Towards Key Resistance
On Friday, the Dow Jones Industrial Average (Wall Street 30 mini on FXOpen) climbed above the 42,950 level — a high not seen since early March.
The index has gained around 1.6% since the beginning of June.
Why Is the Dow Jones Rising?
→ Friday’s US jobs report helped ease concerns about the country’s economic outlook. According to ForexFactory, Non-Farm Employment Change came in at +139K, beating the forecast of +126K.
→ On Thursday, Donald Trump and Chinese President Xi Jinping held a call, easing tariff tensions. Market participants also welcomed news that officials may hold trade negotiations in London on 9 June.
Could the DJIA (Wall Street 30 mini on FXOpen) Rally Continue?
Technical Analysis of the Dow Jones Chart
The chart suggests that the 42,950 level is acting as a significant resistance. The price has repeatedly reversed from the 42,660–42,950 area (as shown by the arrows).
At the same time:
→ Friday’s move above 42,950 triggered selling pressure, forming a candlestick with a long upper shadow;
→ This may have been a false bullish breakout of the May high;
→ The price remains within an ascending channel (shown in blue), but the bounces off the lower boundary appear weak.
Given this setup, it is reasonable to assume that intensified bearish activity near 42,950 on the USA30 could lead to a breakout below the channel’s lower boundary.
Additional pressure on the Dow Jones Industrial Average (Wall Street 30 mini on FXOpen) may come from developments in California, where protests have erupted against immigrant deportations, with President Donald Trump and Governor Gavin Newsom trading accusations.
This article represents the opinion of the Companies operating under the FXOpen brand only. It is not to be construed as an offer, solicitation, or recommendation with respect to products and services provided by the Companies operating under the FXOpen brand, nor is it to be considered financial advice.
Dow Jones Short Term Sell Trading PlanM15 - Strong bearish momentum
Lower lows on the moving averages of the MACD indicator.
Until the two Fibonacci resistance zones hold I expect the price to continue lower further.
If you enjoy this idea, don’t forget to LIKE 👍, FOLLOW ✅, SHARE 🙌, and COMMENT ✍! Drop your thoughts and charts below to keep the discussion going. Your support helps keep this content free and reach more people! 🚀
--------------------------------------------------------------------------------------------------------------------
Disclosure: I am part of Trade Nation's Influencer program and receive a monthly fee for using their TradingView charts in my analysis.

US30 Bullish Breakout!
HI,Traders !
US30 broke the key
Horizontal level of 44600.0
And the breakout is confirmed
So after a local correction
We will be expecting a further
Bullish move up!
Comment and subscribe to help us grow !

Dow Jones Short Term Sell IdeaH4 - Bearish convergence
Currently it looks like a pullback is happening.
H1 - Bearish trend pattern
Currently it looks like a pullback is happening
Until the strong resistance zone holds I expect the price to move lower further after pullbacks.

US30 Breakout Setup – Targeting 43700 and 44000 US30 is showing strong bullish momentum with price holding above an ascending trendline,
I am currently seeing consolidation near a key resistance level if price breaks above 43346 it could signal a good buying opportunity,
I am targeting two main levels for take profit:
First target: 43700 (minor resistance).
Second target: 44000 (psychological level).
My Stop Loss is set just below 43000 to protect the trade, right under the 0.618 Fibonacci retracement and trendline support,
Trade Setup:
Buy Entry: Above 43346 on a confirmed breakout.
Stop Loss: Below 43,000 (protected by the Fib 0.618 level and trendline).
Take Profit 1: 43700
Take Profit 2: 44000
This setup has a strong risk reward profile and follows the ongoing bullish trend in US30, Watch for a strong breakout before entering the trade!
Best of luck!

Dow Jones to be bullish next 2 daysDJ is expected to be bullish today and test the order block on D1 at 50%Fib level. The expected move is demonstrated in the chart.
The last D1 candle was a bullish engulfing candle which finished the two day consolidation and now the price is expected to target an order block on D1 which is expected to be a strong one as it is coming off from a previous order block. Next two days is expected to be bullish on DJ and we will see some bearish move on coming Friday.
Good luck and use proper risk reward
This idea is for educational purpose only and not a financial advise .

Dow Jones - Looking To Sell Pullbacks In The Short TermH4 - Bearish convergence.
Expecting short term bearish moves to happen here.
H1 - Strong bearish momentum.
Currently it looks like a pullback is happening.
Until the strong resistance zone holds I expect the price to move lower further after pullbacks.

DJI Pair : DJI - Dow Jones Description : Rising Wedge as an Corrective Pattern in Short Time Frame with the Breakout of the Lower Trend Line and Retracement. Completed " 12345 " Impulsive Waves and " AB " Corrective Waves. RSI - Divergence. Break of Structure.

Dow Jones Dow Jones might be break the trendline first target 38109..
If dow Jones will fall it impact on Indian Share Market..

Dow Jones Big Move ?Pair : Dow Jones - DJI
Description :
Bullish Channel as an Corrective Pattern in Long Time Frame and Rejection from Upper Trend Line. Completed " ABC " Corrective Waves. Break of Structure and Strong Divergence. Symmetrical Triangle as an Correction in Short Time Frame with the Breakout of Lower Trend Line.
