Bitcoin Remains Under Pressure — Sellers Still in Full ControlPrice is trending firmly below the descending trendline and the EMA50, confirming a sustained bearish market structure with lower highs and lower lows intact. Recent pullbacks are being sold aggressively, showing no meaningful sign of demand stepping in.
A minor bounce toward the 90,800–91,000 area is likely to act as a corrective retest of structure rather than a reversal, where sellers may re-enter positions.
As long as price remains below the trendline, downside continuation is favored, exposing key liquidity targets at 89,300, followed by 88,800–88,400. Only a strong reclaim and close above 91,300 would invalidate the bearish scenario and signal a shift in short-term momentum.
Down

Rebound of EGX30EGX30 stock is currently in an increasing region. In case of falling, it's expected to break the support line 32,892.565 to reach then 2nd at 32,568.193 then the third at 32,543.242. In case of rising, it's expected to rebound at the resistance line of 32,934.151, to reach the 2nd at 32,875.931 then the 3rd at 32,850.979

Gold Drop to 3256Hello traders! The impulse wave is down, there is a correction, and another impulse wave has started. I expect it to reach 3256.

Patience Friends...Howdy again,
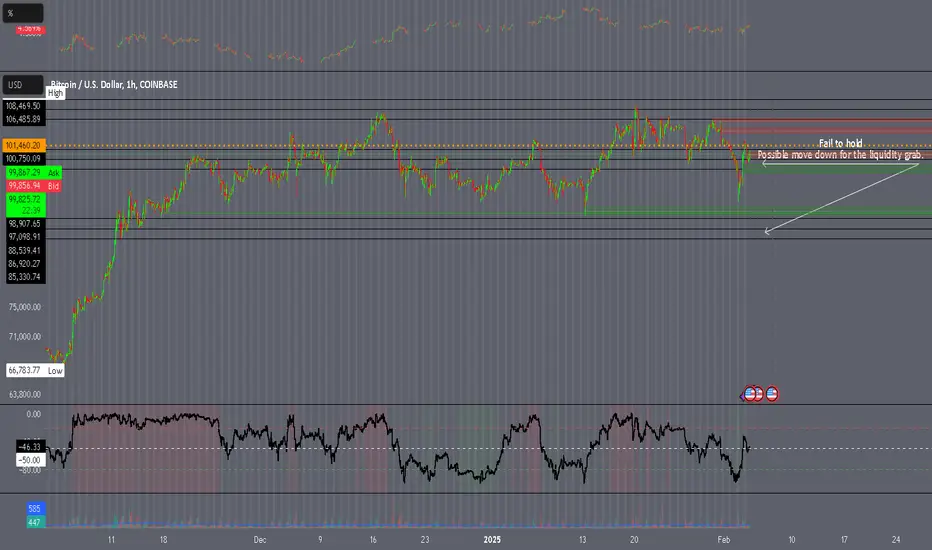
As much as the 2.5% is coming we must have patience. It looks like it wants to tough the resistance trend lines once again before actually losing this support here. It also is a double bottom on the weekly which is pretty hard to break, but once it does, not only btc, but the whole market will explode.
Trade thirsty!
P.S: I'll put this as SHORT even though you should LONG usdt and SHORT the market.

$BTC/$USDT Small uptick then short before long up? ThoughtsI am not a pro trader so know that. I do trade and I make money. I also loose it to. But over all I am up.. still nothing to say I am better than anyone else other than I guess time spend researching myself most days and many days at length. Into finance and crypto laws tax and more.
This idea is purely speculation and I would love the speculation and or validation if you agree. I’m using a simple 1-2 level support and resistance signal/indicator. Thanks for looking! Hope it surveys you well! Stay trading! Book orders CHEAP and sell HIGH! Set the orders so you don’t miss bottoms and tops! You can do it just be PATIENT. They are who win. Trust in it! Study and be happy enjoy the ride! Good luck all.

QQQ - The Warning-Line Scenario For A ShortIt's simple a s that:
If price can't make it back into the Fork, then it's doomed to reach at least the Warning-Line.
This scenario likely happens if the current weeks bar close below the Warning line, and the open of the new Bar is also outside of the Fork.
Happy Short §8-)

Hold!Bulls! My fellow warriors of the market! I see fear in your eyes... I See hesitation... But I also see fire! The Bears think they own this battlefield! They think they can drive us back, force us to surrender, and take what is ours!
But I ask you - will you run? Will you let them push us down, and break our support and trample our dreams?!
HELL NO!
Then stand up! Hold the damn line! Push through that resistance! The Bears are clawing, but they are weak! You are stronger! Your are relentless!
You are BULLS!
So I ask you one last time - WHAT ARE YOU DOING LYING THERE?
GET UP!
PUSH FORWARD BREAK THEIR SPIRIT!
TAKE BACK THIS MARKET!
DO YOU WANT TO LIVE FOREVER!
KIKI - New, doesn't always mean goodThis relatively new coin looks like there's more low to come. If we look at the MACD it's clear to see that the red bars are showing a negative swing. I've added a red semi circle to make the point that *if* the MACD continues to stay in the red, there's likely more of a bulge to appear ahead of returning into the green. Equally, there's a very clear channel that if the resistance is broken this could descend into freefall. It's new, with almost no market cap. I'd stay well clear and focus on the top 6. Follow and share for more.
K

Bitcoin - Playing around weak support#BTC/USDT #Analysis
Description
---------------------------------------------------------------
+ Currently bitcoin is trading around its support zone of 95K and this is weak support which held and broke multiple times.
+ Strong resistance for bitcoin is around 92K, if bitcoin falls to this level, we can expect the support to hold.
+ I'm expecting a drop in price with a wick to touch 92K and bounce back immediately.
+ If bitcoin breaks below 92K then we can expect further crash to 80K level.
---------------------------------------------------------------
Enhance, Trade, Grow
---------------------------------------------------------------
Feel free to share your thoughts and insights. Don't forget to like and follow us for more trading ideas and discussions.
Best Regards,
VectorAlgo

Sell Recommendation Note for Dow Jones IndexSell sINGAL
Current Price: 44,800
Stop Loss: 45,150
Target: 43,400
Disclaimer:
This note is for study purposes only. Please consult your financial advisor and evaluate risk exposure before taking any action. Investing involves risks, including the loss of principal.

Peloton Short - Thanks for the rideStoryline: CFO sold shares + (bad economic data incoming?)
Chart: Weekly high broken, retrace due as usual.
Question: Was that whole pump really reasonable?
You can bet that the majority of retail investors bought (as always) on the very top during this wonderful pump and now just patiently waits to feel the real pain of retracement. I doubt in general, that this was a major turnaround for the company, yet.

Bitcoin Could Drop to $51,000! Maybe 43,000!
After a recent 20% decline to $49,000, Bitcoin is currently trading above $57,000, but it might decrease to $51,000. The key support level is $53,500. Bitcoin is again caught in a bearish technical pattern; a closing bullish channel!
There are also rumors of a potential attack by Iran on Israel either tonight or tomorrow, which could drive Bitcoin down to $43,000 and cause another market downturn. However, this might potentially result in a positive divergence in the RSI.
Although there is still optimism about the CME gap in the market, the risks outweigh the optimism significantly.
In the current situation, if you don’t have a high risk tolerance, you might consider reducing some of your investment at this level. If you still have liquidity, you can dollar-cost average (DCA) into altcoins during potential dips.

Xauusd Down TrendCertainly! XAU/USD is currently on a downward trend, moving from 2365 to 2340. The price decline indicates a bearish momentum with potential for further downward movement. Traders may observe this trend for potential selling opportunities or to assess the market sentiment towards gold in relation to the US dollar. The shift from 2365 to 2340 suggests a gradual decrease in value over the specified period, reflecting market dynamics and investor behavior.

Down trends for xauusdGold price is going down today.
Average Hourly Earnings measures the change in
the price businesses pay for labor, not including the
agricultural sector.
A higher than expected reading should be taken
as positive/ bullish for the USD, while a lower than
expected reading should be taken as negative/ bearish
for the USD,


FETUSDT Short Position Fet looks bearish . i am looking for a short position here. no briefly explanation

Petrobras (PETR): Bearish Divergence - Heading for a Dip After the market closed yesterday, Petrobras, a Brazilian stock, released a new earnings report. We're analyzing it in Brazilian Real (BRL) to get the most accurate view of the chart. On the weekly chart, we anticipate a mild but noticeable bearish divergence, especially since the beginning of 2024 when the stock has significantly appreciated.
There is considerable downside potential as we expect the completion of Wave (3), followed by a downward adjustment in Wave (4). The exact retracement level for Wave (4) is yet to be determined, but we anticipate a pullback to around 38.52% before the stock resumes its upward trajectory in Wave (5).
Our downside target is around 50 BRL, considering Petrobras' high dividend yield. This makes the stock attractive not only for its growth potential but also for its income-generating ability.
A closer look at the daily chart reveals potential scenarios for either the completion of Wave 5 or Wave (3), highlighting areas where bearish divergence becomes more apparent. This divergence is evident due to the significant impulsive rises in the stock over recent months and weeks, which have created several imbalances. Despite closing gaps and reaching new highs, a downward correction is likely needed before we can see further upward movement.
We anticipate that the correction in Wave (4) will take the stock lower, potentially reaching levels between 28.28 and 23.30 BRL.

Just A View - Consolidation Breakdown - KOTAKBANK📊 Script: KOTAKBANK
📊 Nifty50 Stock: YES
📊 Sector: Banks
📊 Industry: Banks - Private Sector
Key highlights: 💡⚡
📈 Script is giving Breakdown of consolidation on Monthly chart, we may see some more bearishness into the stock.
⏱️ C.M.P 📑💰- 1551
🟢 Target 🎯🏆 - 1479
⚠️ Important: Always maintain your Risk & Reward Ratio.
✅Like and follow to never miss a new idea!✅
Disclaimer: I am not SEBI Registered Advisor. My posts are purely for training and educational purposes.
Eat🍜 Sleep😴 TradingView📈 Repeat 🔁
Happy learning with trading. Cheers!🥂


📈Mastering Stock Selection:A Journey to Long-Term Wealth💰Part1Interested in selecting high-quality stocks and growing your wealth through long-term investing? Today, I'll guide you through effective stock selection methods, including the top-bottom and bottom-top approaches. Remember, as Warren Buffett famously said, "The stock market is designed to transfer money from the active to the patient." 💼📈
Let's start with the top-bottom approach. First, you choose an economy, such as Indian, US, or UK. Next, select a sector within that economy, like Financial Services, IT, or Pharma. From there, narrow down to an industry within the sector, such as AI, Clean-technology, or Hardware. Finally, choose a company within the industry. Don't worry if it seems complex – I'll provide examples and guidance throughout. 💡🔍
Conversely, the bottom-top approach flips this order. We start by selecting a company, then move up to its industry, sector, and finally, the economy. 💼🔄
Let's put theory into practice with the top-bottom approach: (a random example)
1. Choose India as the economy.
2.Select the IT sector for its promising future.
3. Opt for AI as the industry due to its potential.
4. Select Infosys as a company.
Now, it's your turn! Share examples of top-bottom or bottom-top approaches in the comments for practice. 💬💡
In the upcoming discussions, we'll delve into the fundamentals of sector, industry, and company analysis. Don't worry—I'll explain everything from market cap and cash flow to return on equity (ROE). 📊✨
Target of likes (boosts): 25+ (if we achieve our target than I will make Part 2) 🎯🚀
Follow for more such ideas & learning content! 🔍

Bitcoin big crash is about to start...As you can see BTC couldnt close above the weekly structure high and now it's making a SCOB confirmation .
if the price close blowe the 63100 in weekly timeframe then we could see 40K & 30K & 20K & 15K & and 12K
we have an extreme OB on 12K and if it drops to 12k we can buy to 74k again.
BShort

LTC Strategic Move: Collapse down to $56 Buying LiquidityIn light of the Triangle Breakout pattern, Litecoin has successfully reached its upside target. Simultaneously, LTCUSDT has broken above the resistance uptrend trendline, signaling a positive outlook for the long term. However, the current market conditions are presenting a highly intricate timing challenge for both buyers and sellers, with price exhibiting heightened volatility.
Despite the complexity, there's a probable scenario on the horizon. LTC's price might experience a downward move toward the $56 mark, a level often marked by stop losses. Interestingly, this zone is expected to attract significant buying liquidity, serving as a robust support and contributing to a highly favorable LTCUSDT price action.
Stay vigilant for the emergence of a new higher high, as it could indicate a rapid continuation of the uptrend. The key is to remain alert to market dynamics and potential shifts while navigating the current volatility.
