Gold can correct to support line of channel and then start growHello traders, I want share with you my opinion about Gold. In this chart, we can see how the price, after forming a triangle structure and breaking out to the upside, Gold entered a downward channel, where it has been consistently respecting both the resistance and support lines. Each bounce from the lower boundary of this channel signals local buyer interest, especially near the support level around 3060, which also overlaps with the buyer zone. Recently, the price rebounded from this support line, indicating a potential start of a bullish correction inside the channel. This move is consistent with past price behavior, strong impulses from the bottom boundary followed by gradual movement toward the upper resistance line. Given the structure and the ongoing bounce, I expect Gold can correct the support line of the channel, after which it turns around and starts to grow to the 3290 resistance level, which aligns with the upper boundary of the pattern and the beginning of the seller zone. That’s why my TP 1 is set at 3290 points - a reasonable technical target within the current channel formation. Please share this idea with your friends and click Boost 🚀
Disclaimer: As part of ThinkMarkets’ Influencer Program, I am sponsored to share and publish their charts in my analysis.
Downtrend

HH HL still intact.
HH HL still intact.
Hidden Bullish Divergence has appeared.
We may expect the reversal only if 36 is not broken.
49-50 can be immediate targets in case of reversal.

DOW/US30 - PLEASE FOLLOW THE STRATEGY ACCORDINGLYTeam, two are set up on LONG position for DOW/US30.
if you have seen my video, how I trade and how much I made, you would notice the difference.
With strategy 1, you make 10-15% profit on your capital, depending on how much risk you take. Please add your entry slowly. Do not trade plan one aggressively.
also, follow the target range accordingly, make sure trail stop loss to BE once the first target is reached and take 50% partial
With strategy 2, if the market allows, this is where we would kill the market. But we need to be patient. As you can see, in the last 2-3 days, I did not trade the DOW/US30 because I prefer to enter at a certain level and price action.
Please follow the plan accordingly; once it hits target 1, take 30% and bring stop loss to BE
I hope you understand my strategy. Let's make millions together.

Market Likely to Resume Downtrend – Caution AdvisedAfter some consolidation, the market looks ready to resume its broader downtrend. Bullish momentum is fading, and resistance remains strong. Unless we see a breakout, downside pressure is likely to build.
Watching for confirmation via key support breaks or bearish signals. Stay cautious and manage risk. Not financial advice — just my view.

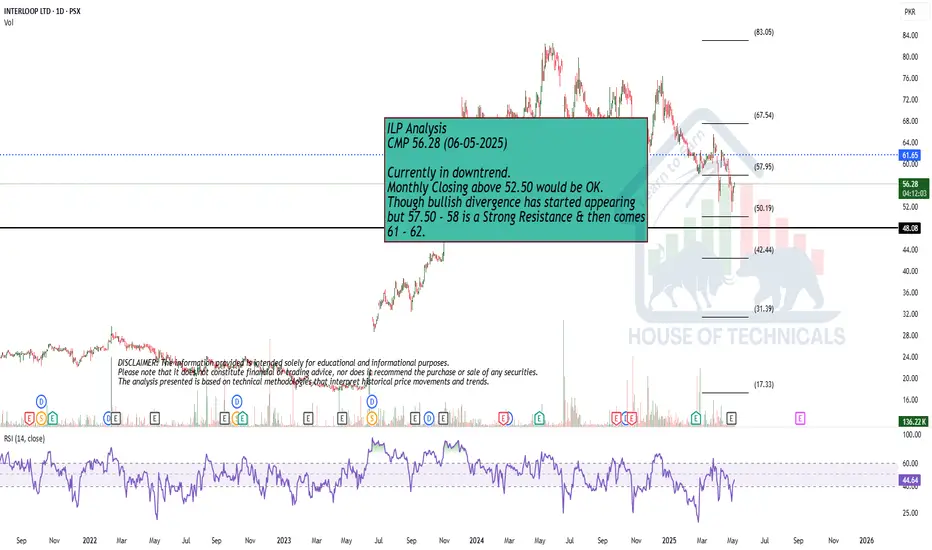
Currently in downtrend.Currently in downtrend.
Monthly Closing above 52.50 would be OK.
Though bullish divergence has started appearing
but 57.50 - 58 is a Strong Resistance & then comes
61 - 62.
"...I'm tired, I'm leaving..."Well, that’s it — Bitcoin is tired of resisting the bears. As long as there was enough buy volume, the bears were offloading quietly. But now, we’re heading down.
Happy May holidays, everyone. I’ll post a more detailed update tomorrow — stay tuned!

USD_CAD WILL GO DOWN|SHORT|
✅USD_CAD is consolidating
Beneath the horizontal resistance
Of 1.3862 so we are bearish
Biased and we will be expecting
A further bearish move down
This trading week
SHORT🔥
✅Like and subscribe to never miss a new idea!✅
Disclosure: I am part of Trade Nation's Influencer program and receive a monthly fee for using their TradingView charts in my analysis.

Everyone I am shorting DOW/US30Team I am shorting DOW, - MUST have stop loss the price could hit 40912-16 - but short slowly now, with STOP loss at 40960-65
Target 1 at 40750-40735 - reduce 30% volume
Target 2 at 40650-40600 - reduce 50% volume
Target 3 at 40550-740483 - remaining
Once the price reaches the first target, bring STOP LOSS TO BE
NEXT week, I will be releasing a video on how I made 1000% profit in 4 weeks. I would love to share my strategy with the world.

USD-CAD Will Keep Falling! Sell!
Hello,Traders!
USD-CAD is trading in a
Downtrend and the pair made
A retest of the horizontal
Resistance of 1.3868 from where
We are already seeing a bearish
Move down so we will be
Expecting a further
Bearish move down
Sell!
Comment and subscribe to help us grow!
Check out other forecasts below too!
Disclosure: I am part of Trade Nation's Influencer program and receive a monthly fee for using their TradingView charts in my analysis.

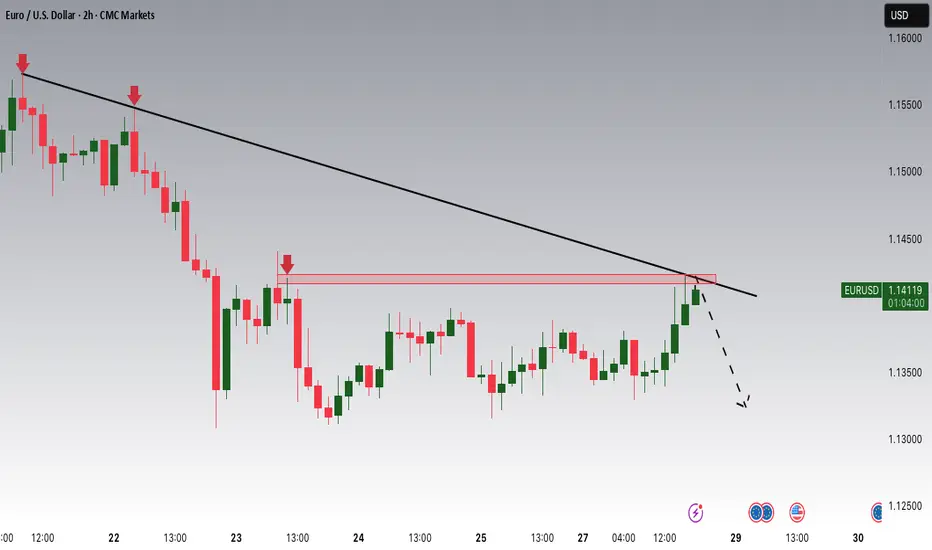
EURUSD is Switching to a Bearish Trend!Hey Traders, in today's trading session we are monitoring EURUSD for a selling opportunity around 1.14200 zone, EURUSD is trading in a downtrend and currently is in a correction phase in which it is approaching the trend at 1.14200 support and resistance area.
Trade safe, Joe.
Will Gold Reject This Important Resistance?Hey Traders, in today's trading session we are monitoring Gold for a selling opportunity around 3,355 zone, Gold is trading in a downtrend and currently is in a correction phase in which it is approaching the trend at 3,355 support and resistance area.
Trade safe, Joe.

NVDIA Death Cross Quant Perspectives (Light Case Study)NASDAQ: Nvidia (NVDA ) has recently experienced an uptrend after a death cross formed consisting of the 65 and 200 EMAs on the 1 Day chart.
If we analyze back on Nvidia starting in 1999 , we can count a total of 10 death crosses that have occurred, and 9 have been immediately followed by downtrends. Although a single death cross did not have an immediate downtrend, shortly after this event (approx. 282 days) another death cross formed and price then fell roughly twice as it historically has , almost appearing to make up for the missed signal.
From a quantitative perspective:
If we calculate the raw historical success rate using:
Raw Success Rate = 9/10 = 90
With this calculation the observed success of 65/200 EMA death crosses correlating to an immediate downtrend is 90%
In order to avoid overconfidence we can apply Laplace smoothing using:
Smoothed Probability = 9+1/10+2 = 10/12 or 0.8333
With this calculation the observed success of 65/200 EMA death crosses correlating to an immediate downtrend is 83%
Given the results of the data I personally feel that there is a Very High (83%) chance this death cross that recently formed on the 1 Day chart (around 04/16/2025) will immediately lead to a downtrend. And a Low (17%) chance it does not. Furthermore these results support a technical analysis hypothesis that I formed prior.
Many different systemic factors can contribute to the market movement, but mathematics sometimes leave subtle clues. Will the market become bearish? Or will Nvidia gain renewed bullish interest?
Disclaimer: Not Financial Advice.

Gold Price ActionHey traders! 👋 Looking at the current structure, gold has been respecting the bearish trend perfectly — with each flag pattern breaking down as expected.
🔴 We're now seeing a pullback into a key supply zone and the setup is shaping up for a potential short opportunity.
Let the market come to you, no need to chase 🙌
Manage your risk wisely 📊
Wishing you all green pips and solid setups! 💰✨
Happy Trading! 🔥

BNB Ascending Channel (1W)BINANCE:BNBUSDT remains within an ascending channel dating back to January 2024, with multiple strong reactions at both boundaries.
After testing the upper boundary and hitting a new ATH last December, it entered a clear downtrend (orange trendline) that led to multiple attempts at the channel's support.
Price action is now getting compressed, and we could see a breakout soon.
Key Levels
• To the upside, the main resistance remains ~$700 area.
• Above that, CRYPTOCAP:BNB could have a shot at a new ATH and potentially the channel's upper boundary in the ~$900 area.
• To the downside, in case of a channel breakdown, $400 seems the first logical support (important S/R for previous swings).
Still very uncertain and in a No-Trade Zone until a breakout is confirmed.

DXY Correction Persists: Further Downside Potential in FocusThe DXY remains in a prevailing downtrend, and I estimate that it is currently in the final stages of wave (v) of wave . The correction is projected to extend toward the 97.023–97.739 area. Meanwhile, the nearest potential rebound zone is located between 99.690 and 100.764.

STX Downtrend Breakout + 2x Bull RSI Divergences (1D)BINANCE:STXUSDT broke out of its downtrend after printing two Bull RSI Divergences in a row, and retesting a demand zone dating back to 2019.
Key Levels to Watch
• $0.45: Main Demand Zone, relevant since 2019. A break below it would invalidate the setup.
• $1.20: Arguably the most important S/R throughout STX's history, in place since March 2021 and potentially a strong resistance, also currently reinforced by the 200-day EMA. If reclaimed, it would most likely shift the bias to bullish.
• $2.70-$3.00: Main Supply Zone to overcome for new ATHs, dating back to April 2021.
Definitely worth taking a look at the chart on the monthly timeframe as well, to grasp the full significance of these levels.
All things considered, this seems a high-conviction trade, with a clean invalidation and a very good R/R.

Is gold currently in a bullish or bearish trend?We’ve seen gold surge significantly during times of uncertainty. The problem is, when we look back at the 2008 financial crisis, we notice a similarly exponential rise, which was followed by a 45% correction after reaching its peak. Based on a current price of $3,400, a correction down to $1,800 is possible. This means it’s very realistic that gold could spike again sharply—especially if Powell ends up being fired—and then, once things start to calm down again, we could see a major correction of at least 45%.

We're seeing a nice box breakout NVDA | Bullish?We're seeing a nice box breakout here, which could indicate a good opportunity for a deeper correction. Therefore, we're setting the target at $91.5 and would continue moving lower until we see another box breakout in the opposite direction. Additionally, there is a major resistance level around the $91.5 zone, which will give us insight into how far NVDA's downtrend might go—or whether this could mark the turning point.

IM BEARISH ON NVIDIA WITH A TARGET OF $55.00. HERE IS WHY:NVIDIA (NVDA) Known for their GPUs, recently has experienced a decline in asset price. Trump tariff's may have been a bearish news catalyst, but do the technicals show a bigger bearish picture?
1 Day chart: While the RSI recently signaled oversold conditions, the RSI line looks to be crossing down the RSI based moving average. Furthermore the 200 Day EMA and 65 Day EMAs appear to be forming a death cross. DMI is still indicating bearish, and the ADX is still above 20.
With recent political news, the tech company has been working on bolstering their U.S based production. But with inflation cooling (6 month low) , I believe many high performing blue chip stocks may see a dip as traders and institutions price in deflation, new news and political events.
My opinion on a target is $55.00 , and there is significant open interest on long puts for this price that are expiring in the coming months.
Will NVIDIA pull out of this downtrend? Or will it become a great value buy for investors?
Disclaimer: Not financial advice.

Dow Jones Update: Downside Pressure PersistsI currently estimate that the Dow Jones is in the early stage of wave B of wave (B), as indicated by the black label. This suggests that the index may continue its correction, potentially testing the 38,200–39,186 area before rebounding to challenge the resistance zone around 40,791 and possibly filling the gap between 41,173 and 41,629.
However, under the more bearish scenario (red label), the selling pressure on the Dow Jones remains significant, which may result in the formation of wave , leading to a deeper correction below the 36,611 level.

DXY – Key Level Broken, More Downside Ahead?Hello Folks , Long time no see .
The US Dollar Index (DXY) just broke below 106.5, and things are getting interesting. The trend has been weakening, and price is now sitting at a crucial zone.
📌 Here’s what I’m watching:
107.66 is the big resistance. If price can reclaim it, bulls might have a chance.
105.48 & 104.46 are the next major support levels.
👀 My Take:
If we stay below 106.5, I expect more downside towards 105.4 and maybe 103.3. If price bounces and reclaims 107, I’ll reconsider.
What’s your view? More downside or a bounce coming? Drop your thoughts below! 🚀🔥
🚨 Disclaimer:
Just sharing ideas here—this isn’t a trade advice . Everyone sees the market differently, and the goal is to improve our analysis, not tell anyone what to do. At the end of the day, your trades are your call, your responsibility. Trade smart! 🚀📊

XOM - Bearish in 4 months more DOWNTREND
The price of XOM has gone too far with the MA200. It will have to return to the MA200 as soon as possible if it does not want to crash.
Let's take a look at its price on the WEEK frame. MA50 and MACD support bearish.
On the DAY frame, the volume decreased, the price movement was low, the candles were very weak. The possibility of continuing the downtrend is very high.
Price target up: $105.94.
Price now: $104.56 (11:15 AM, 04.16.25).
Price target down: $98.00/ $91.84.
The price history will repeat itself as in Q4 2023.
IMO amateur trader.

BA - downtrend continuesIn chart week frame, MA50/ MA200, MACD show downtrend for MA continues.
Strong support at $121.02.
The pattern head and shoulders not completed so downtrend continues to $121.02 (maybe on middle of June).
Now price: $155.52.
IMO amateur trader.
